
Recommended
Recommended
More Related Content
What's hot
What's hot (20)
Viewers also liked
Viewers also liked (20)
Similar to How to Identify and Unlock inherent potential within government to achieve more with less in less time - Alan Barnard @ PSE 2013 Vilnius
Similar to How to Identify and Unlock inherent potential within government to achieve more with less in less time - Alan Barnard @ PSE 2013 Vilnius (20)
More from commonsenseLT
More from commonsenseLT (15)
Recently uploaded
Recently uploaded (20)
How to Identify and Unlock inherent potential within government to achieve more with less in less time - Alan Barnard @ PSE 2013 Vilnius
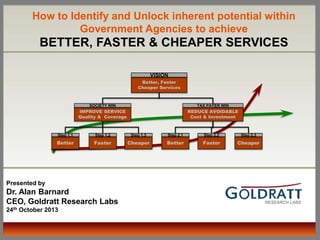
- 1. How to Identify and Unlock inherent potential within Government Agencies to achieve BETTER, FASTER & CHEAPER SERVICES VISION Better, Faster Cheaper Services SOCIETY WIN TAX PAYER WIN IMPROVE SERVICE Quality & Coverage REDUCE AVOIDABLE Cost & Investment Step 1.1 Step 1.2 Step 1.3 Step 2.1 Step 2.2 Step 2.3 Better Faster Cheaper Better Faster Cheaper Presented by Dr. Alan Barnard CEO, Goldratt Research Labs 24th October 2013
- 2. Research Question What problem should be #1 on government’s priority list? Real Gross Domestic Product Year-over-Year Percent Change 10 World 8 Industrialized Economies 6 Emerging and Developing Economies Expansion 4 2 Recession *The IMF Defines Global Recession as 0 World GDP Growth of Less Than 3%... Contraction -2 -4 1984 1986 1988 1990 1992 1994 1996 1998 2000 2002 2004 2006 2008 2010 2012 Sources: International Monetary Fund and Payden & Rygel Estimates Should the risk of a double dip recession be #1 priority? What about the risk of “faster than expected recovery”? © Goldratt Research Labs, 2013 Slide 2
- 3. Outline of Presentation 1. A Looming Resource Shortage Crisis – – Early warning signs of supply vs. demand gap in government agencies Identifying avoidable causes 2. How Theory of Constraints can help to: – – Identify inherent potential to achieve more in with less in less time Providing Focusing and collaborative analysis process to identify the system constraint and resolve conflicts blocking further improvements 3. Case Studies to do it Better, Faster, Cheaper… – – – DOING IT BETTER : Solid Waste Crisis in Africa (Surplus) DOING IT FASTER : World ―Affordable Housing‖ Crisis (Shortage) DOING IT CHEAPER : Funding Crisis for Emergency Relief (Shortage) 4. How to measure if we’re getting Better, Faster& Cheaper? 5. How YOU can help apply TOC in your organization? © Goldratt Research Labs, 2013 Slide 3
- 4. Dr. Eli Goldratt’s real Legacy Standing on the shoulders of Giants “Finally, and most importantly, I wanted to show that we can all be outstanding scientists. The secret of being a good scientist, I believe, lies not in our brain power. We have enough. We simply need to look at reality and think logically and precisely about what we see.” Dr. Eliyahu M. Goldratt 1948 - 2011 Dr. Goldratt, the creator of Theory of Constraints, said the two key abilities to “being an outstanding scientist” are simply: (STEP1) Have the courage to face inconsistencies between what we (expect to) see and the way things are… and then (STEP 2) Have the wisdom to challenge basic assumption(s) to resolve these inconsistencies. Let‘s start with an important inconsistency that affect us all… …And then we can explore the basic assumptions that need to be challenged and the ―How to‖ for making a significant breakthrough… © Goldratt Research Labs, 2013 Slide 4
- 5. Why Change? Is there a gap between our vision for humanity and reality… “A better life for all…” “For we must, together and without delay, begin to build a better life for all… This means creating jobs, building houses, providing education and bringing peace & security for all” Nelson Mandela, 1994. Reality check 2013 How are we doing with realizing this vision..? …in your country? ….in the world? © Goldratt Research Labs, 2013 Slide 5
- 6. Why Change? More and more reports of resource scarcity crises… NEWS AROUND THE WORLD Water scarcity 'now bigger threat than financial crisis’ Looming energy crisis after faster recovery from recession Airport Capacity Crisis: A Critical bottleneck to Sunday, 15 March 2009 Tuesday, Nov. 10, 2009 Wednesday, Dec 16, 2009 Looming US Debt ceiling crisis China’s Population Destiny: The Looming Crisis for China and the world U.N. Warns of Looming Food Crisis by 2015 Monday, April 11,2011 Thursday, April 28,2011 further growth Wednesday, Sept 1, 2010 What are the generic early warning signs and common cause(s) to these resource scarcity crises from around the world? © Goldratt Research Labs, 2013 Slide 6
- 7. Why Change? Early warnings of scarcity crises…Long queues, unreliable supply & high prices High Unemployment/Poverty Delays in Justice System Health System Backlogs Education & Skills Shortages NOT GOOD Examples Demand > Supply Port, Road, Rail Congestion Growing Solid Waste Dumps Housing Shortage Emergency Relief Shortages Food & Water shortages Time ????? In many important areas, demand is growing faster than supply… Why have governments and private sector allowed this to happen and can we find a way to create the SURPLUS capacity (and funding) we need to catch up and to keep the gap closed? © Goldratt Research Labs, 2013 Slide 7
- 8. What to Change? Mistakes In deciding WHEN to change (thinking we still have lots of time….) “The greatest shortcoming of the human race is our inability to understand the exponential function” Prof. Albert A. Bartlett Professor of Physics at the University of Colorado Quantity (e.g. Population) Exponential Growth… then Sigmoidal Limiting Factor: e.g. Finite Resource Capacity “We have (more than) enough and enough time – no need to worry (now)! “Help! We don’t have enough and don’t have enough time…” 1st Turning the Corner – Speed up Point 2nd Turning the Corner – Slow Down Point Time © Goldratt Research Labs, 2013 Slide 8
- 9. What to Change? Example to show full impact of Exponential Growth in Finite Environment SIMPLE EXAMPLE OF EXPONENTIAL GROWTH • You are a (lonely) bacteria in a bottle (finite resource) • Your strain of bacteria doubles every minute (through cell division) • At this growth rate, starting at 11am, it will take just 60mins to fill the bottle with bacteria (resulting in you and 259 or 576 quadrillion tightly squashed neighbors) FEW SIMPLE QUESTIONS 1. At what time do we still have 75% of the available space (finite resource) in the bottle left? 2. At what time will the alarm likely be raised that we are running out of space? 3. How much more time will the discovery of 3 new bottles give us? 4. What time is it for humanity in the consumption of our scarce and finite resources? © Goldratt Research Labs, 2013 1–1 2–2 3–4 4–8 5 – 16 6 – 32 7 – 64 8 – 132 … 60 - 259 Slide 9
- 10. What to Change? Exponential growth in Population – What will be the impact? 13 12 11 10 Alan @ 100 What time is it (for humanity)? Current Population Growth Rate = 1.2% Doubling Time ≈ 60 years Emerging Market GDP Growth = 6.5% Doubling Time ≈ 11 years 9 UN Projection 8 Human Population Billions 7 Alan @ 42 2011 6 2000 5 1987 4 Alan Born 1975 3 1960 2 1930 1 Black Death — The Plague 1800 UN Populat ion Projecti on after 2011 1+ million 7000 6000 5000 4000 3000 2000 1000 A.D. A.D. A.D. A.D. A.D. A.D. years B.C. B.C. B.C. B.C. B.C. B.C. B.C. 1 1000 2000 3000 4000 5000 …the looming resource crisis should not be a surprise (highly predictable)…for how long has there been WARNINGS about this? Source: Population Reference Bureau; and United Nations, World Population Projections to 2100. © Goldratt Research Labs, 2013 Slide 10
- 11. What to Change? Reaching the Limits to (Population) Growth - Club of Rome/MIT Study 197) Estimated population without collapse World Oil Production Natural Resources Estimated population with collapse Life Expectancy Population Food Pollution 1900 Copyright © 2006, Pearson Prentice Hall, Inc. 2000 Year 2013 2100 …so what can GOVERNMENTS do to prevent a resource scarcity crisis and its devastating impact on our vision of ―a better life for all‖? © Goldratt Research Labs, 2013 Slide 11
- 12. What to Change to? CALL for ACTION – What we can and should do to help prevent scarcity crises There are only really three (complimentary) ways to prevent any looming resource scarcity crises: 1. Slow down population and urbanization growth rate (demand) to ensure resources will last longer and more people can improve their quality of life and life expectancy 2. Find ways to ―do more with less in less time‖ to get more out of our scarcest and most finite resources (i.e. better exploit what we have…and not waste it) 3. Accelerate the development of the necessary infrastructure to meet demand…and secure financial & human capital for funding these… Here is how TOC can help do (2) and (3)…
- 13. Part 2 Introduction to Theory of Constraints How to use TOC to achieve BETTER, FASTER and CHEAPER Service? © Goldratt Research Labs, 2008-2013 13
- 14. What to Change to? 5 Focusing Steps of Theory of Constraints to know WHAT to change/what NOT “A chain is only as strong as its weakest link” Step 0: Agree on the System GOAL Step 1: IDENTIFY the System Constraint (WEAKEST LINK) Step 2: Decide how to better EXPLOIT (not Waste) the System Constraint Step 3: SUBORDINATE* everything to the above decision Subordinate = CHANGE only RULES in conflict with decision on how to better exploit/not waste constraint Step 4: ELEVATE the Constraint (get more of it) Step 5: WARNING!!!! If in a previous step the constraint has moved, GO BACK to Step 1, - do not let inertia become the constraint. (However, try not to reach Step 5 else you have to change rules) Supply Step 1 IDENTIFY the Constraint 15/hr 12/hr 12/hr 10/hr Step 3 Step 2 SUBORDINATE Decide How to EXPLOIT the constraint everything to this decision GOAL EXPLOIT potential for more Goal Units PROTECT current level of Constraint Exploitation ↓ Overproduction / Multiitasking ↓ Rework ↓ Starvation/Blockage ↓ Setups/Downtime Current level of Constraint Exploitation + VE + VE Change - VE GOAL New Constraint Exploitation Rules Demand Step 4 Elevate the Constraint GOAL + VE Elevate NOT - VE 13/hr Protective Capacity New level of Constraint Exploitation + VE Change NOT - VE - VE GOAL New Constraint Elevation Rules Step 5 If a constraint has been broken, Go back to Step 1 © Goldratt Research Labs, 2013 Slide 14
- 15. What to Change to? How to achieve MORE with LESS in LESS TIME using TOC… ―In GOD we all trust…the rest must bring DATA!‖ Necessary Cost or Investment Dr. Edwards Deming Unnecessary /Wasted Cost or Investment 100% CCR Total Lead Time ∆LT GAP ―Touch‖ time 60% ∆T GAP Lost Throughput (CCR Time) Current System Throughput Delays / Unproductive time 1. Potential to ↑ Throughput (with same resources): 20 to 100% Current Reality: System Throughput vs. Avail Constraint Capacity is typically <60% Unlock Inherent Potential: Get Throughput = Capacity Constraint Potential + Capacity Buffer 2. Potential to ↓ Lead Time & ↑ DDP/Availability: 20 to 80% Current Reality: “Touch Time vs. Total Lead Time” ratio is <20% and Typical DDP/Avail < 80% Unlock Inherent Potential: Get Total Lead Time to be equal to Touch Time + Time Buffer 3. Potential to ↓ “Unnecessary” Costs/Investment”: 10 to 25% Current Reality: Typical “Unnecessary Cost & Invent” / Total Costs & Invent is 10 to 30% Unlock Inherent Potential: By doing (1) & (2) reduce Unnecessary Cost & Investment Doing MORE BETTER in LESS TIME FASTER with LESS RESOURCE CHEAPER If we increase Flow Rate and reduce Flow Time we also see reductions in “expediting related” costs and capex to ACHIEVE MORE with LESS in LESS TIME
- 16. How to cause the Change? The inherent potential that can be unlocked by FOCUSING on Constraints… A Review by independent academia of 80 global Theory of Constraint Implementation Case Studies showed the following results: Combined Financial Revenue/ Throughput, On-Time-in-Full Service Delivery ↑63% ↑44% ↓65% ↓ 70% ↓49% Inventory Levels Cycle Times Lead Times ↑73% Just imagine the impact on a country like Lithuania if TOC can be applied on critical projects like infrastructure, agriculture, R&D etc. All material © CMG &/or CMS, 2004 Source: The World of Theory of Constraints, Vicky Mabin & Steven Balderstone, St. Lucie Press, 1999
- 17. How to cause the Change? Where should we focus on scarcest resource – management time/attention?. Where do you think improvement is needed most? • For-Profit Organizations (to ensure economic growth) • Education System (to reduce critical Skills Shortages) • Health System (to improve health and quality of life) • Agriculture (to ensure Food Security) • Mining (to ensure availability of natural resources) • Energy (to fuel economic growth) • Airports / Seaports / Road (to reduce congestion, delays) • Accelerating time-to-market of new technologies/drugs • ???
- 18. Part 3 Using TOC’s 5FS to achieve Better, Faster, Cheaper Government Case Studies showing how to do it Better, Faster, Cheaper… 1. Solid Waste Crisis in Africa Achieving Better Quality & Coverage 2. World “Affordable Housing” Crisis Achieving Faster Services 3. Funding Crisis for Emergency Relief Achieving Cheaper Services © Goldratt Research Labs, 2013 Slide 18
- 19. Developing an inclusive Engagement Model Design Criteria 1. Applicability • Robust & Scalable enough to help all types of organizations & individuals identify & unlock inherent potential. 2. Adoption and Sustainability • Must be based on a Systems Approach ( i.e. using latest insights and developments in Theory of Constraints and Systems Thinking) • Be inclusive of ALL key stakeholders, not just in involvement but in active contribution. • Transferability potential through ―Train-the-Trainer‖ 3. Process Effectiveness & Efficiency • Simpler & Faster: Understood by all & Take days, not weeks or months • Better: Provides ―Actionable Information” on where to FOCUS scarce resources in a way that consistently delivers significant & sustainable results to reverse vicious cycle © Goldratt Research Labs, 2013 Slide 19
- 20. TOC 5-Day Constraint & Conflict Analysis Roadmap Finding and challenging limiting assumptions in inclusive way Performance Metric 1 Performance Metric 2 Performance Metric 3 STEP 1 (Day 1) WHY CHANGE? System Goal, Constraint, Gap & UDEs DEMAND UDE 5 (2%) UDE 4 (3%) UDE 3 (10%) UDE 2 (15%) UDE 1 (20%) ∆Impact on Goal Units? STEP 4 (Day 4) HOW TO CAUSE THE CHANGE? CURRENT SUPPLY STEP 2 (Day 2) WHAT TO CHANGE? Conflicts & Current Reality Tree GAP? STEP 5 (Day 5) HOW TO MEASURE & CREATE POOGI? UDE 3 Conflicts Need Action Need Action Action Need UDE 3 Goal Need Goal Action Need UDE 5 Action Action Implementation Roadmap Need New Win/win Solution in Place Need (and new START & STOP rules) Yes, but… OBS 5 IO 5 Yes, but… OBS 3 Yes, but… Yes, but… IO 1 DE 3 Where we are now? Need Goal Action UDE 4 Need Action Action Need Stop Need Goal DE 5 STOP START Core Conflict DE 2 Yes, but… IO 2 UDE 1 Conflicts Action Action UDE 1 Future Reality Tree IO 4 OBS 2 OBS 1 STEP 3 (Day 3) TO WHAT TO CHANGE? OBS 4 IO 3 Action DE 4 DE 1 PUDE New Win/win Need Yes, but… START Goal Need STOP START Need UDE 2 Need Goal Need Action Action Goal Goal UDE 2 Conflicts
- 21. Case Study 1 – Background Solid Waste Crisis in African City Councils • In January 2007, after a TOC Spearhead Conference in Bonn, a partnership was formed between Goldratt Research Labs and InWEnt (Capacity Building International, Germany) • The Objective of the partnership was to test (through a series of selected pilots) whether a simplified TOC approach can be used to help Cities ―Do more with Less in Less Time― • The Pilots selected formed part of InWEnt‗s ―Global Cooperation for Sustainable Urban Development― Program, 2005-09 done in cooperation with UN-Habitat ―Sustainable Cities Programme― and UNEP ―Localizing Agenda 21― • The Pilots Sites include cities from Zambia, Kenya, Nigeria and Tanzania and involved the ―Solid Waste Management― and ―Water Supply Management― Systems within these cities. • The pilots were selected as current problems within Waste Management & Water Supply had major negative consequences for millions of citizens and the environment since the GAP between DEMAND and SUPPLY in city infrastructure are not only very large but growing...
- 22. Case Study 1 – Background Solid Waste Crisis in African City Councils • In most countries, Governments are responsible for ensuring that garbage is collected, transported and disposed of in a safe and environmentally friendly manner. • Common practice is for Private Contractors to collect waste from private businesses and households in formal areas and Community Based Enterprises to collect waste from informal areas. • But often in developing countries these services are not extended to the very poor because they live in areas that are difficult to access or they cannot pay for the service.
- 23. Case Study 1 – Background Solid Waste Crisis in African City Councils • As a result huge piles of rubbish can be found throughout poor settlements, making poverty, persistent ill-health and low environmental quality part of everyday life. WARNING GIVEN TO TOC FACILITATORS • There will be 50-60 participants, high distrust between them, some will be there only to receive daily allowance and traditionally there is high drop-out rate throughout workshop
- 24. Step 1 – Why Change? Large & Growing GAP between Supply & Demand Growth in Waste Created (Demand) vs. Waste Collected (Supply) 2015 Population = 4,000,000 GAP2015 = 1800 t/day 2005 Population = 2,000,000 Independence Population = 200,000 GAPtoday = 700- 800 t/day Waste Collected (Very) Ambitious Target = Close the GAP and keep in closed
- 25. Day 1 Review Key Insights of Theory of Constraints 1. Organizations need to improve at the same rate as what the demand for their product / service is growing (the red curve) 2. Organizations must find ways to achieve this improvement (Growth) without jeopardizing Stability (i.e. every Change = System Improvement) 3. In order to achieve this, organizations should: a. b. c. FOCUS their limited resources on the System Constraint or Weakest Link (using 5FS). FOCUS on finding out to better EXPLOIT OR ELEVATE the System Constraint (using TOC Thinking Processes) All stakeholders contribute to resolve conflicts blocking them to contribute to better EXPLOIT and/or ELEVATE system constraint, and identify and overcome possible negatives of these changes and/or implementation obstacles
- 26. Step 1 – Why Change? The constraint and UDE’s that makes closing the GAP difficult Citizens Business Inspectors WASTE CREATION CBE Contractors WASTE COLLECTION Constraint? The Problem(s) UDE 8: Govt Depts lack of budget UDE 7: Resident don’t (want to) pay UDE 6: Service too expensive GAP UDE 5: People dump/burn illegally 700- Waste Bins/Skips avail UDE 4: No800 ton/day of “Root Causes” Lack of awareness Poor / No Enforcement Waste not collected UDE 3: Frequent Eq break down No Equipment / too old UDE 2: Cannot access all areas UDE 1: No service in some areas Low/No Subscription Rate Actual Collection = 200-300t/day Inspectors City Councils WASTE DISPOSAL Traditional Solution(s) Awareness Campaigns Stricter enforcement of By-Laws Get external Funding to buy/build necessary infrastructure More Awareness Campaigns i.e. THEY JUST NEED MORE MONEY and MORE EDUCATION…
- 27. Day 1 Summary of “Why Change?” Your Undesirable Effects that make closing GAP difficult… Complaint Why it is Bad? UDE making improvement Difficult Stakeholder Impact on rest of System Some Franchise contractors don’t meet demand even if residents pay City looks dirty, becomes unattractive to visitors and we don‘t get investments we need Inadequate storage facilities in some areas Bins are overloaded / residents start disposing waste with pits or fires causing pollution Authorized contractors / CBE‘s do not get enough income to make their business viable No service provider in our area or (if provided) Service provided is unreliable Civil Society Some people don‘t care – just continue with indiscriminate dumping Some residents use unauthorized contractors / don‘t know authorized City Council Residents get negative attitude, waste piles up and all good starting efforts go to waste Forced to use illegal alternatives to dispose (pits/fires) or to dump Service too expensive (we must pay school fees. food etc) Forced to use illegal alternatives to dispose (pits/fires) or to dump We pay but others don‘t CBE can‘t afford to provide service and waste piles up causing sick children etc Even if we don‘t pay, nobody cares No enforcement, encourages non payment
- 28. Day 1 Summary of “Why Change?” Your Undesirable Effects that make closing GAP difficult… Impact on rest of System Takes long time to recover debt, Many residence don’t subscribe and even those that did stops then waste builds up Low subscription by residents (cant afford it , don‘t care or expect it for free) Compromised economies of scale Waste dumped in drains or next to roads must be collected Nobody pays for this – the more it happens the more difficult to recover costs / waste piles up No ―tax holidays‖ / no cheap finance Cannot maintain or upgrade old equipment Trucks cant access all the areas Cant provide service (cant honor contract) & waste piles up or illegal disposal / dumping Some people just don‘t pay (think it should be free or don‘t care) Community Based Enterprise Why it is Bad? Lack of effective enforcement of the law (cant collect debt) Franchise Contractor Complaint UDE making improvement Difficult Stakeholder Waste piles up, resulting in health & environment risks and CBE not sustainable Some people want to pay but cant afford to Can’t provide service which mean waste piles up or illegal disposal / dumping at night Some people don‘t know they should pay or don‘t know consequences Cant provide service which mean waste piles up or illegal disposal / dumping Trucks cant access all the areas Cant provide service which means waste piles up or illegal disposal / dumping
- 29. Step 2 – What to Change? Insights on finding the Core Conflict(s) that explain most UDEs “Define a problem precisely and you are half way to a solution” Alan’s Hypothesis: We have not “defined a problem precisely” unless we’ve defined the pair of unresolved (systemic and symptomatic) conflicts related to the problem… Example: The Problem: Very high finished Goods Inventory… Check: Impact on Company as a whole? Increase Working Capital / Reduce Cash Flow Supply Chain Manager Be a Good SCM Maintain Lowest Cost/unit Pressure to Pressure to Make to Reduce Forecast Systemic Conflict Reduce Invent / Working Capital Increase Warehouse & Distrib. Costs Pressure to Make only to Order Very High Finished Goods Inventory (WH Full) Prices Reduce Inventory / Working Capital Symptomatic Conflict Pressure to NOT Reduce Prices Maintain fair Margins Sales Manager Be a Good Sales Manager
- 30. Step 2 – What to Change? The Unresolved Conflicts associated with UDEs Systemic Conflicts UDE(s) City Council Not Enforce By-Laws / Not Educate more Ensure Resident pay / Viable SWM System Be a Good City Council Not cause Civil Unrest / Not exceed Budget UDE 7: Resident don’t (want to) pay Community Based Enterprise Be a Good Citizen & Parent Dispose of waste using illegal means (Food, Educ etc) Be a Good Citizen (help make CBE viable) Only dispose of waste with legal means UDE 5: People dump /burn illegally Stop providing Service to non-payers Ensure Viability of WMU / Contractors Continue to provide service Enforce Bylaws / Educate more Use Money on only Priorities Symptomatic Conflicts Ensure Health for all Increase Price / Stop providing service Make CBE Viable Business Not increase Price / Continue service Ensure residents pay Be a Good City Council Be a Good Community Based Enterprise
- 31. Step 2 – What to Change? The Unresolved Conflicts associated with UDEs Systemic Conflicts UDE(s) Symptomatic Conflicts Contractors Not invest in new/more Trucks Satisfy Service Agreement with CC Be a Good Contractor Maintain positive cash-flow Satisfy Service agreement with CC Not invest in new / more trucks Invest in new/more trucks UDE 3: Frequent Truck break downs Invest in new /more Trucks Maintain positive cash-flow Use illegal methods to dispose of waste Not allow waste Buildup Be a Good Contractor Residents Stay within Budget Be a good City Council Provide service to all areas Not add more Infrastructure Add sufficient infrastructure UDE 1: No service in some/ most areas Use only legal ways Resident don’t (want to) pay Be a Good Citizen and Parent
- 32. Day 3 Summary of “What to Change to?” Breaking the Core Conflicts in Solid Waste Management System Enforcement Conflict Service Provider Conflict Manage City Council SWMU well Manage Service Provider /CBE well now and in the future now and in the future Must not Waste money or Resources Must have Ensure Compliance Pressure to Must Must Reduce Cost / Risk Meet Service Demand/SLA Pressure to Pressure to Pressure to Don‘t Enforce We have FAIR and (Self) Enforce (Don‘t (Tolerate/give more tolerate nonENFORCEABLE By-Laws time/educ) compliance) Not invest We know when & where to / spend Invest / Spend more moreinvest and when not to… Pricing Conflict Payment Conflict Manage Pricing Authority well Be a Good Citizen now and in the future now and in the future Must Recover full cost + margin Must Increase income & compliance Must Must Not Waste money Comply & get full Service Benefit Pressure to on Pressure to Price onWe Price basedPrice on Customer Customer Perception of Provider PoV PoV Value Pressure to Those Pressure to Citizen that can Not to Pay (use and those that can’t, Pay To pay, pay alternatives) pay in kind. (use legal method)
- 33. Day 4 - How to Cause the Change? Overcoming Implementation “Yes, buts…” YES BUT 2 - OBSTACLES? WIN:WIN SOLUTION OBS1.1 New Fair & Enforceable By-laws not yet drawn up IO1.1 City Council SWMU prepare draft by-laws by Enforcement Agency INJ 1 We have FAIR and (Self) ENFORCEABLE By-Laws Jan08 YES BUT 1 - NEGATIVES? INJ 1.1 Community Leaders appointed to SWMU committee PUDE 1.1 Community unrest due to enforcement Service Providers OBS 2.1 OBS 2.2 IO 2.1 INJ 2 We know when & where to invest and when not to… IO 2.2 Pricing Authority OBS 3.1 OBS 4.1 OBS 4.2 INJ 2.1 IO 3.1 IO 4.1 IO 4.2 INJ 3 We Price based on Customer Perception of Value Good Citizens INJ 4 Those Citizen that can pay, pay and those that can’t, pay in kind. INJ 3.1 PUDE 2.1 PUDE 3.1 INJ 3.2 PUDE 3.2 INJ 4.1 PUDE 4.1 INJ 4.2 PUDE 4.2
- 34. Testing within the Public Sector How do we apply the process in the Public Sector? Participants representing all stakeholders at the beginning… The (nervously excited) facilitator … Active (and fun) participation in the African Sun… System Process Map, Conflicts & solutions developed by proud participants…
- 35. Testing within the Public Sector What has been the Stakeholder feedback? 1. I’m Very grateful on my being able to fully participate. We have seen that with TOC, Goals are possible (even if they look impossible) and that the key is to find win-win solutions and focus on weakest link – City Councilor 2. I did not expect much but now have seen it is possible to work with all the stakeholders as our real goal (to improve the lives of everyone in our community) is the same – Private Contractor 3. Discovered that we had a very big gap in our system. Previously thought we can only close it by getting more / new equipment. Now Leant that I get more with the same equipment using TOC approach - Private Contractor 4. I learned about that “cost of doing nothing” can be very high. In the health sector the “cost of doing nothing” is a matter of life and death. TOC showed that optimizing our capacity can be achieved even with less resources by improving the efficiency of available resources – Doctor 5. I learned the need for planning and that the impossible can be possible - Chairman of a community settlement 6. TOC can even help to address the political issues – Councilor 7. My expectation was low at start of workshop, but have learned the need and benefit for everybody’s (all stakeholders) participation using this TOC process- Council officer 8. learned that TOC is a window that gives a chance to look at the challenges we face in a different perspective - University lecturer
- 36. Testing within the Public Sector What has been the Stakeholder feedback? 9. Learned I should avoid multitasking and do one thing at a time - Hospital manager 10. Learned the importance of defining the problem precisely before dealing with it - Deputy mayor 11. Learned that the best solution comes by asking the right question – Councilor 12. Learned that the solution to our constraints is within ourselves – Contractor 13. Learned I should not wait for more/new resources but (using TOC) can start with what we have to do more with the same resources – Habitat for Humanity officer 14. Revisited the pricing conflict and realized that there is a way of agreeing on the right price with customers – Contractor 15. A long time since I have been to school – but learned to accept my limitations and focus on exploiting what we have first before asking for more - Small contractor 16. The bottleneck is always on the top – so I could be the weakest link – Owner 17. I will go and find out the weakest link in the process I lead - Operations manager 18. I learned that if you can or you can‘t, you are right. – The coin has two sides and each is necessary- Lecturer 19. I‘m now inspired to take a new direction in our company and (using TOC) think I can now find out why we are not able to provide the service to the satisfaction of the client - Small operator
- 37. Independent Auditors Report on the results achieved within the Pilot Projects
- 38. Lessons Learned & Next Steps Moving from Analysis & Planning to Execution… 1. It is possible to “Do MORE with LESS in LESS TIME” using TOC’s 5FS within Public Sector with all stakeholders… by finding ways to close SUPPLY-DEMAND GAP from both sides quickly… GAP 800 ton /day Collected 200 ton/day TODAY GAP 400 ton /day Waste Collected 400 ton/day AFTER “EXPLOIT” 100 ton /day Waste Collected 700 ton/day AFTER “ELEVATE” 2. Three Important steps in analysis (which should not be skipped): a) b) c) Make sure ALL stakeholders are present/represented in workshops Recognizing past achievements (but show current & future GAP) Getting agreement which current/planned Projects can be stopped to release the capacity / budget needed to fully resource constraint focused projects 3. “Vision without Execution is a Hallucination” Capacity Building (without follow-up and follow-through) will not deliver any significant and sustainable results (to close GAP and keep it closed)
- 39. CASE STUDY 2 Using TOC to achieve FASTER Government services © Goldratt Research Labs, 2008-2013 39
- 40. World Housing Shortage Crisis Facts from Habitat for Humanity The world is experiencing a global housing crisis • Worldwide, some 827.6 million people live in urban slums.1 • By 2020, it is estimated the world slum population will reach almost 1 billion.2 • About 50 percent of the world's population now live in urban areas.1 • Lack of clean water and sanitation claim the lives of more than 1.8 million young children every year.3 Decent, stable housing provides more than just a roof over someone’s head • Stability for families and children. • Sense of dignity and pride. • Health, physical safety and security. • Increase of educational and job prospects. Housing must become a priority • In many countries, the minimum wage is LESS than the rental cost of affordable housing • As a result, the percentage of people without access to decent, stable housing is rising. • Increasing the housing supply across the globe is essential. • Adequate housing is vitally important to the health of the world‘s economies, communities and populations. • If we are to succeed in the fight against poverty, we must support the expansion of housing both as policy and as practice. © Goldratt Research Labs, 2008-2013 40
- 41. HABITAT FOR HUMANITY WORLD SPEED RECORD How TOC’s CCPM can help increase speed of house construction • In 1999, a group using TOC‘s Critical Chain method, set a new ―Habitat for Humanity World Speed Record‖ for completing a 4 Bedroom House • Warren Jack who lead the team said "The technique of Goldratt's Critical Chain technique was one of the two Key Success factors that enabled the Speedbuild team to set a new Habitat World Record. • The second was the wall construction method developed in New Zealand by Laser Systems Ltd under the trademark "Laserbilt". • The team used Goldratt‘s CCPM method and software to help identify the Critical Chain in the Project and then to focus on identifying and eliminating planned delays due to process/resource dependencies and execution delays due to multitasking and unsychronized priorities. • The new world record was 3 Hours, 44 Minutes & 59 Seconds • A documentary detailing the building of this Habitat For Humanity house was aired in New Zealand on Easter Monday, April 5, 1999 at 8:30pm on TV1. © Goldratt Research Labs, 2008-2013 41
- 42. Australian Housing Shortage Crisis Facts from National Housing Supply Council • The Australian National Housing Supply Council released its third State of Supply report, estimating a housing supply shortage of 214,700 dwellings. It predicted that this shortage will reach 328,800 dwellings by 2015 and 640,200 dwellings by 2030. • The quarterly number of ―completions‖ and the number of ―under-constructions‖ shown below illustrate the difference between how the industry reacts to the demand and what the actual change in output of housing supply. • As we can see, the actual output of the industry has not changed significantly during last 25 years, while the number of dwellings under construction has had a significant increase © Goldratt Research Labs, 2008-2013 42
- 43. Australian Housing Shortage Crisis Facts from National Housing Supply Council • The inconsistency between the trend of number of dwellings under construction and number of completions shows that the house building industry has responded to the higher demands by signing more contracts and accepting more work. However, it could not produce higher number of houses and its output remained constant. • This phenomenon indicates a situation in which limitation of production capacity does not allow a system to produce more. The past ten years show that the industry has reached its capacity and with its current structure, it cannot produce more dwellings than this. • Knowing that there is already a shortage in supply and demand will probably increase due to population growth, the need for an increase in housing supply will be inevitable. This cannot be achieved with the current production capacity and limited resources. Thus, the only remaining way to improve the capacity would be through innovation and finding better ways of using the same level of resources for producing more dwellings © Goldratt Research Labs, 2008-2013 43
- 44. CRITICAL CHAIN PROJECT MANAGEMENT Challenging assumptions on how to do construction projects Project A A1.1 A1.2 A1.3 A1.1 A1.2 A1.3 A1.4 A1.5 A1.1 A1.2 Project B B1.1 B1.2 B1.3 B1.1 B1.2 B1.3 B1.4 B1.5 B1.1 B1.2 Project C C1.1 C1.2 C1.3 C1.1 C1.2 C1.3 C1.4 C1.5 C1.1 C1.2 0 2 4 6 8 10 12 14 16 Each of these Projects represent the 3-phased construction project to build a house with 10 main ―tasks‖ each taking 2 weeks = 20 weeks total duration 18 20 22 24 26 28 30 32 34 36 38 40 42 44 46 48 50 52 54 56 58 60 Scenario 1: Multi-Tasking Blue A1.1 B1.1 C1.1 A1.2 B1.2 C1.2 A1.3 B1.3 C1.3 Red A1.1 B1.1 C1.1 A1.2 B1.2 C1.2 A1.3 B1.3 C1.3 A1.4 B1.4 C1.4 A1.5 B1.5 C1.5 Green A1.1 B1.1 C1.1 A1.2 B1.2 C1.2 0 2 4 6 8 10 12 14 16 18 20 22 24 26 28 30 32 34 36 38 40 42 44 46 48 50 52 54 56 58 60 Project A Complete Project A A1.1 A1.2 A1.3 A1.1 A1.2 A1.3 A1.4 A1.5 A1.1 A1.2 Project B Complete Project B B1.1 B1.2 B1.3 B1.1 B1.2 B1.3 B1.4 B1.5 B1.1 B1.2 Project C Complete Project C C1.1 C1.2 C1.3 C1.1 C1.2 C1.3 C1.4 C1.5 C1.1 C1.2 Scenario 2: No Multi-Tasking Blue A1.1 A1.2 A1.3 Red B1.1 B1.2 B1.3 A1.1 A1.2 A1.3 C1.1 C1.2 C1.3 B1.1 B1.2 B1.3 C1.1 C1.2 C1.3 A1.1 A1.2 A1.3 A1.4 A1.5 B1.1 B1.2 B1.3 B1.4 B1.5 C1.1 C1.2 C1.3 C1.4 C1.5 A1.1 A1.2 A1.3 A1.4 A1.5 B1.1 B1.2 B1.3 B1.4 B1.5 C1.1 C1.2 C1.3 C1.4 C1.5 Green A1.1 A1.2 0 2 4 6 8 10 12 14 16 B1.1 B1.2 18 20 22 24 26 28 C1.1 C1.2 30 32 34 36 38 A1.1 A1.2 40 42 44 46 Project A Complete Project A A1.1 A1.2 A1.3 A1.1 A1.2 A1.3 A1.4 A1.5 A1.1 A1.2 SAVING IN TIME and TIME-SENSITIVE COST $$$ Project B Complete Project B B1.1 B1.2 B1.3 B1.1 B1.2 B1.3 B1.4 B1.5 B1.1 B1.2 Project C Complete Project C C1.1 C1.2 C1.3 C1.1 C1.2 C1.3 C1.4 C1.5 C1.1 C1.2 48 B1.1 B1.2 50 52 54 56 58 C1.1 C1.2 60
- 45. CASE STUDY 3 Using TOC to achieve CHEAPER Government services © Goldratt Research Labs, 2008-2013 45
- 46. What is the impact of BETTER + FASTER on CHEAPER? CHEAPER The Total Cost per Quality Service Unit (should) go down (even more) Governments increase QUALITY THROUGHPUT with the same Resources Governments are able to increase the SERVICE QUALITY & COVERAGE with same resources BETTER Are there any other ways TOC can help to better exploit limited Budgets? Governments reduce AVOIDABLE COSTS due to reducing rework, expediting, overti me etc. Governments are able to increase SERVICE SPEED with same resources FASTER
- 47. CASE 3: EMERGENCY RELIEF AGENCY Reducing budget losses due to “use-it-or-lose-it” policy Cash not used should be returned Hungry People Cash Constraint Central Bank Account Region 1 Bank Account Suppliers Region 1 Distr Center Region 1 Emergency Relief Region 2 Bank Account Suppliers Region 2 Distr Center Region 2 Emergency Relief Region N Bank Account Central Cash Buffer Suppliers Region N Distr Center Region N Emergency Relief Food Donors Cash / Food allocated based on Regional Central Food Buffer Forecast in $ and/or Tons of aid needed Central Distr Center Food Aid not used should be returned IF there there is 1) a real fear of under-forecasting aid required (people could die) AND 2) an unwritten rule of ―Use-it-or-lose-it‖ THEN How much of the excess CASH and FOOD will ever be returned to the Central buffers? Share Success Stories to secure more donations / donors
- 48. HOW DO WE MEASURE BETTER, FASTER, CHEAPER? © Goldratt Research Labs, 2008-2013 48
- 49. Good Early Warning Measurements What is the best way to measure if we are achieving BETTER, FASTER, CHEAPER? Cumulative Flow Diagrams Higher WIP WIP Longer Supply LT Supply Lead Time Time Longer Supply LT Time Time QUALITY THROUGHPUT PRODUCTIVITY 25% Late / Not served 20% 15% Operational Productivity = $T/$OE or QT/OE Productivity 75% of On-time / Coverage Higher WIP 15% 10% 10% 5% 0-5d 5-10d 10-15d 15-20d 20-25d 25-30d 30-35d 35-40d > 40d Time in Days Productivity = Rate at which system is generating goal units (Output or Quality Throughput) Rate at which system is spend or investing money (Input or Operating Expenses)
- 50. SUMMARY OF KEY INSIGHTS DOING IT BETTER • What is the constraint to achieving better quality and coverage ? The Capacity Constraint or Bottleneck … find it by looking for the backlog due to demand / supply gap… • How to better exploit this constraint? Reduce capacity losses on bottleneck due to starvation, blockage, downtime, rework etc. (capitalize on law of the weakest link) DOING IT FASTER • What is the constraint to increasing speed? Time to complete tasks on longest chain of dependent tasks (Critical Chain)… • How to better exploit constraint?: Reduce delays on critical chain due to multi-tasking, waiting for decisions, unsynchronized priorities etc. (capitalize on law of improving flow) DOING IT CHEAPER • Where is the constraint? Available Budget • How to better exploit constraint? Stop initiatives that wont contribute to the highest priority objectives and remove any forms of “Use it or lose it” (capitalize on law of aggregation).
- 51. ABOUT THE PRESENTERS Dr. Alan Barnard (PhD) Dr. Alan Barnard is one of the leading experts in the world in Theory of Constraints (TOC) frequently worked with Dr. Eli Goldratt, creator of Theory of Constraints on large and complex projects around the world. He is the CEO of Goldratt Research Labs (USA), Chairman of Realization Africa (RSA), African Phosphates (RSA) and The Odyssey Institute (USA). Alan is also a board member of TOCICO and the Dr. Eliyahu M. Goldratt Foundation. In 2009, Alan was awarded a PhD in Management of Technology & Innovation, from the Da Vinci Institute in 2009 with a thesis titled “How to identify and unlock inherent potential within organizations (private & public) and individuals?”. Alan is also the author of 2 chapters in the McGraw Hill published Theory of Constraints Handbook. Alan is a past-President of SAPICS (2000 to 2002) and past-President of TOCICO (2003 to 2005) and serve on the judging panels of the Logistics Achiever Awards and Technology Top 100. He has worked with global companies such as ABB, BHP, Cisco, SAP, Random House Publishing, Tata in the Private sector and also with UN DP, UN WFP and InWent in the public sector on applying for example Theory of Constraints to City Councils in Developing Countries in the Public Sector to help them identify and unlock inherent potential to achieve more with the same resources in less time.
- 52. Author Contact Details • alan@goldrattresearchlabs.com • www.goldrattresearchlabs.com • www.harmonytoc.com © Goldratt Research Labs, 2008-2013 52
Editor's Notes
- Average World GDP Growth been 3.5% = Doubling Time of 20 yearsAverage World GDP per Capita = $10,900 per person, South African = $10,500 (77), China = $35,000 (20), USA = $47,000 (7), Quatar =$88,000 (1)
- Is the Average Demand MORE than the Available Supply Capacity or Simply more than the Productive Supply Capacity (less waste)?
- Thomas Malthus: An Essay on the Principle of Population 1798. Predicted a pessimistic view on the dangers of overpopulation & claimed that food supply was the main limit to population growthMalthus believed the population increases exponentiallywhereas food supply will after some period only grow linearly (2,4,6,8etc) being limited by availability of productive land and water.
- Many of the emerging markets and even the developed markets are facing a large and growing affordable housing shortage problem.Even the UK, they are estimating a shortage of 750,000 homes by 2025
- When I did this project, Cash donations were around $2b and Food Aid around 3.5million tons/annum, feeding over 80 million people
- When I did this project, Cash donations were around $2b and Food Aid around 3.5million tons/annum, feeding over 80 million people