Stock Research Report for Webmd Health Cp WBMD as of 9/22/11 - Chaikin Power Tools
•
1 like•302 views

To order a free Chaikin Power Gauge stock research report for WBMD go to http://www.chaikinpowertools.com/reports

Recommended
More Related Content
Viewers also liked
More from Dan Oconnor
More from Dan Oconnor (10)
Recently uploaded
Recently uploaded (20)
Stock Research Report for Webmd Health Cp WBMD as of 9/22/11 - Chaikin Power Tools
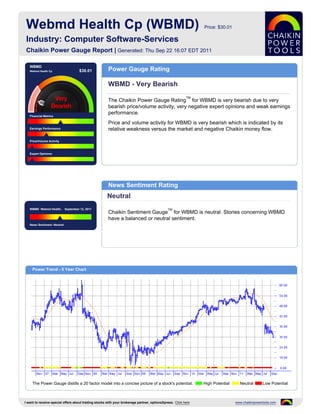
- 1. Webmd Health Cp (WBMD) Price: $30.01 Industry: Computer Software-Services Chaikin Power Gauge Report | Generated: Thu Sep 22 16:07 EDT 2011 WBMD Webmd Health Cp $30.01 Power Gauge Rating WBMD - Very Bearish TM The Chaikin Power Gauge Rating for WBMD is very bearish due to very bearish price/volume activity, very negative expert opinions and weak earnings performance. Financial Metrics Price and volume activity for WBMD is very bearish which is indicated by its Earnings Performance relative weakness versus the market and negative Chaikin money flow. Price/Volume Activity Expert Opinions News Sentiment Rating Neutral WBMD Webmd Health.. September 12, 2011 TM Chaikin Sentiment Gauge for WBMD is neutral. Stories concerning WBMD have a balanced or neutral sentiment. News Sentiment :Neutral Power Trend - 5 Year Chart The Power Gauge distills a 20 factor model into a concise picture of a stock's potential. High Potential Neutral Low Potential I want to receive special offers about trading stocks with your brokerage partner, optionsXpress. Click here www.chaikinpowertools.com
- 2. Financials & Earnings Financial Metrics Financial Metrics Rating LT Debt/Equity Ratio Neutral Price to Book Value WBMD's financial metrics are neutral. The company generates high free cash flow relative to market capitalization and is carrying too much long term debt. Return on Equity The rank is based on a high long term debt to equity ratio, high price to book value ratio, high price to sales ratio and relatively high cash flow. Price to Sales Ratio Business Value Assets and Liabilities Valuation Returns Ratio TTM Ratio TTM Ratio TTM Current Ratio 8.25 Price/Book 2.54 Return on Invest 6.3% LT Debt/Equity 0.00 Price/Sales 3.29 Return on Equity 10.2% Earnings Performance Earnings Performance Rating Earnings Growth Bearish Earnings Surprise WBMD's earnings performance has been weak. The company has not met analysts' earnings estimates and is priced relatively high compared to next year's projected EPS. Earnings Trend The rank is based on high earnings growth over the past 3-5 years, worse than Projected P/E Ratio expected earnings in recent quarters, a relatively high projected P/E ratio and inconsistent earnings over the past 5 years. Earnings Consistency 5 Year Revenue and Earnings Growth EPS Estimates 12/06 12/07 12/08 12/09 12/10 Factor Actual EPS Prev EST EPS Current Change Revenue(M) 253.88 331.95 382.78 438.54 534.52 Quarterly EPS $0.23 $0.17 -0.06 Rev % Growth 50.28% 30.75% 15.31% 14.57% 21.89% Yearly EPS $0.97 $1.24 +0.27 EPS $0.08 $1.15 $0.46 $2.45 $0.97 Factor Actual EPS Growth Est EPS Growth Change EPS % Growth -46.67% 1,337.50% -60.00% 432.61% -60.41% 3-5 year EPS 26.56% 19.00% -7.56 EPS Surprise EPS Quarterly Results Estimate Actual Difference % Difference FY Qtr 1 Qtr 2 Qtr 3 Qtr 4 Total Latest Qtr $0.21 $0.21 $0.00 0.00 12/09 $0.05 $0.04 $0.22 $1.84 $2.15 1 Qtr Ago $0.15 $0.19 $0.04 26.67 12/10 $-0.07 $0.14 $0.23 $0.63 $0.93 2 Qtr Ago $0.43 $0.47 $0.04 9.30 12/11 $0.33 $0.37 - - - 3 Qtr Ago $0.22 $0.24 $0.02 9.09 Fiscal Year End Month is December. I want to receive special offers about trading stocks with your brokerage partner, optionsXpress. Click here www.chaikinpowertools.com
- 3. Price Trend & Expert Opinions Price/Volume Activity Price/Volume Activity Rating Relative Strength vs Market Very Bearish Chaikin Money Flow Price and volume activity for WBMD is very bearish. WBMD has underperformed the S&P 500 over 26 weeks and is experiencing sustained selling. Price Trend The rank for WBMD is based on its relative weakness versus the market, Price Trend ROC negative Chaikin money flow, a negative Chaikin price trend, a positive Chaikin price trend ROC and a decreasing volume trend. Volume Trend Relative Strength vs S&P500 Index Chaikin Money Flow Chart shows whether WBMD is performing better or worse than the market. Chaikin Money Flow analyzes supply and demand for a company's stock. Price Activity Price Activity Volume Activity Factor Value Factor Value Factor Value 52 Week High 58.17 % Change Price - 4 Weeks -10.85% Average Volume 20 Days 689,970 52 Week Low 30.00 % Change Price - 24 Weeks -41.00% Average Volume 90 Days 1,182,338 % Change YTD Rel S&P 500 -34.72% % Change Price - 4 Wks Rel to S&P -10.02% Chaikin Money Flow Persistency 29% % Change Price - 24 Wks Rel to S&P -32.47% Expert Opinions Expert Opinions Earnings Estimate Revisions Very Bearish Short Interest Expert opinions about WBMD are very negative. Analysts are lowering their EPS estimates for WBMD and insiders are not net buyers of WBMD's stock. Insider Activity The rank for WBMD is based on analysts revising earnings estimates downward, insiders not purchasing significant amounts of stock, optimistic analyst opinions Analyst Opinions and relative weakness of the stock versus the Computer Software-Services industry group. Relative Strength vs Industry Earnings Estimate Revisions Analyst Recommendations EPS Estimates Revision Summary Current 7 Days Ago % Change Factor Value Last Week Last 4 Weeks Current Qtr 0.17 0.16 +6.25% Mean this Week Buy Up Down Up Down Next Qtr 0.44 0.44 0.00% Mean Last Week Buy Curr Qtr 0 0 0 1 Curr Yr 0 0 0 1 Current 30 Days Ago % Change Change +0.39 Next Qtr 0 0 0 1 Current FY 1.24 1.26 -0.02 Mean 5 Weeks Ago Buy Next Yr 0 0 0 1 I want to receive special offers about trading stocks with your brokerage partner, optionsXpress. Click here www.chaikinpowertools.com
- 4. The Company & Its Competitors WBMD's Competitors in Computer Software-Services News Headlines for WBMD Company Power Historic EPS Projected EPS Profit Margin PEG PE Revenue(M) WebMD Announces $75 Million Stock Gauge growth growth Repurchase Program - Aug 15, 2011 WBMD 26.56% 19.00% 15.83% 1.28 26.55 535 WebMD Announces $75 Million Stock PWRD 63.76% 15.17% 33.46% 0.28 5.03 374 Repurchase Program - Aug 15, 2011 WebMD Launches Leading Consumer Health SNDA 32.28% 15.12% 5.11% 2.07 41.62 846 App for Android - May 10, 2011 CHINA 7.11% - -16.38% - - 318 WebMD expects 1Q results to beat expectations - Apr 12, 2011 GAME -3.38% 10.38% 26.40% 0.66 7.07 680 WebMD to buy back convertible notes - Dec 14, NTES 32.40% 15.45% 44.81% 0.79 13.22 834 2010 CYOU 22.26% 17.61% 52.75% 0.44 8.56 327 SINA 17.01% 22.01% -9.99% 5.68 72.02 403 Company Details Company Profile WEBMD HEALTH CP WebMD announced today that is has signed an agreement to acquire Conceptis 111 EIGHTH AVE. Technologies Inc., a Montreal-based provider of online and offline medical education and NEW YORK, NY 10011 promotion aimed at physicians and other healthcare professionals. Conceptis has been USA successful in developing a strong online presence in the cardiology community and is Phone: 212-624-3700 highly respected for the depth and breadth of content contained on its flagship. With the Fax: 212-624-3800 combination of two of the leading cardiology channels on the Internet, Medscape Website: http://www.webmd.com Cardiology and www.theheart.org, WebMD is well positioned to further its lead and Full Time Employees: 1,630 penetration in this high value segment of medical marketing. Sector: Computer and Technology Power Gauge Ratings are created using a relative ranking system that assigns a rank of 0 to 100 (100 being the highest) to each stock in the universe. Rank is calculated by evaluating each of the stocks factors and combining them into a single number using a weighting formula. A stock's rank ranges from 100-0, where 100 is the strongest, and a rank of 95 indicates the stock is better than 95% of the stocks in the universe. Chaikin Stock Research(CSR) is not registered as a securities broker dealer or investment advisor with either the U.S. Securities and Exchange Commission or with any state securities regulatory authority. CSR is not responsible for trades executed by users of this research report, our web site or mobile app based on the information included herein. The information presented in this report does not represent a recommendation to buy or sell stocks or any financial instrument nor is it intended as an endorsement of any security or investment. The information in this report is generic by nature and is not personalized to the specific financial situation of any individual. The user bears complete responsibility for their own investment research and should seek the advice of a qualified investment professional before making any investment decisions. Copyright (c) 1978-(Present) by ZACKS Investment Research, Inc ("ZACKS"). The information, data, analyses and opinions contained herein (1) includes the confidential and proprietary information of ZACKS, (2) may not be copied or redistributed, for any purpose, (3) does not constitute investment advice offered by ZACKS, (4) are provided solely for informational purposes, and (5) are not warranted or represented to be correct, complete, accurate or timely. ZACKS shall not be responsible for investment decisions, damages or other losses resulting from, or related to, use of this information, data, analyses or opinions. Past performance is no guarantee of future performance. ZACKS is not affiliated with Chaikin Power Tools. This report from Chaikin Power Tools is for informational purposes only and is not a recommendation to buy or sell securities. LM 2.3 DS 3.0 LS 2.1 Data Provided by ZACKS Investment Research, Inc., www.zacks.com Special offers to trade stocks from optionsXpress: www.chaikinpowertools.com