Stock Research Report for GS as of 8/17/11 - Chaikin Power Tools
•
0 likes•102 views

To order a free Chaikin Power Gauge stock research report for GS go to http://www.chaikinpowertools.com/reports

Recommended
Recommended
More Related Content
Recently uploaded
Recently uploaded (20)
Featured
Featured (20)
Stock Research Report for GS as of 8/17/11 - Chaikin Power Tools
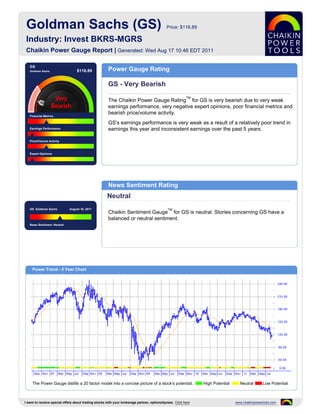
- 1. Goldman Sachs (GS) Price: $116.89 Industry: Invest BKRS-MGRS Chaikin Power Gauge Report | Generated: Wed Aug 17 10:46 EDT 2011 GS Goldman Sachs $116.89 Power Gauge Rating GS - Very Bearish TM The Chaikin Power Gauge Rating for GS is very bearish due to very weak earnings performance, very negative expert opinions, poor financial metrics and bearish price/volume activity. Financial Metrics GS's earnings performance is very weak as a result of a relatively poor trend in Earnings Performance earnings this year and inconsistent earnings over the past 5 years. Price/Volume Activity Expert Opinions News Sentiment Rating Neutral GS Goldman Sachs August 16, 2011 TM Chaikin Sentiment Gauge for GS is neutral. Stories concerning GS have a balanced or neutral sentiment. News Sentiment :Neutral Power Trend - 5 Year Chart The Power Gauge distills a 20 factor model into a concise picture of a stock's potential. High Potential Neutral Low Potential I want to receive special offers about trading stocks with your brokerage partner, optionsXpress. Click here www.chaikinpowertools.com
- 2. Financials & Earnings Financial Metrics Financial Metrics Rating LT Debt/Equity Ratio Bearish Price to Book Value GS's financial metrics are poor. The company is carrying too much long term debt and has relatively low revenue per share. Return on Equity The rank is based on a high long term debt to equity ratio, low price to book value and high price to sales ratio. Price to Sales Ratio Business Value Assets and Liabilities Valuation Returns Ratio TTM Ratio TTM Ratio TTM Current Ratio 0.78 Price/Book 0.87 Return on Invest 3.2% LT Debt/Equity 2.48 Price/Sales 1.55 Return on Equity 11.7% Earnings Performance Earnings Performance Rating Earnings Growth Very Bearish Earnings Surprise GS's earnings performance has been very weak. The company experienced relatively poor earnings growth in the past 12 months and has an erratic 5 year earnings trend. Earnings Trend The rank is based on a relatively poor trend in earnings this year, a relatively low Projected P/E Ratio projected P/E ratio and inconsistent earnings over the past 5 years. Earnings Consistency 5 Year Revenue and Earnings Growth EPS Estimates 12/06 12/07 12/08 12/09 12/10 Factor Actual EPS Prev EST EPS Current Change Revenue(M) 69,353.00 87,968.00 53,579.00 51,673.00 39,161.00 Quarterly EPS $3.19 $2.80 -0.39 Rev % Growth 59.83% 26.84% -39.09% -3.56% -24.21% Yearly EPS $14.15 $11.53 -2.62 EPS $20.93 $26.34 $4.67 $23.74 $14.15 Factor Actual EPS Growth Est EPS Growth Change EPS % Growth 78.43% 25.85% -82.27% 408.35% -40.40% 3-5 year EPS 3.96% 11.33% +7.37 EPS Surprise EPS Quarterly Results Estimate Actual Difference % Difference FY Qtr 1 Qtr 2 Qtr 3 Qtr 4 Total Latest Qtr $2.29 $1.85 $-0.44 -19.21 12/09 $3.48 $5.27 $5.74 $9.01 $23.50 1 Qtr Ago $0.79 $1.56 $0.77 97.47 12/10 $6.02 $0.84 $3.19 $4.10 $14.15 2 Qtr Ago $3.78 $3.79 $0.01 0.26 12/11 $1.66 $1.96 - - - 3 Qtr Ago $2.29 $2.98 $0.69 30.13 Fiscal Year End Month is December. I want to receive special offers about trading stocks with your brokerage partner, optionsXpress. Click here www.chaikinpowertools.com
- 3. Price Trend & Expert Opinions Price/Volume Activity Price/Volume Activity Rating Relative Strength vs Market Bearish Chaikin Money Flow Price and volume activity for GS is bearish. GS is experiencing sustained selling and has underperformed the S&P 500 over 26 weeks. Price Trend The rank for GS is based on its relative weakness versus the market, negative Price Trend ROC Chaikin money flow, a negative Chaikin price trend and a positive Chaikin price trend ROC. Volume Trend Relative Strength vs S&P500 Index Chaikin Money Flow Chart shows whether GS is performing better or worse than the market. Chaikin Money Flow analyzes supply and demand for a company's stock. Price Activity Price Activity Volume Activity Factor Value Factor Value Factor Value 52 Week High 175.00 % Change Price - 4 Weeks -9.04% Average Volume 20 Days 8,742,894 52 Week Low 110.34 % Change Price - 24 Weeks -27.55% Average Volume 90 Days 6,717,307 % Change YTD Rel S&P 500 -26.11% % Change Price - 4 Wks Rel to S&P 1.17% Chaikin Money Flow Persistency 13% % Change Price - 24 Wks Rel to S&P -20.65% Expert Opinions Expert Opinions Earnings Estimate Revisions Very Bearish Short Interest Expert opinions about GS are very negative. Analysts are lowering their EPS estimates for GS and analysts's opinions on GS have been more negative Insider Activity recently. The rank for GS is based on analysts revising earnings estimates downward, a Analyst Opinions low short interest ratio and pessimistic analyst opinions. Relative Strength vs Industry Earnings Estimate Revisions Analyst Recommendations EPS Estimates Revision Summary Current 7 Days Ago % Change Factor Value Last Week Last 4 Weeks Current Qtr 2.80 2.80 0.00% Mean this Week Buy Up Down Up Down Next Qtr 4.52 4.52 0.00% Mean Last Week Buy Curr Qtr 0 0 0 12 Curr Yr 0 0 2 14 Current 30 Days Ago % Change Change 0.00 Next Qtr 0 0 4 8 Current FY 11.53 12.57 -1.04 Mean 5 Weeks Ago Buy Next Yr 0 0 2 13 I want to receive special offers about trading stocks with your brokerage partner, optionsXpress. Click here www.chaikinpowertools.com
- 4. The Company & Its Competitors GS's Competitors in Invest BKRS-MGRS News Headlines for GS Company Power Historic EPS Projected EPS Profit Margin PEG PE Revenue(M) Firm accused of defrauding 5 Wis. school Gauge growth growth districts - Aug 10, 2011 GS 3.96% 11.33% 21.07% 0.89 11.48 39,161 Credit Union Regulator Accuses Goldman - Aug INTL 998.08% - 0.05% - 13.76 46,940 10, 2011 Regulator sues Goldman Sachs over risky NMR 46.97% 87.13% 3.08% 0.24 29.64 16,626 mortgages - Aug 9, 2011 RJF 14.49% 12.00% 8.37% 1.01 12.28 2,980 Feds: Probe into WaMu ends with no charges - Aug 5, 2011 JEF 18.36% 15.00% - 0.71 - 2,797 Bank of America reports $8.8 billion loss - Jul MS 24.82% 10.00% 9.93% 1.36 30.48 31,622 19, 2011 SCHW -0.34% 16.00% 15.78% 1.00 20.77 4,248 Company Details Company Profile GOLDMAN SACHS Goldman Sachs is a global investment banking and securities firm, providing a full range 200 WEST STREET of investing, advisory and financing services worldwide to a substantial and diversified NEW YORK, NY 10282 client base, which includes corporations, financial institutions, governments, and high net USA worth individuals. (Company Press Release) Phone: 2129021000 Fax: 212-902-3000 Website: http://http://www2.goldmansachs.co m Full Time Employees: 35,700 Sector: Finance Power Gauge Ratings are created using a relative ranking system that assigns a rank of 0 to 100 (100 being the highest) to each stock in the universe. Rank is calculated by evaluating each of the stocks factors and combining them into a single number using a weighting formula. A stock's rank ranges from 100-0, where 100 is the strongest, and a rank of 95 indicates the stock is better than 95% of the stocks in the universe. Chaikin Stock Research(CSR) is not registered as a securities broker dealer or investment advisor with either the U.S. Securities and Exchange Commission or with any state securities regulatory authority. CSR is not responsible for trades executed by users of this research report, our web site or mobile app based on the information included herein. The information presented in this report does not represent a recommendation to buy or sell stocks or any financial instrument nor is it intended as an endorsement of any security or investment. The information in this report is generic by nature and is not personalized to the specific financial situation of any individual. The user bears complete responsibility for their own investment research and should seek the advice of a qualified investment professional before making any investment decisions. Copyright (c) 1978-(Present) by ZACKS Investment Research, Inc ("ZACKS"). The information, data, analyses and opinions contained herein (1) includes the confidential and proprietary information of ZACKS, (2) may not be copied or redistributed, for any purpose, (3) does not constitute investment advice offered by ZACKS, (4) are provided solely for informational purposes, and (5) are not warranted or represented to be correct, complete, accurate or timely. ZACKS shall not be responsible for investment decisions, damages or other losses resulting from, or related to, use of this information, data, analyses or opinions. Past performance is no guarantee of future performance. ZACKS is not affiliated with Chaikin Power Tools. This report from Chaikin Power Tools is for informational purposes only and is not a recommendation to buy or sell securities. LM 2.3 DS 3.0 LS 2.1 Data Provided by ZACKS Investment Research, Inc., www.zacks.com Special offers to trade stocks from optionsXpress: www.chaikinpowertools.com