Stock Research Report for DELL as of 7/27/11 - Chaikin Power Tools
•
0 likes•145 views

To order a free Chaikin Power Gauge stock research report for DELL go to http://www.chaikinpowertools.com/reports

Recommended
More Related Content
Viewers also liked
More from Dan Oconnor
More from Dan Oconnor (10)
Recently uploaded
Recently uploaded (20)
Stock Research Report for DELL as of 7/27/11 - Chaikin Power Tools
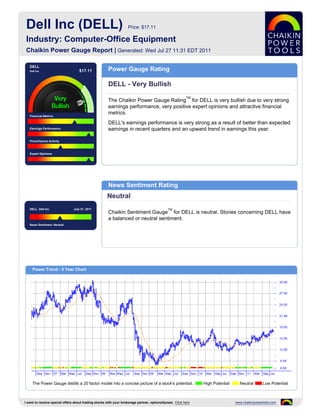
- 1. Dell Inc (DELL) Price: $17.11 Industry: Computer-Office Equipment Chaikin Power Gauge Report | Generated: Wed Jul 27 11:31 EDT 2011 DELL Dell Inc $17.11 Power Gauge Rating DELL - Very Bullish TM The Chaikin Power Gauge Rating for DELL is very bullish due to very strong earnings performance, very positive expert opinions and attractive financial metrics. Financial Metrics DELL's earnings performance is very strong as a result of better than expected Earnings Performance earnings in recent quarters and an upward trend in earnings this year. Price/Volume Activity Expert Opinions News Sentiment Rating Neutral DELL Dell Inc July 27, 2011 TM Chaikin Sentiment Gauge for DELL is neutral. Stories concerning DELL have a balanced or neutral sentiment. News Sentiment :Neutral Power Trend - 5 Year Chart The Power Gauge distills a 20 factor model into a concise picture of a stock's potential. High Potential Neutral Low Potential I want to receive special offers about trading stocks with your brokerage partner, optionsXpress. Click here www.chaikinpowertools.com
- 2. Financials & Earnings Financial Metrics Financial Metrics Rating LT Debt/Equity Ratio Bullish Price to Book Value DELL's financial metrics are very good. The company yields a high return on shareholder's equity and generates high free cash flow relative to market Return on Equity capitalization. The rank is based on a high long term debt to equity ratio, high price to book Price to Sales Ratio value ratio, high return on equity, low price to sales ratio and relatively high cash flow. Business Value Assets and Liabilities Valuation Returns Ratio TTM Ratio TTM Ratio TTM Current Ratio 1.56 Price/Book 4.25 Return on Invest 28.7% LT Debt/Equity 0.66 Price/Sales 0.52 Return on Equity 49.1% Earnings Performance Earnings Performance Rating Earnings Growth Very Bullish Earnings Surprise DELL's earnings performance has been very strong. The company has outperformed analysts' earnings estimates and experienced superior earnings growth in the past 12 months. Earnings Trend The rank is based on poor EPS growth over the past 3-5 years, better than Projected P/E Ratio expected earnings in recent quarters, an upward trend in earnings this year, a relatively low projected P/E ratio and consistent earnings over the past 5 years. Earnings Consistency 5 Year Revenue and Earnings Growth EPS Estimates 01/07 01/08 01/09 01/10 01/11 Factor Actual EPS Prev EST EPS Current Change Revenue(M) 57,420.00 61,133.00 61,101.00 52,902.00 61,494.00 Quarterly EPS $0.28 $0.48 +0.20 Rev % Growth 2.70% 6.47% -0.05% -13.42% 16.24% Yearly EPS $1.36 $1.90 +0.54 EPS $1.15 $1.33 $1.25 $0.73 $1.36 Factor Actual EPS Growth Est EPS Growth Change EPS % Growth -22.82% 15.65% -6.02% -41.60% 86.30% 3-5 year EPS 2.39% 7.50% +5.11 EPS Surprise EPS Quarterly Results Estimate Actual Difference % Difference FY Qtr 1 Qtr 2 Qtr 3 Qtr 4 Total Latest Qtr $0.43 $0.55 $0.12 27.91 01/09 $0.15 $0.24 $0.17 $0.17 $0.73 1 Qtr Ago $0.37 $0.53 $0.16 43.24 01/10 $0.22 $0.28 $0.42 $0.48 $1.40 2 Qtr Ago $0.32 $0.45 $0.13 40.63 01/11 $0.50 - - - - 3 Qtr Ago $0.30 $0.32 $0.02 6.67 Fiscal Year End Month is January. I want to receive special offers about trading stocks with your brokerage partner, optionsXpress. Click here www.chaikinpowertools.com
- 3. Price Trend & Expert Opinions Price/Volume Activity Price/Volume Activity Rating Relative Strength vs Market Neutral Chaikin Money Flow Price and volume activity for DELL is neutral. DELL has outperformed the S&P 500 over 26 weeks and is in a decelerating price trend compared to 4 months Price Trend ago. Price Trend ROC The rank for DELL is based on its price strength versus the market, positive Chaikin money flow, a positive Chaikin price trend, a negative Chaikin price trend ROC and a decreasing volume trend. Volume Trend Relative Strength vs S&P500 Index Chaikin Money Flow Chart shows whether DELL is performing better or worse than the market. Chaikin Money Flow analyzes supply and demand for a company's stock. Price Activity Price Activity Volume Activity Factor Value Factor Value Factor Value 52 Week High 17.52 % Change Price - 4 Weeks 7.44% Average Volume 20 Days 19,286,190 52 Week Low 11.58 % Change Price - 24 Weeks 23.22% Average Volume 90 Days 24,178,238 % Change YTD Rel S&P 500 17.59% % Change Price - 4 Wks Rel to S&P 2.32% Chaikin Money Flow Persistency 68% % Change Price - 24 Wks Rel to S&P 21.27% Expert Opinions Expert Opinions Earnings Estimate Revisions Very Bullish Short Interest Expert opinions about DELL are very positive. Analysts are raising their EPS estimates for DELL and insiders are net buyers of DELL's stock. Insider Activity The rank for DELL is based on analysts revising earnings estimates upward, insiders purchasing stock, optimistic analyst opinions and price strength of the Analyst Opinions stock versus the Computer-Office Equipment industry group. Relative Strength vs Industry Earnings Estimate Revisions Analyst Recommendations EPS Estimates Revision Summary Current 7 Days Ago % Change Factor Value Last Week Last 4 Weeks Current Qtr 0.48 0.48 0.00% Mean this Week Buy Up Down Up Down Next Qtr 0.44 0.44 0.00% Mean Last Week Buy Curr Qtr 0 0 5 0 Curr Yr 0 0 6 0 Current 30 Days Ago % Change Change 0.00 Next Qtr 0 0 5 0 Current FY 1.90 1.88 0.02 Mean 5 Weeks Ago Buy Next Yr 0 0 5 0 I want to receive special offers about trading stocks with your brokerage partner, optionsXpress. Click here www.chaikinpowertools.com
- 4. The Company & Its Competitors DELL's Competitors in Computer-Office Equipment News Headlines for DELL Company Power Historic EPS Projected EPS Profit Margin PEG PE Revenue(M) Dell Unveils Industry’s First OpenStack Gauge growth growth Infrastructure-as-a-Service Cloud Solution - Jul DELL 2.39% 7.50% 5.26% 1.20 9.25 61,494 26, 2011 AAPL 37.85% 19.24% 23.53% 0.78 15.97 65,225 Dell buys S.J. company, stepping up competition with HP, Cisco - Jul 21, 2011 New University Holdings Corp. Announces Conditional Acceptance of - Jul 20, 2011 Dell to buy networking equipment maker Force 10 - Jul 20, 2011 PC sales set to cross 1 cr - Jul 13, 2011 Company Details Company Profile DELL INC Dell Inc. is a premier provider of products and services required for customers worldwide ONE DELL WAY STED to build their information-technology and Internet infrastructures. Dell, through its direct ROUND ROCK, TX 78682 business model, designs, manufactures and customizes products and services to USA customer requirements, and offers an extensive selection of software and peripherals. Phone: 5127284737 Fax: 512-728-3653 Website: http://http://www.dell.com/ Full Time Employees: 103,300 Sector: Computer and Technology Power Gauge Ratings are created using a relative ranking system that assigns a rank of 0 to 100 (100 being the highest) to each stock in the universe. Rank is calculated by evaluating each of the stocks factors and combining them into a single number using a weighting formula. A stock's rank ranges from 100-0, where 100 is the strongest, and a rank of 95 indicates the stock is better than 95% of the stocks in the universe. Chaikin Stock Research(CSR) is not registered as a securities broker dealer or investment advisor with either the U.S. Securities and Exchange Commission or with any state securities regulatory authority. CSR is not responsible for trades executed by users of this research report, our web site or mobile app based on the information included herein. The information presented in this report does not represent a recommendation to buy or sell stocks or any financial instrument nor is it intended as an endorsement of any security or investment. The information in this report is generic by nature and is not personalized to the specific financial situation of any individual. The user bears complete responsibility for their own investment research and should seek the advice of a qualified investment professional before making any investment decisions. Copyright (c) 1978-(Present) by ZACKS Investment Research, Inc ("ZACKS"). The information, data, analyses and opinions contained herein (1) includes the confidential and proprietary information of ZACKS, (2) may not be copied or redistributed, for any purpose, (3) does not constitute investment advice offered by ZACKS, (4) are provided solely for informational purposes, and (5) are not warranted or represented to be correct, complete, accurate or timely. ZACKS shall not be responsible for investment decisions, damages or other losses resulting from, or related to, use of this information, data, analyses or opinions. Past performance is no guarantee of future performance. ZACKS is not affiliated with Chaikin Power Tools. This report from Chaikin Power Tools is for informational purposes only and is not a recommendation to buy or sell securities. LM 2.3 DS 3.0 LS 2.1 Data Provided by ZACKS Investment Research, Inc., www.zacks.com Special offers to trade stocks from optionsXpress: www.chaikinpowertools.com