Market Watch Toronto 2014 APRIL
•
1 like•236 views

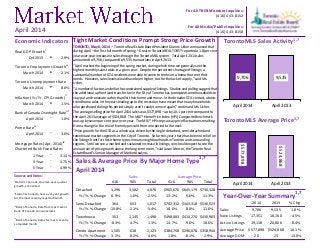
Tight Market Conditions Prompt Strong Price Growth TORONTO, May 6, 2014 – during April – the first full month of spring – Greater Toronto REALTORS® reported a 1.8 per cent year-over-year increase in sales through the TorontoMLS system. Total April 2014 sales amounted to 9,706, compared to 9,535 transactions in April 2013. “April marked the beginning of the spring market, during which time we generally see the highest monthly sales totals in a given year. Despite the persistent shortage of listings, a substantial number of GTA residents were able to come to terms on a home that met their needs. However, sales levels would have been higher, but for the lack of supply,” said Ms. Usher.

Recommended
More Related Content
More from Chaba Tamasi
More from Chaba Tamasi (15)
Recently uploaded
Recently uploaded (20)
Market Watch Toronto 2014 APRIL
- 1. Tight Market Conditions Prompt Strong Price Growth TORONTO, May 6, 2014 – Toronto Real Estate Board President Dianne Usher announced that during April – the first full month of spring – Greater Toronto REALTORS® reported a 1.8 per cent year-over-year increase in sales through the TorontoMLS system. Total April 2014 sales amounted to 9,706, compared to 9,535 transactions in April 2013. “April marked the beginning of the spring market, during which time we generally see the highest monthly sales totals in a given year. Despite the persistent shortage of listings, a substantial number of GTA residents were able to come to terms on a home that met their needs. However, sales levels would have been higher, but for the lack of supply,” said Ms. Usher. “A number of factors underlie the constrained supply of listings. Studies and polling suggest that the additional upfront land transfer tax in the City of Toronto has prompted some households to stay put and renovate rather than list their home and move. In the broader GTA context, above- trend home sales in the years leading up to the recession have meant that many households who purchased during this period simply aren’t ready to move again,” continued Ms. Usher. The average selling price for April 2014 sales was $577,898 – up by 10.1 per cent compared to the April 2013 average of $524,868. The MLS® Home Price Index (HPI) Composite Benchmark was up by seven per cent year-over-year. The MLS® HPI strips away price fluctuations resulting from a change in the mix of home types sold from one period to the next. “Price growth for the GTA as a whole was driven by the single-detached, semi-detached and townhouse market segments in the City of Toronto. So far this year, there has been no relief on the listings front for these home types in many neighbourhoods in Toronto and surrounding regions. Until we see a marked and sustained increase in listings, we should expect to see the annual rate of price growth above the long-term norm,” said Jason Mercer, the Toronto Real Estate Board’s Senior Manager of Market Analysis. 9,706 9,535 April 2014 April 2013 $577,898 $524,868 April 2014 April 2013 For All TREB Member Inquiries: (416) 443-8152 For All Media/Public Inquiries: (416) 443-8158April 2014 Real GDP Growthi Q4 2013 t 2.9% Toronto Employment Growthii March 2014 t 2.1% Toronto Unemployment Rate March 2014 u 8.0% Inflation (Yr./Yr. CPI Growth)ii March 2014 t 1.5% Bank of Canada Overnight Rateiii April 2014 q 1.0% Prime Rate iv April 2014 q 3.0% Mortgage Rates (Apr. 2014) iv Chartered Bank Fixed Rates 1 Year q 3.14% 3 Year q 3.75% 5 Year q 4.99% Sources and Notes: Economic Indicators i Statistics Canada, Quarter-over-quarter growth, annualized ii Statistics Canada, Year-over-year growth for the most recently reported month iii Bank of Canada, Rate from most recent Bank of Canada announcement iv Bank of Canada, Rates for most recently completed month Sales & Average Price By Major Home Type1,7 416 905 Total 416 905 Total Detached 1,296 3,582 4,878 $965,670 $645,179 $730,328 Yr./Yr. % Change 6.9% 1.0% 2.5% 13.2% 9.6% 11.3% Semi-Detached 364 653 1,017 $702,332 $443,318 $536,023 Yr./Yr. % Change -10.8% -2.1% -5.4% 18.0% 8.0% 11.6% Townhouse 353 1,145 1,498 $498,083 $410,270 $430,963 Yr./Yr. % Change -8.3% 4.7% 1.3% 14.7% 9.6% 10.6% Condo Apartment 1,505 618 2,123 $384,758 $296,078 $358,944 Yr./Yr. % Change 3.2% 8.2% 4.6% 1.8% 8.1% 2.9% April 2014 Sales Average Price 2014 2013 % Chg. Sales 9,706 9,535 1.8% New Listings 17,351 18,160 -4.5% Active Listings 19,118 20,866 -8.4% Average Price $577,898 $524,868 10.1% Average DOM 20 23 -13.0% Year-Over-Year Summary 1,7 TorontoMLS Sales Activity1,7 TorontoMLS Average Price1,7
- 2. Price Range Detached Semi-Detached Att/Row/Twnhouse Condo Townhouse Condo Apt Link Co-op Apt Det Condo Co-ownership Apt Total $0 to $99,999 3 0 0 3 6 0 0 0 0 12 $100,000 to $199,999 22 1 1 32 201 0 3 0 1 261 $200,000 to $299,999 171 45 62 169 681 21 1 1 1 1,152 $300,000 to $399,999 503 187 221 251 637 32 3 1 2 1,837 $400,000 to $499,999 778 323 240 142 296 29 2 0 0 1,810 $500,000 to $599,999 858 232 154 45 143 41 1 2 0 1,476 $600,000 to $699,999 673 89 66 19 79 33 1 0 0 960 $700,000 to $799,999 530 50 31 20 33 7 0 0 0 671 $800,000 to $899,999 359 23 11 5 9 5 0 0 0 412 $900,000 to $999,999 239 29 7 5 7 0 0 0 0 287 $1,000,000 to $1,249,999 313 13 5 3 14 1 1 1 0 351 $1,250,000 to $1,499,999 164 14 3 0 11 0 0 0 0 192 $1,500,000 to $1,749,999 97 4 2 1 3 0 0 0 0 107 $1,750,000 to $1,999,999 42 1 0 0 0 0 0 0 0 43 $2,000,000 + 126 6 0 0 3 0 0 0 0 135 Total Sales 4,878 1,017 803 695 2,123 169 12 5 4 9,706 Share of Total Sales 50.3% 10.5% 8.3% 7.2% 21.9% 1.7% 0.1% 0.1% 0.0% - Average Price $730,328 $536,023 $473,001 $382,393 $358,944 $501,457 $420,067 $576,200 $277,925 $577,898 Price Range Detached Semi-Detached Att/Row/Twnhouse Condo Townhouse Condo Apt Link Co-op Apt Det Condo Co-ownership Apt Total $0 to $99,999 6 0 1 10 37 0 0 0 2 56 $100,000 to $199,999 101 6 4 115 691 0 9 0 5 931 $200,000 to $299,999 533 154 168 524 2,153 58 6 5 14 3,615 $300,000 to $399,999 1,423 625 642 695 1,974 83 4 5 5 5,456 $400,000 to $499,999 2,206 881 681 399 891 83 7 4 0 5,152 $500,000 to $599,999 2,276 596 424 112 390 102 2 4 1 3,907 $600,000 to $699,999 1,889 272 184 52 209 76 4 3 0 2,689 $700,000 to $799,999 1,366 125 86 46 87 15 0 2 0 1,727 $800,000 to $899,999 993 88 37 12 31 8 1 0 0 1,170 $900,000 to $999,999 638 52 15 9 25 0 2 0 0 741 $1,000,000 to $1,249,999 809 32 20 8 33 1 1 1 0 905 $1,250,000 to $1,499,999 416 24 8 3 24 0 0 0 0 475 $1,500,000 to $1,749,999 251 11 3 3 12 0 0 0 0 280 $1,750,000 to $1,999,999 134 3 1 1 7 0 0 0 0 146 $2,000,000 + 306 10 0 1 11 0 0 0 0 328 Total Sales 13,347 2,879 2,274 1,990 6,575 426 36 24 27 27,578 Share of Total Sales 48.4% 10.4% 8.2% 7.2% 23.8% 1.5% 0.1% 0.1% 0.1% - Average Price $715,726 $516,395 $471,971 $373,920 $353,716 $484,467 $412,199 $475,583 $246,856 $559,208 SALES BY PRICE RANGE AND HOUSE TYPE1,7 APRIL 2014 SALES BY PRICE RANGE AND HOUSE TYPE1,7 YEAR-TO-DATE, 2014 Market Watch, April 2014 2 Toronto Real Estate Board
- 3. ALL HOME TYPES, APRIL 2014 ALL TREB AREAS Number of Sales Dollar Volume 1 Average Price 1 Median Price 1 New Listings 2 SNLR (Trend) 8 Active Listings 3 Mos. Inv. (Trend)9 Avg. SP/LP 4 Avg. DOM 5 TREB Total 9,706 $5,609,073,863 $577,898 $485,000 17,351 57.1% 19,118 2.4 100% 20 Halton Region 881 $563,251,411 $639,332 $550,000 1,427 63.1% 1,588 2.3 98% 20 Burlington 161 $93,589,047 $581,298 $490,000 270 64.2% 319 2.5 98% 24 Halton Hills 112 $59,217,128 $528,724 $520,000 165 63.0% 203 2.6 99% 21 Milton 263 $129,033,376 $490,621 $464,000 406 65.5% 353 1.7 99% 16 Oakville 345 $281,411,860 $815,687 $722,000 586 60.9% 713 2.5 98% 22 Peel Region 2,086 $1,025,629,497 $491,673 $450,000 3,714 54.4% 3,973 2.5 98% 19 Brampton 891 $393,001,755 $441,079 $425,000 1,535 54.1% 1,526 2.4 98% 19 Caledon 101 $60,680,650 $600,799 $562,000 190 50.4% 290 4.0 98% 34 Mississauga 1,094 $571,947,092 $522,804 $471,768 1,989 55.1% 2,157 2.4 99% 18 City of Toronto 3,544 $2,274,062,972 $641,666 $500,000 6,686 54.8% 7,674 2.5 101% 20 York Region 1,778 $1,197,674,835 $673,608 $624,100 3,294 57.1% 3,449 2.4 99% 19 Aurora 110 $68,030,253 $618,457 $561,650 161 63.0% 160 2.4 100% 17 E. Gwillimbury 40 $21,997,650 $549,941 $465,750 52 65.9% 62 3.1 97% 31 Georgina 69 $24,839,100 $359,987 $360,000 144 64.0% 198 2.6 97% 24 King 31 $26,848,700 $866,087 $838,800 81 41.7% 168 6.5 97% 40 Markham 524 $358,169,051 $683,529 $640,250 881 59.5% 790 2.0 101% 16 Newmarket 163 $88,874,418 $545,242 $508,500 245 71.1% 202 1.5 99% 17 Richmond Hill 353 $273,590,536 $775,044 $700,000 730 52.8% 752 2.5 100% 17 Vaughan 394 $273,524,768 $694,225 $660,450 836 53.2% 919 2.6 99% 18 Whitchurch-Stouffville 94 $61,800,359 $657,451 $575,000 164 55.3% 198 3.2 97% 36 Durham Region 1,130 $442,226,790 $391,351 $368,000 1,709 66.4% 1,592 1.7 99% 17 Ajax 211 $88,852,700 $421,103 $400,000 333 68.6% 235 1.3 99% 15 Brock 13 $6,217,900 $478,300 $320,000 34 53.9% 85 5.8 97% 32 Clarington 198 $66,134,572 $334,013 $316,750 272 67.6% 249 1.7 99% 17 Oshawa 265 $80,392,488 $303,368 $283,500 439 68.3% 383 1.4 99% 14 Pickering 141 $68,578,524 $486,373 $440,000 215 64.3% 178 1.7 99% 17 Scugog 34 $15,725,900 $462,526 $428,500 48 57.1% 93 3.8 97% 45 Uxbridge 27 $14,627,100 $541,744 $494,000 44 58.6% 103 4.6 97% 36 Whitby 241 $101,697,606 $421,982 $400,000 324 67.4% 266 1.4 100% 14 Dufferin County 61 $21,147,350 $346,678 $350,000 99 67.8% 145 2.6 98% 39 Orangeville 61 $21,147,350 $346,678 $350,000 99 67.8% 145 2.6 98% 39 Simcoe County 226 $85,081,008 $376,465 $361,250 422 62.0% 697 3.4 98% 36 Adjala-Tosorontio 16 $6,419,950 $401,247 $379,000 37 55.4% 72 5.4 98% 69 Bradford West Gwillimbury 62 $28,282,394 $456,168 $443,722 137 59.4% 172 2.7 98% 19 Essa 34 $10,732,800 $315,671 $289,250 59 67.8% 88 3.1 99% 36 Innisfil 55 $19,588,264 $356,150 $340,000 100 58.1% 175 4.0 97% 37 New Tecumseth 59 $20,057,600 $339,959 $334,000 89 68.0% 190 3.2 98% 44 SUMMARY OF EXISTING HOME TRANSACTIONS ! TURN PAGE FOR CITY OF TORONTO TABLES OR CLICK HERE: Market Watch, April 2014 3 Toronto Real Estate Board
- 4. Market Watch, April 2014 July 2010Page 3 4 Toronto Real Estate Board ALL HOME TYPES, APRIL 2014 CITY OF TORONTO MUNICIPAL BREAKDOWN Number of Sales Dollar Volume 1 Average Price 1 Median Price 1 New Listings 2 SNLR (Trend) 8 Active Listings 3 Mos. Inv. (Trend)9 Avg. SP/LP 4 Avg. DOM 5 TREB Total 9,706 $5,609,073,863 $577,898 $485,000 17,351 57.1% 19,118 2.4 100% 20 City of Toronto Total 3,544 $2,274,062,972 $641,666 $500,000 6,686 54.8% 7,674 2.5 101% 20 Toronto West 845 $471,653,689 $558,170 $487,000 1,629 56.9% 1,961 2.5 101% 21 Toronto W01 57 $40,759,055 $715,071 $707,118 100 54.4% 119 2.5 104% 17 Toronto W02 91 $65,920,327 $724,399 $651,000 144 67.8% 110 1.3 105% 15 Toronto W03 63 $31,346,542 $497,564 $492,000 120 65.3% 104 1.5 104% 13 Toronto W04 73 $33,964,000 $465,260 $470,000 138 63.4% 142 2.1 101% 20 Toronto W05 109 $48,260,600 $442,758 $449,000 205 56.6% 257 2.9 99% 25 Toronto W06 108 $51,474,978 $476,620 $433,900 298 47.1% 442 3.8 102% 25 Toronto W07 38 $33,710,745 $887,125 $870,050 54 70.9% 36 1.3 103% 11 Toronto W08 173 $115,092,352 $665,274 $558,000 347 53.6% 455 2.7 100% 24 Toronto W09 46 $20,815,888 $452,519 $422,750 88 57.7% 111 2.5 100% 20 Toronto W10 87 $30,309,202 $348,382 $392,900 135 57.5% 185 2.7 98% 27 Toronto Central 1,644 $1,262,013,036 $767,648 $512,000 3,411 49.1% 4,379 3.1 100% 23 Toronto C01 402 $194,732,994 $484,410 $411,000 1,016 43.0% 1,516 3.9 100% 27 Toronto C02 89 $97,348,976 $1,093,809 $900,000 164 48.0% 247 3.8 103% 17 Toronto C03 53 $65,925,268 $1,243,873 $1,015,500 90 58.8% 105 2.4 99% 22 Toronto C04 125 $168,184,199 $1,345,474 $1,225,000 207 52.6% 225 2.6 101% 20 Toronto C06 43 $24,368,536 $566,710 $480,000 69 46.8% 95 3.4 100% 27 Toronto C07 127 $91,282,585 $718,761 $695,000 272 48.4% 323 3.1 99% 20 Toronto C08 160 $75,791,523 $473,697 $415,000 334 53.3% 403 2.7 98% 23 Toronto C09 52 $88,283,153 $1,697,753 $1,445,500 86 55.9% 86 2.7 99% 21 Toronto C10 71 $55,201,211 $777,482 $697,000 120 60.5% 100 2.0 102% 15 Toronto C11 59 $38,524,314 $652,954 $355,000 91 66.6% 74 1.6 102% 24 Toronto C12 46 $102,804,525 $2,234,881 $2,272,500 113 43.6% 153 4.5 96% 26 Toronto C13 90 $56,473,768 $627,486 $522,500 141 62.5% 133 1.8 103% 16 Toronto C14 175 $119,749,536 $684,283 $455,000 423 43.9% 581 3.6 98% 25 Toronto C15 152 $83,342,448 $548,306 $431,900 285 54.1% 338 2.6 100% 22 Toronto East 1,055 $540,396,247 $512,224 $500,000 1,646 64.2% 1,334 1.7 104% 15 Toronto E01 94 $62,967,742 $669,870 $635,000 161 64.4% 114 1.4 108% 10 Toronto E02 87 $73,280,631 $842,306 $725,061 139 63.2% 83 1.3 103% 11 Toronto E03 107 $70,559,451 $659,434 $615,800 181 65.1% 131 1.2 109% 9 Toronto E04 135 $56,244,338 $416,625 $440,000 209 66.1% 158 1.6 102% 16 Toronto E05 110 $53,429,503 $485,723 $423,450 150 71.3% 100 1.4 103% 15 Toronto E06 49 $26,726,375 $545,436 $481,075 88 57.5% 61 1.6 102% 11 Toronto E07 111 $49,520,978 $446,135 $400,500 168 62.9% 155 1.9 104% 16 Toronto E08 65 $28,913,338 $444,821 $480,000 112 60.8% 113 2.1 102% 11 Toronto E09 127 $48,263,413 $380,027 $375,800 202 61.8% 197 2.0 102% 21 Toronto E10 78 $39,016,200 $500,208 $499,950 105 62.1% 100 2.1 102% 13 Toronto E11 92 $31,474,278 $342,112 $355,000 131 67.6% 122 1.8 100% 22 SUMMARY OF EXISTING HOME TRANSACTIONS
- 5. ALL HOME TYPES, YEAR-TO-DATE 2014 ALL TREB AREAS Number of Sales Dollar Volume 1 Average Price 1 Median Price 1 New Listings 2 Avg. SP/LP 4 Avg. DOM 5 TREB Total 27,578 $15,421,839,481 $559,208 $469,900 51,665 99% 24 Halton Region 2,402 $1,511,217,843 $629,150 $535,000 4,186 98% 24 Burlington 439 $249,222,730 $567,706 $490,100 735 98% 30 Halton Hills 317 $158,605,173 $500,332 $463,000 530 98% 24 Milton 677 $336,020,265 $496,337 $462,000 1,157 99% 20 Oakville 969 $767,369,675 $791,919 $685,000 1,764 98% 24 Peel Region 5,847 $2,772,727,477 $474,214 $433,500 11,016 98% 24 Brampton 2,497 $1,071,499,579 $429,115 $410,000 4,564 98% 24 Caledon 267 $156,819,490 $587,339 $537,500 545 97% 38 Mississauga 3,083 $1,544,408,408 $500,943 $455,000 5,907 98% 22 City of Toronto 10,184 $6,174,135,822 $606,258 $475,000 20,232 101% 24 York Region 5,143 $3,424,145,436 $665,788 $610,000 9,498 99% 23 Aurora 296 $183,591,984 $620,243 $565,000 477 99% 20 E. Gwillimbury 120 $68,493,640 $570,780 $488,495 167 97% 46 Georgina 240 $82,835,312 $345,147 $343,850 425 98% 30 King 92 $81,512,300 $886,003 $796,500 255 96% 44 Markham 1,445 $983,933,409 $680,923 $630,000 2,513 100% 20 Newmarket 451 $237,096,908 $525,714 $503,000 688 99% 22 Richmond Hill 1,074 $818,191,884 $761,817 $700,000 2,103 100% 20 Vaughan 1,184 $816,885,653 $689,937 $642,000 2,405 98% 22 Whitchurch-Stouffville 241 $151,604,347 $629,064 $562,000 465 97% 30 Durham Region 3,186 $1,226,546,132 $384,980 $358,900 5,179 99% 20 Ajax 581 $239,103,032 $411,537 $390,000 914 100% 17 Brock 55 $17,060,463 $310,190 $253,000 112 96% 67 Clarington 534 $176,135,831 $329,842 $311,995 856 99% 21 Oshawa 759 $230,284,320 $303,405 $280,000 1,290 99% 18 Pickering 401 $183,799,654 $458,353 $426,000 635 99% 19 Scugog 89 $36,407,614 $409,074 $388,000 167 97% 48 Uxbridge 102 $54,679,950 $536,078 $487,500 169 96% 41 Whitby 665 $289,075,268 $434,700 $397,500 1,036 99% 16 Dufferin County 171 $60,921,250 $356,265 $336,500 294 98% 37 Orangeville 171 $60,921,250 $356,265 $336,500 294 98% 37 Simcoe County 645 $252,145,521 $390,923 $363,000 1,260 98% 43 Adjala-Tosorontio 41 $18,876,850 $460,411 $390,000 88 97% 73 Bradford West Gwillimbury 181 $82,577,494 $456,229 $443,000 372 98% 27 Essa 96 $31,841,105 $331,678 $295,500 174 98% 41 Innisfil 149 $55,854,352 $374,861 $345,000 311 98% 46 New Tecumseth 178 $62,995,720 $353,909 $327,500 315 97% 50 ! TURN PAGE FOR CITY OF TORONTO TABLES OR CLICK HERE: SUMMARY OF EXISTING HOME TRANSACTIONS Market Watch, April 2014 July 2010Page 3 5 Toronto Real Estate Board
- 6. Market Watch, April 2014 July 2010Page 3 6 Toronto Real Estate Board ALL HOME TYPES, YEAR-TO-DATE 2014 CITY OF TORONTO MUNICIPAL BREAKDOWN Number of Sales Dollar Volume 1 Average Price 1 Median Price 1 New Listings 2 Avg. SP/LP 4 Avg. DOM 5 TREB Total 27,578 $15,421,839,481 $559,208 $469,900 51,665 99% 24 City of Toronto Total 10,184 $6,174,135,822 $606,258 $475,000 20,232 101% 24 Toronto West 2,469 $1,282,536,155 $519,456 $458,000 4,893 101% 26 Toronto W01 177 $106,204,613 $600,026 $475,000 323 102% 26 Toronto W02 232 $158,772,140 $684,363 $648,500 374 105% 18 Toronto W03 188 $88,946,567 $473,120 $481,000 345 103% 16 Toronto W04 216 $93,876,012 $434,611 $432,500 394 100% 25 Toronto W05 331 $131,158,887 $396,250 $418,000 607 98% 31 Toronto W06 313 $144,341,671 $461,155 $422,990 865 100% 33 Toronto W07 88 $73,175,398 $831,539 $818,750 130 102% 16 Toronto W08 512 $326,992,769 $638,658 $527,350 1,099 99% 27 Toronto W09 137 $67,282,808 $491,115 $540,000 272 99% 25 Toronto W10 275 $91,785,291 $333,765 $380,000 484 98% 31 Toronto Central 4,759 $3,441,689,569 $723,196 $483,000 10,613 100% 27 Toronto C01 1,226 $601,523,828 $490,639 $408,500 3,328 99% 30 Toronto C02 218 $236,375,151 $1,084,290 $866,500 493 102% 23 Toronto C03 167 $198,881,274 $1,190,906 $818,000 305 99% 26 Toronto C04 332 $417,299,390 $1,256,926 $1,164,250 653 101% 21 Toronto C06 115 $66,526,740 $578,493 $480,000 237 100% 27 Toronto C07 372 $241,845,529 $650,122 $464,000 807 99% 26 Toronto C08 471 $221,518,280 $470,315 $410,000 983 98% 28 Toronto C09 113 $180,055,290 $1,593,410 $1,438,000 224 99% 25 Toronto C10 186 $137,680,719 $740,219 $672,500 323 102% 19 Toronto C11 182 $122,884,946 $675,192 $350,000 290 102% 23 Toronto C12 131 $246,654,490 $1,882,859 $1,620,000 329 96% 32 Toronto C13 244 $158,013,074 $647,595 $488,000 412 102% 20 Toronto C14 546 $357,695,155 $655,119 $448,500 1,339 98% 29 Toronto C15 456 $254,735,703 $558,631 $436,000 890 100% 25 Toronto East 2,956 $1,449,910,098 $490,497 $479,000 4,726 103% 18 Toronto E01 279 $180,540,433 $647,098 $632,000 454 107% 14 Toronto E02 233 $180,303,011 $773,833 $680,000 376 103% 13 Toronto E03 298 $187,731,841 $629,973 $600,000 490 106% 13 Toronto E04 368 $154,644,726 $420,230 $449,050 568 102% 18 Toronto E05 301 $137,050,212 $455,316 $369,500 448 102% 18 Toronto E06 145 $79,104,938 $545,551 $492,000 243 101% 13 Toronto E07 269 $111,594,720 $414,850 $364,100 468 103% 21 Toronto E08 183 $77,732,179 $424,766 $444,000 309 100% 21 Toronto E09 390 $141,465,031 $362,731 $340,000 630 100% 23 Toronto E10 211 $99,331,938 $470,767 $470,000 324 101% 21 Toronto E11 279 $100,411,069 $359,896 $358,000 416 100% 22 SUMMARY OF EXISTING HOME TRANSACTIONS
- 7. Market Watch, April 2014 Industrial Leasing July 2010Page 3 7 Toronto Real Estate Board ALL TREB AREAS Sales 1 Dollar Volume 1 Average Price 1 Median Price 1 New Listings 2 Active Listings 3 Avg. SP/LP 4 Avg. DOM 5 TREB Total 4,878 $3,562,538,619 $730,328 $615,000 8,707 9,112 100% 19- - - - - - - - Halton Region 543 $422,828,226 $778,689 $674,900 940 1,092 98% 22 Burlington 97 $69,726,388 $718,829 $628,000 159 199 98% 28 Halton Hills 89 $51,182,175 $575,081 $560,000 142 190 98% 23 Milton 122 $73,133,777 $599,457 $574,750 224 222 98% 18 Oakville 235 $228,785,886 $973,557 $815,000 415 481 98% 22- - - - - - - - Peel Region 1,002 $625,353,814 $624,106 $570,500 1,854 2,000 98% 20 Brampton 505 $258,607,497 $512,094 $487,000 937 978 98% 20 Caledon 83 $53,308,650 $642,273 $599,000 163 262 98% 38 Mississauga 414 $313,437,667 $757,096 $665,000 754 760 98% 15- - - - - - - - City of Toronto 1,296 $1,251,508,806 $965,670 $740,000 2,215 1,903 101% 14 - - - - - - - - York Region 1,027 $834,269,625 $812,337 $760,000 2,009 2,120 99% 18 Aurora 65 $47,108,353 $724,744 $659,000 111 114 100% 18 E. Gwillimbury 32 $19,469,350 $608,417 $520,000 43 58 97% 35 Georgina 65 $23,605,200 $363,157 $365,000 134 184 97% 25 King 22 $21,012,300 $955,105 $930,000 68 153 96% 36 Markham 245 $219,018,003 $893,951 $808,000 426 338 101% 13 Newmarket 104 $65,046,618 $625,448 $580,000 164 149 99% 17 Richmond Hill 203 $200,808,247 $989,203 $880,000 441 415 100% 14 Vaughan 223 $187,919,455 $842,688 $778,800 482 526 99% 16 Whitchurch-Stouffville 68 $50,282,099 $739,443 $629,500 140 183 96% 38- - - - - - - - Durham Region 798 $344,739,540 $432,004 $413,000 1,267 1,278 99% 18 Ajax 139 $64,653,200 $465,131 $460,000 228 170 99% 15 Brock 13 $6,217,900 $478,300 $320,000 32 82 97% 32 Clarington 140 $50,583,638 $361,312 $352,750 201 212 99% 19 Oshawa 192 $64,507,938 $335,979 $329,550 343 298 99% 15 Pickering 88 $50,577,774 $574,747 $512,500 140 127 98% 18 Scugog 34 $15,725,900 $462,526 $428,500 47 89 97% 45 Uxbridge 23 $13,184,900 $573,257 $547,000 39 93 96% 41 Whitby 169 $79,288,290 $469,161 $460,000 237 207 100% 15- - - - - - - - Dufferin County 44 $16,615,450 $377,624 $356,500 81 124 98% 36 Orangeville 44 $16,615,450 $377,624 $356,500 81 124 98% 36- - - - - - - - Simcoe County 168 $67,223,158 $400,138 $390,000 341 595 98% 37 Adjala-Tosorontio 16 $6,419,950 $401,247 $379,000 37 72 98% 69 Bradford West Gwillimbury 44 $21,629,744 $491,585 $495,500 110 146 98% 18 Essa 19 $6,745,000 $355,000 $350,000 42 74 99% 48 Innisfil 49 $17,980,264 $366,944 $363,000 94 172 97% 39 New Tecumseth 40 $14,448,200 $361,205 $343,750 58 131 98% 36 SUMMARY OF EXISTING HOME TRANSACTIONS DETACHED HOUSES, APRIL 2014 ! TURN PAGE FOR CITY OF TORONTO TABLES OR CLICK HERE:
- 8. Market Watch, April 2014 Industrial Leasing July 2010Page 3 8 Toronto Real Estate Board CITY OF TORONTO MUNICIPAL BREAKDOWN Sales1 Dollar Volume1 Average Price1 Median Price1 New Listings2 Active Listings3 Avg. SP/LP4 Avg. DOM5 TREB Total 4,878 $3,562,538,619 $730,328 $615,000 8,707 9,112 100% 19 City of Toronto Total 1,296 $1,251,508,806 $965,670 $740,000 2,215 1,903 101% 14 Toronto West 379 $289,252,790 $763,200 $650,000 642 581 102% 16 Toronto W01 17 $18,656,181 $1,097,422 $961,000 21 19 106% 11 Toronto W02 37 $37,614,600 $1,016,611 $1,008,000 55 36 105% 12 Toronto W03 33 $17,686,133 $535,943 $502,000 75 60 104% 13 Toronto W04 44 $25,890,400 $588,418 $542,500 72 53 102% 18 Toronto W05 35 $21,293,000 $608,371 $565,000 56 64 98% 26 Toronto W06 35 $21,331,637 $609,475 $605,000 62 43 107% 9 Toronto W07 34 $32,355,745 $951,640 $886,000 50 31 104% 9 Toronto W08 82 $81,784,605 $997,373 $887,500 147 166 100% 22 Toronto W09 23 $13,931,088 $605,699 $629,000 42 44 101% 11 Toronto W10 39 $18,709,401 $479,728 $455,000 62 65 99% 21 Toronto Central 429 $646,409,270 $1,506,782 $1,239,000 803 837 100% 17 Toronto C01 3 $2,448,000 $816,000 $803,000 22 16 103% 8 Toronto C02 19 $32,812,000 $1,726,947 $1,800,000 26 28 101% 14 Toronto C03 33 $51,379,818 $1,556,964 $1,320,000 55 65 99% 23 Toronto C04 94 $150,030,799 $1,596,072 $1,450,000 173 184 101% 18 Toronto C06 16 $13,579,686 $848,730 $779,093 29 36 101% 18 Toronto C07 58 $62,856,175 $1,083,727 $961,500 112 115 99% 14 Toronto C08 2 $2,675,000 $1,337,500 $1,337,500 2 2 95% 9 Toronto C09 26 $65,917,000 $2,535,269 $2,205,000 45 47 99% 19 Toronto C10 12 $15,866,600 $1,322,217 $1,305,500 30 23 102% 12 Toronto C11 18 $24,000,201 $1,333,345 $1,251,944 28 20 103% 20 Toronto C12 38 $95,447,525 $2,511,777 $2,480,000 84 104 96% 24 Toronto C13 33 $34,013,968 $1,030,726 $912,500 56 46 104% 12 Toronto C14 44 $62,742,400 $1,425,964 $1,275,000 85 102 99% 19 Toronto C15 33 $32,640,098 $989,094 $950,000 56 49 101% 12 Toronto East 488 $315,846,746 $647,227 $580,273 770 485 104% 10 Toronto E01 26 $18,622,466 $716,249 $655,500 32 20 105% 15 Toronto E02 35 $39,516,553 $1,129,044 $1,000,000 61 32 101% 10 Toronto E03 69 $49,907,045 $723,291 $650,000 122 88 108% 8 Toronto E04 62 $32,982,309 $531,973 $526,500 106 57 104% 10 Toronto E05 40 $29,243,995 $731,100 $749,000 54 23 104% 10 Toronto E06 41 $23,851,075 $581,734 $525,000 77 51 102% 10 Toronto E07 39 $26,099,002 $669,205 $641,000 53 24 106% 11 Toronto E08 38 $21,311,288 $560,823 $528,500 64 56 103% 9 Toronto E09 56 $29,029,713 $518,388 $519,500 90 52 104% 12 Toronto E10 55 $31,727,600 $576,865 $569,000 69 59 103% 9 Toronto E11 27 $13,555,700 $502,063 $480,500 42 23 101% 13 DETACHED HOUSES, APRIL 2014 SUMMARY OF EXISTING HOME TRANSACTIONS
- 9. Industrial Leasing Toronto Real Estate Board ALL TREB AREAS Sales 1 Dollar Volume 1 Average Price 1 Median Price 1 New Listings 2 Active Listings 3 Avg. SP/LP 4 Avg. DOM 5 TREB Total 1,017 $545,135,357 $536,023 $475,000 1,467 936 103% 12- - - - - - - - Halton Region 57 $25,482,100 $447,054 $445,100 76 56 100% 12 Burlington 9 $3,815,750 $423,972 $426,000 9 6 100% 9 Halton Hills 3 $1,095,000 $365,000 $433,000 1 2 100% 8 Milton 37 $16,735,850 $452,320 $448,000 49 30 100% 12 Oakville 8 $3,835,500 $479,438 $462,500 17 18 98% 11- - - - - - - - Peel Region 363 $160,474,390 $442,078 $435,000 540 370 100% 13 Brampton 176 $69,209,105 $393,234 $386,550 253 196 99% 14 Caledon 9 $3,807,000 $423,000 $424,000 9 5 100% 10 Mississauga 178 $87,458,285 $491,339 $489,450 278 169 100% 11- - - - - - - - City of Toronto 364 $255,648,721 $702,332 $619,000 530 316 107% 10 - - - - - - - - York Region 143 $75,077,846 $525,020 $531,000 202 115 101% 12 Aurora 12 $5,670,200 $472,517 $460,500 14 5 101% 10 E. Gwillimbury - - - - - 1 - - Georgina - - - - 1 - - - King 1 $600,000 $600,000 $600,000 - - 100% 4 Markham 40 $21,759,279 $543,982 $539,000 48 26 102% 10 Newmarket 22 $8,960,900 $407,314 $419,000 29 20 100% 11 Richmond Hill 18 $9,992,608 $555,145 $559,400 29 19 101% 19 Vaughan 41 $23,954,799 $584,263 $585,800 69 38 100% 10 Whitchurch-Stouffville 9 $4,140,060 $460,007 $456,800 12 6 100% 18- - - - - - - - Durham Region 72 $22,729,100 $315,682 $326,500 99 61 100% 13 Ajax 18 $6,800,900 $377,828 $368,000 27 17 100% 14 Brock - - - - - - - - Clarington 4 $918,500 $229,625 $232,750 5 2 100% 12 Oshawa 25 $5,764,900 $230,596 $228,000 43 30 101% 13 Pickering 14 $5,737,500 $409,821 $407,500 11 5 101% 13 Scugog - - - - 1 1 - - Uxbridge - - - - - - - - Whitby 11 $3,507,300 $318,845 $319,500 12 6 100% 11- - - - - - - - Dufferin County 6 $1,602,400 $267,067 $268,250 6 6 98% 56 Orangeville 6 $1,602,400 $267,067 $268,250 6 6 98% 56- - - - - - - - Simcoe County 12 $4,120,800 $343,400 $352,450 14 12 99% 23 Adjala-Tosorontio - - - - - - - - Bradford West Gwillimbury 9 $3,360,900 $373,433 $382,000 11 6 99% 18 Essa 1 $309,900 $309,900 $309,900 1 2 100% 42 Innisfil - - - - - - - - New Tecumseth 2 $450,000 $225,000 $225,000 2 4 97% 34 ! TURN PAGE FOR CITY OF TORONTO TABLES OR CLICK HERE: SUMMARY OF EXISTING HOME TRANSACTIONS SEMI-DETACHED HOUSES, APRIL 2014 July 2010Page 3 Market Watch, April 2014 9
- 10. Industrial Leasing July 2010Page 3 Toronto Real Estate Board Market Watch, April 2014 CITY OF TORONTO MUNICIPAL BREAKDOWN Sales1 Dollar Volume1 Average Price1 Median Price1 New Listings2 Active Listings3 Avg. SP/LP4 Avg. DOM5 TREB Total 1,017 $545,135,357 $536,023 $475,000 1,467 936 103% 12 City of Toronto Total 364 $255,648,721 $702,332 $619,000 530 316 107% 10 Toronto West 98 $53,872,506 $549,719 $506,500 148 117 104% 12 Toronto W01 8 $6,750,000 $843,750 $852,000 8 6 109% 8 Toronto W02 22 $14,303,100 $650,141 $629,500 32 20 108% 11 Toronto W03 17 $8,990,106 $528,830 $514,000 33 24 105% 11 Toronto W04 2 $1,025,000 $512,500 $512,500 7 7 98% 7 Toronto W05 37 $16,971,800 $458,697 $442,000 52 49 100% 15 Toronto W06 3 $1,677,500 $559,167 $537,500 3 - 110% 7 Toronto W07 - - - - 1 1 - - Toronto W08 3 $1,716,000 $572,000 $593,000 4 3 100% 8 Toronto W09 1 $469,000 $469,000 $469,000 5 4 98% 12 Toronto W10 5 $1,970,000 $394,000 $382,000 3 3 98% 15 Toronto Central 116 $109,303,010 $942,267 $802,500 162 95 106% 9 Toronto C01 22 $21,721,687 $987,349 $901,400 32 16 106% 10 Toronto C02 27 $35,739,900 $1,323,700 $1,320,000 32 17 108% 8 Toronto C03 8 $5,596,000 $699,500 $525,000 10 8 101% 10 Toronto C04 5 $4,438,100 $887,620 $901,100 7 4 108% 7 Toronto C06 2 $1,075,000 $537,500 $537,500 - - 101% 8 Toronto C07 3 $1,881,000 $627,000 $610,000 6 6 101% 12 Toronto C08 5 $4,543,000 $908,600 $883,000 7 7 104% 14 Toronto C09 3 $4,671,000 $1,557,000 $1,420,000 4 6 106% 7 Toronto C10 12 $10,269,000 $855,750 $795,000 12 6 108% 8 Toronto C11 7 $5,570,823 $795,832 $820,000 10 3 105% 11 Toronto C12 - - - - 2 1 - - Toronto C13 8 $4,616,000 $577,000 $572,500 13 7 104% 14 Toronto C14 1 $770,000 $770,000 $770,000 2 1 103% 2 Toronto C15 13 $8,411,500 $647,038 $635,000 25 13 104% 6 Toronto East 150 $92,473,205 $616,488 $585,500 220 104 109% 9 Toronto E01 39 $28,627,888 $734,048 $720,100 74 36 111% 8 Toronto E02 35 $24,301,778 $694,337 $650,000 46 20 107% 9 Toronto E03 24 $15,245,405 $635,225 $662,500 34 18 112% 9 Toronto E04 10 $4,306,650 $430,665 $406,000 14 7 102% 12 Toronto E05 9 $4,947,208 $549,690 $540,000 12 6 107% 9 Toronto E06 2 $1,013,800 $506,900 $506,900 - - 106% 26 Toronto E07 7 $3,930,188 $561,455 $591,800 5 2 113% 8 Toronto E08 2 $819,500 $409,750 $409,750 5 2 104% 4 Toronto E09 6 $2,701,100 $450,183 $436,050 9 3 104% 11 Toronto E10 4 $1,525,000 $381,250 $392,000 7 4 104% 17 Toronto E11 12 $5,054,688 $421,224 $397,544 14 6 102% 12 SUMMARY OF EXISTING HOME TRANSACTIONS SEMI-DETACHED HOUSES, APRIL 2014 10
- 11. Industrial Leasing July 2010Page 3 Toronto Real Estate Board Market Watch, April 2014 ALL TREB AREAS Sales 1 Dollar Volume 1 Average Price 1 Median Price 1 New Listings 2 Active Listings 3 Avg. SP/LP 4 Avg. DOM 5 TREB Total 695 $265,762,838 $382,393 $360,000 1,149 1,129 100% 19- - - - - - - - Halton Region 57 $21,041,151 $369,143 $330,000 81 82 99% 24 Burlington 23 $8,489,801 $369,122 $344,200 34 26 100% 18 Halton Hills 5 $1,303,000 $260,600 $256,000 6 3 100% 19 Milton 10 $2,833,000 $283,300 $277,750 9 9 97% 33 Oakville 19 $8,415,350 $442,913 $422,000 32 44 98% 28- - - - - - - - Peel Region 245 $89,108,921 $363,710 $354,000 412 387 99% 17 Brampton 49 $13,978,550 $285,277 $283,000 100 110 98% 22 Caledon 1 $304,000 $304,000 $304,000 1 - 101% 10 Mississauga 195 $74,826,371 $383,725 $369,900 311 277 99% 16- - - - - - - - City of Toronto 235 $100,549,250 $427,869 $387,000 415 437 100% 20 - - - - - - - - York Region 83 $37,471,900 $451,469 $433,000 135 126 99% 19 Aurora 7 $3,785,500 $540,786 $430,000 6 11 98% 25 E. Gwillimbury - - - - - - - - Georgina 1 $240,000 $240,000 $240,000 - - 96% 42 King - - - - - 1 - - Markham 40 $17,869,700 $446,743 $434,000 62 55 100% 19 Newmarket 9 $3,124,600 $347,178 $344,000 18 10 99% 13 Richmond Hill 13 $6,011,600 $462,431 $445,000 25 26 100% 19 Vaughan 12 $6,180,500 $515,042 $481,500 23 22 98% 18 Whitchurch-Stouffville 1 $260,000 $260,000 $260,000 1 1 100% 34- - - - - - - - Durham Region 68 $15,999,116 $235,281 $236,250 98 86 100% 14 Ajax 14 $3,843,200 $274,514 $276,500 22 13 99% 16 Brock - - - - 2 3 - - Clarington 5 $1,324,600 $264,920 $251,500 4 5 102% 17 Oshawa 25 $4,792,350 $191,694 $187,000 31 31 100% 11 Pickering 14 $3,648,500 $260,607 $246,500 29 22 101% 18 Scugog - - - - - - - - Uxbridge 1 $409,000 $409,000 $409,000 2 6 100% 9 Whitby 9 $1,981,466 $220,163 $219,000 8 6 100% 12- - - - - - - - Dufferin County 4 $793,500 $198,375 $195,000 3 5 98% 28 Orangeville 4 $793,500 $198,375 $195,000 3 5 98% 28- - - - - - - - Simcoe County 3 $799,000 $266,333 $242,500 5 6 97% 80 Adjala-Tosorontio - - - - - - - - Bradford West Gwillimbury 1 $242,500 $242,500 $242,500 - - 98% 7 Essa - - - - - - - - Innisfil - - - - - - - - New Tecumseth 2 $556,500 $278,250 $278,250 5 6 97% 116 ! TURN PAGE FOR CITY OF TORONTO TABLES OR CLICK HERE: SUMMARY OF EXISTING HOME TRANSACTIONS CONDOMINIUM TOWNHOUSES, APRIL 2014 11
- 12. Industrial Leasing July 2010Page 3 Toronto Real Estate Board Market Watch, April 2014 12 CITY OF TORONTO MUNICIPAL BREAKDOWN Sales1 Dollar Volume1 Average Price1 Median Price1 New Listings2 Active Listings3 Avg. SP/LP4 Avg. DOM5 TREB Total 695 $265,762,838 $382,393 $360,000 1,149 1,129 100% 19 City of Toronto Total 235 $100,549,250 $427,869 $387,000 415 437 100% 20 Toronto West 54 $19,250,951 $356,499 $361,500 98 121 100% 23 Toronto W01 4 $1,928,050 $482,013 $464,025 7 4 103% 11 Toronto W02 9 $4,078,000 $453,111 $454,400 11 6 102% 8 Toronto W03 - - - - 2 6 - - Toronto W04 7 $2,367,500 $338,214 $342,000 10 12 99% 14 Toronto W05 13 $2,922,800 $224,831 $193,000 31 39 98% 30 Toronto W06 2 $1,000,100 $500,050 $500,050 7 11 103% 15 Toronto W07 - - - - - - - - Toronto W08 5 $2,199,500 $439,900 $469,000 18 20 100% 12 Toronto W09 6 $2,407,900 $401,317 $352,000 4 7 98% 47 Toronto W10 8 $2,347,101 $293,388 $288,551 8 16 97% 31 Toronto Central 98 $51,247,500 $522,934 $464,450 175 166 100% 19 Toronto C01 25 $12,778,400 $511,136 $482,000 39 42 101% 20 Toronto C02 3 $2,405,000 $801,667 $840,000 4 4 103% 14 Toronto C03 - - - - - 4 - - Toronto C04 1 $950,000 $950,000 $950,000 - - 106% 81 Toronto C06 1 $293,900 $293,900 $293,900 2 3 100% 120 Toronto C07 8 $3,829,000 $478,625 $426,500 11 9 100% 17 Toronto C08 7 $3,593,400 $513,343 $411,500 12 7 99% 16 Toronto C09 1 $779,150 $779,150 $779,150 2 1 100% 11 Toronto C10 5 $3,291,400 $658,280 $620,000 6 2 98% 13 Toronto C11 1 $150,000 $150,000 $150,000 2 1 94% 4 Toronto C12 2 $1,604,000 $802,000 $802,000 11 17 103% 13 Toronto C13 10 $4,417,100 $441,710 $400,000 8 1 102% 19 Toronto C14 9 $5,364,000 $596,000 $675,000 35 40 99% 26 Toronto C15 25 $11,792,150 $471,686 $451,000 43 35 100% 16 Toronto East 83 $30,050,799 $362,058 $358,000 142 150 100% 19 Toronto E01 5 $1,975,100 $395,020 $420,000 5 5 102% 14 Toronto E02 5 $3,268,000 $653,600 $658,000 6 5 102% 22 Toronto E03 1 $610,000 $610,000 $610,000 1 2 111% 4 Toronto E04 15 $5,983,399 $398,893 $395,000 20 16 101% 15 Toronto E05 19 $6,911,300 $363,753 $357,500 36 23 101% 12 Toronto E06 - - - - - - - - Toronto E07 8 $3,009,600 $376,200 $361,050 19 12 100% 10 Toronto E08 5 $1,543,000 $308,600 $295,000 5 10 98% 26 Toronto E09 5 $1,188,500 $237,700 $257,000 13 17 96% 24 Toronto E10 7 $1,914,900 $273,557 $270,000 11 22 97% 21 Toronto E11 13 $3,647,000 $280,538 $272,000 26 38 98% 36 SUMMARY OF EXISTING HOME TRANSACTIONS CONDOMINIUM TOWNHOUSES, APRIL 2014
- 13. Industrial Leasing July 2010Page 3 Toronto Real Estate Board Market Watch, April 2014 ALL TREB AREAS Sales 1 Dollar Volume 1 Average Price 1 Median Price 1 New Listings 2 Active Listings 3 Avg. SP/LP 4 Avg. DOM 5 TREB Total 2,123 $762,037,853 $358,944 $319,200 4,575 6,895 98% 29- - - - - - - - Halton Region 53 $16,165,008 $305,000 $272,500 115 201 98% 32 Burlington 12 $3,254,708 $271,226 $249,500 43 68 99% 27 Halton Hills 4 $1,101,900 $275,475 $271,000 4 2 98% 14 Milton 16 $4,598,900 $287,431 $284,000 21 29 99% 26 Oakville 21 $7,209,500 $343,310 $306,000 47 102 98% 42- - - - - - - - Peel Region 318 $84,894,243 $266,963 $250,000 629 1,004 97% 30 Brampton 62 $13,776,850 $222,207 $219,050 73 107 98% 25 Caledon 1 $540,000 $540,000 $540,000 1 4 98% 71 Mississauga 255 $70,577,393 $276,774 $260,000 555 893 97% 30- - - - - - - - City of Toronto 1,505 $579,061,497 $384,758 $344,500 3,269 4,806 98% 28 - - - - - - - - York Region 200 $70,707,105 $353,536 $330,750 494 801 98% 36 Aurora 5 $1,732,000 $346,400 $322,000 3 18 97% 21 E. Gwillimbury 2 $431,500 $215,750 $215,750 2 - 98% 14 Georgina - - - - - 6 - - King 3 $1,682,900 $560,967 $675,000 6 9 99% 91 Markham 74 $24,777,279 $334,828 $313,400 181 280 97% 33 Newmarket 3 $721,000 $240,333 $261,000 7 7 99% 70 Richmond Hill 50 $16,974,100 $339,482 $307,750 129 219 98% 33 Vaughan 59 $22,293,426 $377,855 $357,000 164 256 97% 37 Whitchurch-Stouffville 4 $2,094,900 $523,725 $489,950 2 6 99% 91- - - - - - - - Durham Region 43 $10,110,100 $235,119 $230,000 62 62 99% 17 Ajax 4 $871,000 $217,750 $217,500 13 12 99% 17 Brock - - - - - - - - Clarington 7 $1,476,000 $210,857 $214,000 13 9 101% 10 Oshawa 9 $1,323,900 $147,100 $167,000 10 11 98% 16 Pickering 8 $2,235,500 $279,438 $260,000 17 16 98% 13 Scugog - - - - - 3 - - Uxbridge 1 $244,200 $244,200 $244,200 - 2 98% 12 Whitby 14 $3,959,500 $282,821 $272,450 9 9 98% 24- - - - - - - - Dufferin County 1 $382,500 $382,500 $382,500 1 4 96% 220 Orangeville 1 $382,500 $382,500 $382,500 1 4 96% 220- - - - - - - - Simcoe County 3 $717,400 $239,133 $209,900 5 17 98% 88 Adjala-Tosorontio - - - - - - - - Bradford West Gwillimbury - - - - 3 5 - - Essa - - - - - - - - Innisfil - - - - - - - - New Tecumseth 3 $717,400 $239,133 $209,900 2 12 98% 88 ! TURN PAGE FOR CITY OF TORONTO TABLES OR CLICK HERE: SUMMARY OF EXISTING HOME TRANSACTIONS CONDOMINIUM APARTMENT, APRIL 2014 13
- 14. Industrial Leasing July 2010Page 3 Toronto Real Estate Board Market Watch, April 2014 14 CITY OF TORONTO MUNICIPAL BREAKDOWN Sales1 Dollar Volume1 Average Price1 Median Price1 New Listings2 Active Listings3 Avg. SP/LP4 Avg. DOM5 TREB Total 2,123 $762,037,853 $358,944 $319,200 4,575 6,895 98% 29 City of Toronto Total 1,505 $579,061,497 $384,758 $344,500 3,269 4,806 98% 28 Toronto West 281 $91,097,640 $324,191 $300,000 693 1,100 98% 32 Toronto W01 25 $11,032,600 $441,304 $362,000 61 89 99% 26 Toronto W02 21 $8,762,627 $417,268 $375,000 39 41 104% 29 Toronto W03 10 $3,078,300 $307,830 $328,500 8 14 98% 18 Toronto W04 17 $3,326,100 $195,653 $180,000 46 69 97% 32 Toronto W05 17 $4,184,500 $246,147 $193,000 54 90 98% 48 Toronto W06 63 $23,850,713 $378,583 $330,000 219 380 97% 36 Toronto W07 2 $565,000 $282,500 $282,500 2 3 98% 32 Toronto W08 79 $26,732,200 $338,382 $308,000 170 261 98% 29 Toronto W09 16 $4,007,900 $250,494 $263,250 35 54 96% 23 Toronto W10 31 $5,557,700 $179,281 $190,000 59 99 97% 37 Toronto Central 955 $420,843,003 $440,673 $385,000 2,178 3,184 98% 27 Toronto C01 338 $147,158,407 $435,380 $393,500 895 1,423 98% 30 Toronto C02 38 $24,980,076 $657,370 $576,000 96 189 99% 26 Toronto C03 9 $6,789,000 $754,333 $634,000 17 20 98% 24 Toronto C04 24 $12,635,300 $526,471 $469,650 22 25 99% 27 Toronto C06 23 $8,695,950 $378,085 $355,000 35 53 98% 32 Toronto C07 53 $18,805,410 $354,819 $345,000 129 182 99% 26 Toronto C08 142 $62,600,623 $440,849 $407,500 309 380 98% 24 Toronto C09 14 $9,804,000 $700,286 $549,500 25 22 101% 26 Toronto C10 39 $23,190,211 $594,621 $445,000 70 69 100% 19 Toronto C11 33 $8,803,290 $266,766 $243,000 49 48 97% 30 Toronto C12 6 $5,753,000 $958,833 $797,500 16 31 96% 49 Toronto C13 39 $13,426,700 $344,274 $299,900 62 75 100% 18 Toronto C14 119 $49,375,136 $414,917 $407,000 294 427 98% 27 Toronto C15 78 $28,825,900 $369,563 $335,000 159 240 98% 32 Toronto East 269 $67,120,854 $249,520 $245,000 398 522 98% 25 Toronto E01 11 $4,335,033 $394,094 $375,000 31 45 99% 13 Toronto E02 8 $3,710,000 $463,750 $480,500 15 19 99% 22 Toronto E03 11 $2,708,001 $246,182 $200,000 21 22 100% 12 Toronto E04 37 $7,698,680 $208,072 $215,000 54 64 97% 27 Toronto E05 38 $10,180,400 $267,905 $260,000 40 44 98% 25 Toronto E06 6 $1,861,500 $310,250 $284,000 10 8 100% 13 Toronto E07 49 $12,259,300 $250,190 $254,000 77 108 98% 24 Toronto E08 17 $3,912,050 $230,121 $175,000 28 37 100% 10 Toronto E09 59 $14,856,100 $251,798 $248,000 87 122 98% 31 Toronto E10 5 $784,400 $156,880 $163,000 7 10 98% 52 Toronto E11 28 $4,815,390 $171,978 $172,700 28 43 99% 31 SUMMARY OF EXISTING HOME TRANSACTIONS CONDOMINIUM APARTMENT, APRIL 2014
- 15. Industrial Leasing July 2010Page 3 Toronto Real Estate Board Market Watch, April 2014 ALL TREB AREAS Sales 1 Dollar Volume 1 Average Price 1 Median Price 1 New Listings 2 Active Listings 3 Avg. SP/LP 4 Avg. DOM 5 TREB Total 169 $84,746,271 $501,457 $506,000 230 140 101% 12- - - - - - - - Halton Region 17 $7,952,400 $467,788 $474,100 13 6 100% 13 Burlington 3 $1,194,900 $398,300 $395,000 2 1 104% 15 Halton Hills 2 $788,000 $394,000 $394,000 1 - 99% 7 Milton 2 $880,000 $440,000 $440,000 3 3 99% 22 Oakville 10 $5,089,500 $508,950 $493,700 7 2 100% 12- - - - - - - - Peel Region 19 $9,401,688 $494,826 $499,900 33 20 100% 12 Brampton 6 $2,592,400 $432,067 $433,450 12 10 98% 16 Caledon - - - - 1 1 - - Mississauga 13 $6,809,288 $523,791 $521,888 20 9 100% 10- - - - - - - - City of Toronto 10 $5,868,000 $586,800 $587,500 24 20 105% 13 - - - - - - - - York Region 69 $43,611,488 $632,051 $631,000 90 50 102% 11 Aurora 1 $570,000 $570,000 $570,000 - - 98% 20 E. Gwillimbury - - - - - - - - Georgina 1 $302,000 $302,000 $302,000 1 1 101% 7 King - - - - - - - - Markham 55 $35,649,900 $648,180 $661,000 76 36 103% 10 Newmarket 1 $480,000 $480,000 $480,000 2 1 99% 7 Richmond Hill 6 $3,666,000 $611,000 $608,500 5 7 99% 16 Vaughan 5 $2,943,588 $588,718 $536,000 6 5 99% 12 Whitchurch-Stouffville - - - - - - - -- - - - - - - - Durham Region 41 $13,984,795 $341,093 $347,500 57 32 100% 9 Ajax 7 $2,668,000 $381,143 $388,000 7 1 99% 4 Brock - - - - - - - - Clarington 19 $5,901,395 $310,600 $304,000 26 15 100% 10 Oshawa 3 $797,000 $265,667 $283,500 4 4 100% 6 Pickering 5 $2,093,000 $418,600 $434,000 7 2 102% 8 Scugog - - - - - - - - Uxbridge - - - - 1 1 - - Whitby 7 $2,525,400 $360,771 $372,000 12 9 100% 11- - - - - - - - Dufferin County - - - - - - - - Orangeville - - - - - - - -- - - - - - - - Simcoe County 13 $3,927,900 $302,146 $286,000 13 12 98% 22 Adjala-Tosorontio - - - - - - - - Bradford West Gwillimbury 3 $1,106,000 $368,667 $359,000 3 3 99% 35 Essa 7 $1,992,400 $284,629 $286,000 8 8 98% 14 Innisfil - - - - 1 1 - - New Tecumseth 3 $829,500 $276,500 $280,000 1 - 99% 27 SUMMARY OF EXISTING HOME TRANSACTIONS LINK, APRIL 2014 ! TURN PAGE FOR CITY OF TORONTO TABLES OR CLICK HERE: 15
- 16. Industrial Leasing July 2010Page 3 Toronto Real Estate Board Market Watch, April 2014 16 CITY OF TORONTO MUNICIPAL BREAKDOWN Sales1 Dollar Volume1 Average Price1 Median Price1 New Listings2 Active Listings3 Avg. SP/LP4 Avg. DOM5 TREB Total 169 $84,746,271 $501,457 $506,000 230 140 101% 12 City of Toronto Total 10 $5,868,000 $586,800 $587,500 24 20 105% 13 Toronto West 1 $408,000 $408,000 $408,000 1 2 97% 7 Toronto W01 - - - - - - - - Toronto W02 - - - - - - - - Toronto W03 - - - - - - - - Toronto W04 - - - - - - - - Toronto W05 - - - - - 1 - - Toronto W06 - - - - - - - - Toronto W07 - - - - - - - - Toronto W08 - - - - - - - - Toronto W09 - - - - - 1 - - Toronto W10 1 $408,000 $408,000 $408,000 1 - 97% 7 Toronto Central 5 $3,245,000 $649,000 $637,000 9 6 104% 19 Toronto C01 1 $750,000 $750,000 $750,000 1 - 119% 6 Toronto C02 - - - - - - - - Toronto C03 - - - - - - - - Toronto C04 - - - - - - - - Toronto C06 - - - - - - - - Toronto C07 2 $1,273,000 $636,500 $636,500 6 5 99% 31 Toronto C08 - - - - - - - - Toronto C09 - - - - - - - - Toronto C10 - - - - - - - - Toronto C11 - - - - - - - - Toronto C12 - - - - - - - - Toronto C13 - - - - - - - - Toronto C14 - - - - - - - - Toronto C15 2 $1,222,000 $611,000 $611,000 2 1 102% 14 Toronto East 4 $2,215,000 $553,750 $539,500 14 12 107% 7 Toronto E01 - - - - - - - - Toronto E02 - - - - - - - - Toronto E03 - - - - - - - - Toronto E04 - - - - - - - - Toronto E05 1 $618,000 $618,000 $618,000 5 3 110% 4 Toronto E06 - - - - - - - - Toronto E07 3 $1,597,000 $532,333 $529,000 9 8 105% 8 Toronto E08 - - - - - - - - Toronto E09 - - - - - - - - Toronto E10 - - - - - - - - Toronto E11 - - - - - 1 - - SUMMARY OF EXISTING HOME TRANSACTIONS LINK, APRIL 2014
- 17. Industrial Leasing July 2010Page 3 Toronto Real Estate Board Market Watch, April 2014 ALL TREB AREAS Sales 1 Dollar Volume 1 Average Price 1 Median Price 1 New Listings 2 Active Listings 3 Avg. SP/LP 4 Avg. DOM 5 TREB Total 803 $379,819,422 $473,001 $440,000 1,174 824 101% 14- - - - - - - - Halton Region 153 $68,632,526 $448,579 $425,000 201 151 100% 13 Burlington 17 $7,107,500 $418,088 $418,000 23 19 100% 16 Halton Hills 9 $3,747,053 $416,339 $410,000 11 6 100% 10 Milton 76 $30,851,849 $405,945 $410,000 99 60 100% 11 Oakville 51 $26,926,124 $527,963 $501,888 68 66 100% 16- - - - - - - - Peel Region 139 $56,396,441 $405,730 $389,000 238 177 99% 16 Brampton 93 $34,837,353 $374,595 $370,000 157 118 99% 18 Caledon 7 $2,721,000 $388,714 $393,000 14 16 99% 14 Mississauga 39 $18,838,088 $483,028 $465,000 67 43 100% 11- - - - - - - - City of Toronto 118 $75,274,195 $637,917 $563,000 207 154 103% 11 - - - - - - - - York Region 256 $136,536,871 $533,347 $527,750 364 237 101% 14 Aurora 20 $9,164,200 $458,210 $459,500 27 12 100% 13 E. Gwillimbury 6 $2,096,800 $349,467 $349,250 7 3 99% 18 Georgina 2 $691,900 $345,950 $345,950 8 7 99% 14 King 5 $3,553,500 $710,700 $720,000 7 5 99% 35 Markham 70 $39,094,890 $558,498 $539,000 88 55 102% 12 Newmarket 24 $10,541,300 $439,221 $442,450 25 15 99% 14 Richmond Hill 63 $36,137,981 $573,619 $568,000 101 66 102% 14 Vaughan 54 $30,233,000 $559,870 $540,000 92 72 99% 14 Whitchurch-Stouffville 12 $5,023,300 $418,608 $429,900 9 2 99% 18- - - - - - - - Durham Region 108 $34,664,139 $320,964 $326,500 125 73 100% 15 Ajax 29 $10,016,400 $345,393 $351,000 35 22 100% 22 Brock - - - - - - - - Clarington 23 $5,930,439 $257,845 $255,900 23 6 100% 9 Oshawa 11 $3,206,400 $291,491 $316,000 8 9 100% 15 Pickering 12 $4,286,250 $357,188 $363,250 11 6 100% 17 Scugog - - - - - - - - Uxbridge 2 $789,000 $394,500 $394,500 2 1 99% 11 Whitby 31 $10,435,650 $336,634 $334,750 46 29 100% 11- - - - - - - - Dufferin County 6 $1,753,500 $292,250 $294,750 8 6 98% 17 Orangeville 6 $1,753,500 $292,250 $294,750 8 6 98% 17- - - - - - - - Simcoe County 23 $6,561,750 $285,293 $263,000 31 26 98% 19 Adjala-Tosorontio - - - - - - - - Bradford West Gwillimbury 5 $1,943,250 $388,650 $390,000 10 12 98% 21 Essa 7 $1,685,500 $240,786 $242,000 8 4 98% 24 Innisfil 6 $1,608,000 $268,000 $269,500 5 2 98% 19 New Tecumseth 5 $1,325,000 $265,000 $270,000 8 8 99% 13 ! TURN PAGE FOR CITY OF TORONTO TABLES OR CLICK HERE: SUMMARY OF EXISTING HOME TRANSACTIONS ATTACHED/ROW/TOWNHOUSE, APRIL 2014 17
- 18. Industrial Leasing July 2010Page 3 Toronto Real Estate Board Market Watch, April 2014 18 CITY OF TORONTO MUNICIPAL BREAKDOWN Sales1 Dollar Volume1 Average Price1 Median Price1 New Listings2 Active Listings3 Avg. SP/LP4 Avg. DOM5 TREB Total 803 $379,819,422 $473,001 $440,000 1,174 824 101% 14 City of Toronto Total 118 $75,274,195 $637,917 $563,000 207 154 103% 11 Toronto West 30 $17,430,802 $581,027 $523,000 39 27 101% 12 Toronto W01 3 $2,392,224 $797,408 $785,106 3 1 102% 10 Toronto W02 2 $1,162,000 $581,000 $581,000 6 5 107% 5 Toronto W03 3 $1,592,003 $530,668 $515,000 2 - 118% 9 Toronto W04 3 $1,355,000 $451,667 $420,000 3 1 99% 5 Toronto W05 6 $2,757,500 $459,583 $450,750 9 8 98% 14 Toronto W06 5 $3,615,028 $723,006 $545,000 6 6 98% 16 Toronto W07 1 $580,000 $580,000 $580,000 - - 98% 26 Toronto W08 4 $2,660,047 $665,012 $661,524 7 4 102% 13 Toronto W09 - - - - 1 - - - Toronto W10 3 $1,317,000 $439,000 $422,000 2 2 95% 7 Toronto Central 29 $25,659,750 $884,819 $775,000 69 68 100% 11 Toronto C01 13 $9,876,500 $759,731 $710,000 27 19 103% 8 Toronto C02 1 $1,062,000 $1,062,000 $1,062,000 4 6 98% 26 Toronto C03 1 $1,573,750 $1,573,750 $1,573,750 3 3 99% 16 Toronto C04 - - - - 4 10 - - Toronto C06 1 $724,000 $724,000 $724,000 3 3 98% 21 Toronto C07 3 $2,638,000 $879,333 $865,000 8 6 95% 11 Toronto C08 2 $1,864,500 $932,250 $932,250 4 6 94% 15 Toronto C09 3 $3,839,000 $1,279,667 $1,438,000 5 2 100% 6 Toronto C10 3 $2,584,000 $861,333 $899,000 2 - 107% 12 Toronto C11 - - - - 2 2 - - Toronto C12 - - - - - - - - Toronto C13 - - - - 1 3 - - Toronto C14 2 $1,498,000 $749,000 $749,000 6 8 98% 14 Toronto C15 - - - - - - - - Toronto East 59 $32,183,643 $545,485 $510,000 99 59 107% 11 Toronto E01 13 $9,407,255 $723,635 $727,800 19 8 114% 6 Toronto E02 3 $2,105,300 $701,767 $645,000 10 7 99% 10 Toronto E03 2 $2,089,000 $1,044,500 $1,044,500 3 1 125% 6 Toronto E04 10 $5,146,300 $514,630 $531,750 14 13 100% 18 Toronto E05 3 $1,528,600 $509,533 $522,600 3 1 109% 8 Toronto E06 - - - - 1 2 - - Toronto E07 5 $2,625,888 $525,178 $508,000 5 1 115% 5 Toronto E08 3 $1,327,500 $442,500 $412,500 10 8 102% 5 Toronto E09 1 $488,000 $488,000 $488,000 2 2 100% 11 Toronto E10 7 $3,064,300 $437,757 $466,000 11 5 102% 9 Toronto E11 12 $4,401,500 $366,792 $364,250 21 11 99% 16 SUMMARY OF EXISTING HOME TRANSACTIONS ATTACHED/ROW/TOWNHOUSE, APRIL 2014
- 19. Industrial Leasing July 2010Page 3 Toronto Real Estate Board Market Watch, April 2014 ALL TREB AREAS Sales 1 Dollar Volume 1 Average Price 1 Median Price 1 New Listings 2 Active Listings 3 Avg. SP/LP 4 Avg. DOM 5 TREB Total 12 $5,040,803 $420,067 $362,500 23 28 97% 28- - - - - - - - Halton Region - - - - 1 - - - Burlington - - - - - - - - Halton Hills - - - - - - - - Milton - - - - 1 - - - Oakville - - - - - - - -- - - - - - - - Peel Region - - - - 3 4 - - Brampton - - - - - - - - Caledon - - - - - - - - Mississauga - - - - 3 4 - -- - - - - - - - City of Toronto 12 $5,040,803 $420,067 $362,500 19 24 97% 28 - - - - - - - - York Region - - - - - - - - Aurora - - - - - - - - E. Gwillimbury - - - - - - - - Georgina - - - - - - - - King - - - - - - - - Markham - - - - - - - - Newmarket - - - - - - - - Richmond Hill - - - - - - - - Vaughan - - - - - - - - Whitchurch-Stouffville - - - - - - - -- - - - - - - - Durham Region - - - - - - - - Ajax - - - - - - - - Brock - - - - - - - - Clarington - - - - - - - - Oshawa - - - - - - - - Pickering - - - - - - - - Scugog - - - - - - - - Uxbridge - - - - - - - - Whitby - - - - - - - -- - - - - - - - Dufferin County - - - - - - - - Orangeville - - - - - - - -- - - - - - - - Simcoe County - - - - - - - - Adjala-Tosorontio - - - - - - - - Bradford West Gwillimbury - - - - - - - - Essa - - - - - - - - Innisfil - - - - - - - - New Tecumseth - - - - - - - - SUMMARY OF EXISTING HOME TRANSACTIONS CO-OP APARTMENT, APRIL 2014 ! TURN PAGE FOR CITY OF TORONTO TABLES OR CLICK HERE: 19
- 20. Industrial Leasing July 2010Page 3 Toronto Real Estate Board Market Watch, April 2014 20 CITY OF TORONTO MUNICIPAL BREAKDOWN Sales1 Dollar Volume1 Average Price1 Median Price1 New Listings2 Active Listings3 Avg. SP/LP4 Avg. DOM5 TREB Total 12 $5,040,803 $420,067 $362,500 23 28 97% 28 City of Toronto Total 12 $5,040,803 $420,067 $362,500 19 24 97% 28 Toronto West 2 $341,000 $170,500 $170,500 7 9 99% 8 Toronto W01 - - - - - - - - Toronto W02 - - - - 1 2 - - Toronto W03 - - - - - - - - Toronto W04 - - - - - - - - Toronto W05 1 $131,000 $131,000 $131,000 3 3 90% 10 Toronto W06 - - - - 1 2 - - Toronto W07 1 $210,000 $210,000 $210,000 - - 105% 5 Toronto W08 - - - - 1 1 - - Toronto W09 - - - - 1 1 - - Toronto W10 - - - - - - - - Toronto Central 8 $4,193,803 $524,225 $472,900 9 13 97% 32 Toronto C01 - - - - - - - - Toronto C02 - - - - - - - - Toronto C03 - - - - 2 3 - - Toronto C04 1 $130,000 $130,000 $130,000 1 1 100% 26 Toronto C06 - - - - - - - - Toronto C07 - - - - - - - - Toronto C08 1 $340,000 $340,000 $340,000 - 1 95% 5 Toronto C09 5 $3,273,003 $654,601 $542,003 5 7 96% 40 Toronto C10 - - - - - - - - Toronto C11 - - - - - - - - Toronto C12 - - - - - - - - Toronto C13 - - - - - - - - Toronto C14 - - - - 1 1 - - Toronto C15 1 $450,800 $450,800 $450,800 - - 99% 23 Toronto East 2 $506,000 $253,000 $253,000 3 2 100% 32 Toronto E01 - - - - - - - - Toronto E02 1 $379,000 $379,000 $379,000 1 - 100% 17 Toronto E03 - - - - - - - - Toronto E04 1 $127,000 $127,000 $127,000 1 1 102% 47 Toronto E05 - - - - - - - - Toronto E06 - - - - - - - - Toronto E07 - - - - - - - - Toronto E08 - - - - - - - - Toronto E09 - - - - 1 1 - - Toronto E10 - - - - - - - - Toronto E11 - - - - - - - - SUMMARY OF EXISTING HOME TRANSACTIONS CO-OP APARTMENT, APRIL 2014
- 21. Industrial Leasing July 2010Page 3 Toronto Real Estate Board Market Watch, April 2014 ALL TREB AREAS Sales 1 Dollar Volume 1 Average Price 1 Median Price 1 New Listings 2 Active Listings 3 Avg. SP/LP 4 Avg. DOM 5 TREB Total 5 $2,881,000 $576,200 $530,000 19 41 99% 92- - - - - - - - Halton Region 1 $1,150,000 $1,150,000 $1,150,000 - - 101% 18 Burlington - - - - - - - - Halton Hills - - - - - - - - Milton - - - - - - - - Oakville 1 $1,150,000 $1,150,000 $1,150,000 - - 101% 18- - - - - - - - Peel Region - - - - 5 11 - - Brampton - - - - 3 7 - - Caledon - - - - 1 2 - - Mississauga - - - - 1 2 - -- - - - - - - - City of Toronto - - - - - 1 - - - - - - - - - - York Region - - - - - - - - Aurora - - - - - - - - E. Gwillimbury - - - - - - - - Georgina - - - - - - - - King - - - - - - - - Markham - - - - - - - - Newmarket - - - - - - - - Richmond Hill - - - - - - - - Vaughan - - - - - - - - Whitchurch-Stouffville - - - - - - - -- - - - - - - - Durham Region - - - - 1 - - - Ajax - - - - 1 - - - Brock - - - - - - - - Clarington - - - - - - - - Oshawa - - - - - - - - Pickering - - - - - - - - Scugog - - - - - - - - Uxbridge - - - - - - - - Whitby - - - - - - - -- - - - - - - - Dufferin County - - - - - - - - Orangeville - - - - - - - -- - - - - - - - Simcoe County 4 $1,731,000 $432,750 $435,000 13 29 98% 110 Adjala-Tosorontio - - - - - - - - Bradford West Gwillimbury - - - - - - - - Essa - - - - - - - - Innisfil - - - - - - - - New Tecumseth 4 $1,731,000 $432,750 $435,000 13 29 98% 110 ! TURN PAGE FOR CITY OF TORONTO TABLES OR CLICK HERE: SUMMARY OF EXISTING HOME TRANSACTIONS DETACHED CONDOMINIUM, APRIL 2014 21
- 22. Industrial Leasing July 2010Page 3 Toronto Real Estate Board Market Watch, April 2014 22 CITY OF TORONTO MUNICIPAL BREAKDOWN Sales1 Dollar Volume1 Average Price1 Median Price1 New Listings2 Active Listings3 Avg. SP/LP4 Avg. DOM5 TREB Total 5 $2,881,000 $576,200 $530,000 19 41 99% 92 City of Toronto Total - - - - - 1 - - Toronto West - - - - - - - - Toronto W01 - - - - - - - - Toronto W02 - - - - - - - - Toronto W03 - - - - - - - - Toronto W04 - - - - - - - - Toronto W05 - - - - - - - - Toronto W06 - - - - - - - - Toronto W07 - - - - - - - - Toronto W08 - - - - - - - - Toronto W09 - - - - - - - - Toronto W10 - - - - - - - - Toronto Central - - - - - 1 - - Toronto C01 - - - - - - - - Toronto C02 - - - - - - - - Toronto C03 - - - - - - - - Toronto C04 - - - - - - - - Toronto C06 - - - - - - - - Toronto C07 - - - - - - - - Toronto C08 - - - - - - - - Toronto C09 - - - - - 1 - - Toronto C10 - - - - - - - - Toronto C11 - - - - - - - - Toronto C12 - - - - - - - - Toronto C13 - - - - - - - - Toronto C14 - - - - - - - - Toronto C15 - - - - - - - - Toronto East - - - - - - - - Toronto E01 - - - - - - - - Toronto E02 - - - - - - - - Toronto E03 - - - - - - - - Toronto E04 - - - - - - - - Toronto E05 - - - - - - - - Toronto E06 - - - - - - - - Toronto E07 - - - - - - - - Toronto E08 - - - - - - - - Toronto E09 - - - - - - - - Toronto E10 - - - - - - - - Toronto E11 - - - - - - - - SUMMARY OF EXISTING HOME TRANSACTIONS DETACHED CONDOMINIUM, APRIL 2014
- 23. Industrial Leasing July 2010Page 3 Toronto Real Estate Board Market Watch, April 2014 23 ALL TREB AREAS Sales 1 Dollar Volume 1 Average Price 1 Median Price 1 New Listings 2 Active Listings 3 Avg. SP/LP 4 Avg. DOM 5 TREB Total 4 $1,111,700 $277,925 $293,350 7 13 98% 24- - - - - - - - Halton Region - - - - - - - - Burlington - - - - - - - - Halton Hills - - - - - - - - Milton - - - - - - - - Oakville - - - - - - - -- - - - - - - - Peel Region - - - - - - - - Brampton - - - - - - - - Caledon - - - - - - - - Mississauga - - - - - - - -- - - - - - - - City of Toronto 4 $1,111,700 $277,925 $293,350 7 13 98% 24 - - - - - - - - York Region - - - - - - - - Aurora - - - - - - - - E. Gwillimbury - - - - - - - - Georgina - - - - - - - - King - - - - - - - - Markham - - - - - - - - Newmarket - - - - - - - - Richmond Hill - - - - - - - - Vaughan - - - - - - - - Whitchurch-Stouffville - - - - - - - -- - - - - - - - Durham Region - - - - - - - - Ajax - - - - - - - - Brock - - - - - - - - Clarington - - - - - - - - Oshawa - - - - - - - - Pickering - - - - - - - - Scugog - - - - - - - - Uxbridge - - - - - - - - Whitby - - - - - - - -- - - - - - - - Dufferin County - - - - - - - - Orangeville - - - - - - - -- - - - - - - - Simcoe County - - - - - - - - Adjala-Tosorontio - - - - - - - - Bradford West Gwillimbury - - - - - - - - Essa - - - - - - - - Innisfil - - - - - - - - New Tecumseth - - - - - - - - ! TURN PAGE FOR CITY OF TORONTO TABLES OR CLICK HERE: SUMMARY OF EXISTING HOME TRANSACTIONS CO-OWNERSHIP APARTMENT, APRIL 2014
- 24. Industrial Leasing July 2010Page 3 Toronto Real Estate Board Market Watch, April 2014 24 CITY OF TORONTO MUNICIPAL BREAKDOWN Sales1 Dollar Volume1 Average Price1 Median Price1 New Listings2 Active Listings3 Avg. SP/LP4 Avg. DOM5 TREB Total 4 $1,111,700 $277,925 $293,350 7 13 98% 24 City of Toronto Total 4 $1,111,700 $277,925 $293,350 7 13 98% 24 Toronto West - - - - 1 4 - - Toronto W01 - - - - - - - - Toronto W02 - - - - - - - - Toronto W03 - - - - - - - - Toronto W04 - - - - - - - - Toronto W05 - - - - - 3 - - Toronto W06 - - - - - - - - Toronto W07 - - - - 1 1 - - Toronto W08 - - - - - - - - Toronto W09 - - - - - - - - Toronto W10 - - - - - - - - Toronto Central 4 $1,111,700 $277,925 $293,350 6 9 98% 24 Toronto C01 - - - - - - - - Toronto C02 1 $350,000 $350,000 $350,000 2 3 100% 23 Toronto C03 2 $586,700 $293,350 $293,350 3 2 98% 26 Toronto C04 - - - - - 1 - - Toronto C06 - - - - - - - - Toronto C07 - - - - - - - - Toronto C08 1 $175,000 $175,000 $175,000 - - 97% 21 Toronto C09 - - - - - - - - Toronto C10 - - - - - - - - Toronto C11 - - - - - - - - Toronto C12 - - - - - - - - Toronto C13 - - - - 1 1 - - Toronto C14 - - - - - 2 - - Toronto C15 - - - - - - - - Toronto East - - - - - - - - Toronto E01 - - - - - - - - Toronto E02 - - - - - - - - Toronto E03 - - - - - - - - Toronto E04 - - - - - - - - Toronto E05 - - - - - - - - Toronto E06 - - - - - - - - Toronto E07 - - - - - - - - Toronto E08 - - - - - - - - Toronto E09 - - - - - - - - Toronto E10 - - - - - - - - Toronto E11 - - - - - - - - SUMMARY OF EXISTING HOME TRANSACTIONS CO-OWNERSHIP APARTMENT, APRIL 2014
- 25. Industrial Leasing July 2010Page 3 Toronto Real Estate Board Market Watch, April 2014 25 FOCUS ON THE MLS® HOME PRICE INDEX INDEX AND BENCHMARK PRICE, APRIL 2014 ALL TREB AREAS Index Benchmark Yr./Yr. % Chg. Index Benchmark Yr./Yr. % Chg. Index Benchmark Yr./Yr. % Chg. Index Benchmark Yr./Yr. % Chg. Index Benchmark Yr./Yr. % Chg. TREB Total 164.8 $502,700 7.01% 166.0 $617,300 7.58% 171.4 $484,200 7.60% 160.4 $351,300 6.08% 154.3 $309,900 4.61% Halton Region 173.7 $569,800 6.50% 170.9 $633,700 5.95% 174.8 $453,700 7.37% 165.6 $327,800 4.41% - - - Burlington 180.0 $518,800 4.96% 177.7 $607,300 4.16% 177.3 $422,600 7.26% 174.6 $350,600 4.36% - - - Halton Hills 159.1 $463,200 3.92% 159.1 $509,000 4.05% 170.2 $419,200 6.71% 155.3 $280,000 1.44% - - - Milton 167.3 $469,200 8.28% 157.1 $547,300 7.53% 170.0 $424,400 8.07% - - - - - - Oakville 180.6 $666,300 5.80% 179.7 $744,800 5.64% 182.1 $492,900 6.12% 166.6 $368,000 5.44% - - - Peel Region 156.9 $429,200 5.16% 157.9 $534,500 5.13% 159.5 $407,000 5.28% 162.2 $335,600 4.17% 141.3 $243,200 4.43% Brampton 149.8 $382,100 4.98% 149.8 $437,800 4.10% 151.4 $356,600 4.70% 146.0 $271,200 3.91% 125.3 $196,100 7.37% Caledon 145.5 $518,400 2.25% 146.0 $535,900 2.38% 161.7 $399,800 4.32% - - - - - - Mississauga 163.4 $456,700 5.62% 169.7 $632,300 6.66% 168.8 $461,300 6.16% 167.3 $359,300 4.37% 144.2 $252,500 4.12% City of Toronto 169.0 $553,900 7.37% 175.2 $759,500 9.30% 182.5 $605,200 8.76% 164.9 $398,800 7.50% 157.4 $325,000 4.45% York Region 175.1 $600,900 8.35% 175.7 $690,300 7.79% 179.6 $520,300 8.85% 161.2 $410,900 6.61% 153.7 $333,900 5.13% Aurora 167.2 $538,400 8.22% 166.9 $620,000 8.73% 172.6 $446,700 9.31% 137.1 $347,300 -3.11% 147.3 $306,100 2.94% E. Gwillimbury 154.2 $498,500 8.67% 154.6 $507,800 8.57% 165.1 $349,600 9.99% - - - - - - Georgina 149.1 $309,400 1.98% 155.0 $319,300 3.54% 161.5 $318,300 7.74% - - - - - - King 162.2 $687,600 6.22% 163.8 $691,200 6.36% - - - - - - - - - Markham 180.0 $620,100 8.37% 183.6 $755,000 8.06% 183.4 $546,200 9.30% 168.0 $417,400 8.88% 159.6 $369,100 5.14% Newmarket 160.1 $472,100 9.21% 158.2 $532,600 9.56% 165.7 $390,500 8.37% 154.5 $311,900 -1.97% 147.3 $248,100 0.41% Richmond Hill 183.9 $665,900 8.05% 193.7 $820,700 8.21% 190.5 $577,100 8.55% 158.2 $447,300 8.65% 150.2 $312,900 3.73% Vaughan 174.6 $631,100 8.92% 167.9 $698,700 6.20% 179.6 $546,700 8.78% 167.7 $458,200 11.65% 150.5 $334,000 6.44% Whitchurch-Stouffville 172.2 $649,300 7.96% 173.0 $663,900 8.53% 154.4 $424,100 7.07% - - - - - - Durham Region 146.3 $344,200 7.73% 145.6 $379,700 7.37% 151.4 $303,200 7.68% 137.0 $225,200 9.08% 140.1 $250,600 9.97% Ajax 153.0 $378,100 7.97% 152.5 $408,400 6.27% 159.5 $343,000 7.55% 139.9 $255,700 7.86% 135.6 $230,200 9.62% Brock 129.3 $245,100 2.86% 129.9 $246,900 3.10% 138.5 $220,700 3.28% - - - - - - Clarington 141.4 $299,200 5.76% 137.5 $330,500 4.64% 144.7 $276,300 5.16% 159.3 $285,200 14.11% 139.1 $196,900 11.28% Oshawa 141.0 $269,800 8.05% 140.4 $298,900 8.17% 145.9 $244,300 7.36% 122.2 $163,500 11.39% 140.4 $168,000 7.34% Pickering 154.0 $416,600 9.84% 156.0 $488,000 10.87% 159.4 $371,500 10.39% 145.4 $262,300 6.21% 144.3 $282,500 12.30% Scugog 139.6 $362,300 2.72% 143.6 $369,800 2.94% 135.0 $282,500 7.40% - - - - - - Uxbridge 142.0 $434,200 7.17% 142.1 $440,100 6.84% 139.1 $341,300 6.51% - - - - - - Whitby 147.0 $383,500 7.77% 148.0 $425,200 8.35% 149.7 $330,300 8.01% 139.9 $256,500 9.04% 138.0 $269,200 6.07% Dufferin County 151.3 $346,800 6.18% 155.9 $355,200 6.93% 148.6 $278,500 3.19% - - - - - - Orangeville 151.3 $346,800 6.18% 155.9 $355,200 6.93% 148.6 $278,500 3.19% - - - - - - Simcoe County 147.9 $314,300 6.10% 143.7 $316,900 5.66% 153.2 $294,200 5.15% - - - - - - Adjala-Tosorontio 134.6 $423,900 6.83% 134.5 $424,100 6.75% - - - - - - - - - Bradford West Gwillimbury 163.1 $405,400 8.16% 147.4 $451,500 8.46% 167.9 $349,100 7.28% - - - - - - Essa 145.6 $330,200 4.90% 143.3 $354,500 5.52% 144.6 $246,300 1.19% - - - - - - Innisfil 146.3 $271,100 4.95% 146.7 $272,300 4.64% 157.9 $245,600 7.63% - - - - - - New Tecumseth 135.9 $313,900 4.78% 133.0 $342,600 4.81% 141.1 $269,900 4.44% - - - - - - Townhouse Apartment ! TURN PAGE FOR CITY OF TORONTO TABLES OR CLICK HERE: Composite Single-Family Detached Single-Family Attached CLICK HERE FOR MORE BACKGROUND INFORMATION ON THE MLS® HPI
- 26. Industrial Leasing July 2010Page 3 Toronto Real Estate Board Market Watch, April 2014 26 FOCUS ON THE MLS® HOME PRICE INDEX INDEX AND BENCHMARK PRICE, APRIL 2014 CITY OF TORONTO Index Benchmark Yr./Yr. % Chg. Index Benchmark Yr./Yr. % Chg. Index Benchmark Yr./Yr. % Chg. Index Benchmark Yr./Yr. % Chg. Index Benchmark Yr./Yr. % Chg. TREB Total 164.8 $502,700 7.01% 166.0 $617,300 7.58% 171.4 $484,200 7.60% 160.4 $351,300 6.08% 154.3 $309,900 4.61% City of Toronto 169.0 $553,900 7.37% 175.2 $759,500 9.30% 182.5 $605,200 8.76% 164.9 $398,800 7.50% 157.4 $325,000 4.45% Toronto W01 163.5 $667,200 1.93% 166.5 $858,200 5.31% 175.2 $676,000 3.42% 208.9 $430,100 -1.23% 140.9 $328,800 0.50% Toronto W02 192.4 $694,000 6.95% 189.6 $778,200 7.00% 220.7 $676,100 8.99% 142.2 $392,100 5.96% 130.2 $541,200 8.41% Toronto W03 174.2 $449,900 9.22% 177.7 $483,300 10.37% 181.0 $463,700 8.97% - - - 131.2 $243,400 3.06% Toronto W04 153.4 $401,700 8.79% 161.0 $508,100 8.93% 158.3 $460,900 9.63% 138.9 $337,900 -2.05% 135.3 $199,300 7.98% Toronto W05 145.7 $346,900 5.73% 161.9 $539,700 10.89% 149.6 $437,500 9.28% 142.6 $234,800 8.44% 116.9 $153,500 -10.22% Toronto W06 152.1 $441,500 3.33% 183.7 $583,000 11.06% 151.1 $458,100 4.35% 153.1 $451,100 -3.35% 126.2 $312,200 -3.74% Toronto W07 165.4 $704,900 11.68% 173.4 $749,400 11.30% 153.9 $631,100 6.88% 132.9 $488,500 3.67% 111.0 $450,100 8.19% Toronto W08 149.3 $607,400 7.56% 162.6 $850,500 9.13% 166.1 $624,000 9.71% 138.3 $338,100 -2.05% 134.5 $270,800 6.75% Toronto W09 154.9 $398,100 12.00% 172.3 $644,600 9.40% 154.1 $436,200 10.39% 139.2 $353,100 -4.79% 128.9 $165,300 17.50% Toronto W10 144.3 $334,900 5.56% 157.3 $462,900 7.59% 153.2 $416,300 5.15% 124.9 $225,000 7.03% 126.4 $193,000 0.16% Toronto C01 187.1 $464,100 4.58% 200.9 $709,200 3.77% 210.8 $731,400 7.88% 176.5 $529,700 6.01% 183.4 $381,700 4.03% Toronto C02 178.0 $845,200 5.08% 162.8 $1,290,400 3.83% 181.0 $952,400 5.66% 173.0 $809,000 4.09% 179.7 $501,100 5.33% Toronto C03 180.3 $928,000 6.37% 177.9 $1,072,200 6.46% 183.1 $677,800 3.68% - - - 178.2 $470,800 7.48% Toronto C04 167.3 $1,036,500 7.94% 172.2 $1,203,800 8.23% 173.2 $828,000 9.62% 159.1 $594,400 11.03% 144.6 $343,800 5.32% Toronto C06 178.4 $706,000 8.19% 184.1 $788,000 9.98% 151.7 $557,900 1.68% 150.5 $410,700 12.65% 173.0 $382,500 5.75% Toronto C07 165.0 $566,700 5.36% 190.8 $873,500 10.74% 166.1 $590,300 6.41% 142.9 $419,500 12.34% 147.0 $346,300 -1.01% Toronto C08 172.7 $444,700 3.66% 159.2 $494,800 -3.10% 179.3 $742,100 3.88% 183.6 $556,800 5.70% 172.3 $380,100 3.80% Toronto C09 135.6 $1,007,000 4.87% 123.4 $1,550,100 -0.56% 142.8 $1,162,000 -0.28% 160.8 $830,000 5.44% 145.3 $481,400 11.00% Toronto C10 187.5 $731,400 8.38% 178.0 $1,092,300 11.88% 179.2 $885,100 8.08% 215.2 $493,500 2.14% 192.3 $460,700 9.20% Toronto C11 160.3 $574,400 12.89% 161.2 $1,079,200 5.77% 183.6 $805,600 7.06% 121.5 $193,800 6.77% 159.4 $226,900 21.87% Toronto C12 157.4 $1,348,900 5.35% 150.6 $1,618,500 4.66% 179.6 $776,000 9.18% 166.2 $563,000 9.63% 174.8 $549,800 6.52% Toronto C13 159.9 $589,900 7.17% 174.4 $934,400 8.46% 163.4 $524,300 7.43% 153.9 $438,300 8.08% 143.8 $284,500 4.35% Toronto C14 173.4 $589,300 4.08% 198.3 $1,075,900 8.90% 189.1 $922,500 5.52% 232.8 $786,600 13.23% 159.8 $401,900 1.27% Toronto C15 166.7 $557,300 8.95% 190.2 $891,600 10.01% 173.6 $566,500 8.70% 178.6 $440,000 8.77% 140.7 $328,800 9.07% Toronto E01 203.9 $633,300 10.40% 199.3 $671,400 10.23% 212.1 $665,400 12.10% 214.7 $434,200 7.62% 187.8 $445,500 4.62% Toronto E02 188.8 $702,300 15.05% 175.3 $772,000 12.66% 198.3 $661,400 15.90% 167.7 $560,600 3.52% 179.9 $476,100 8.90% Toronto E03 173.5 $534,500 9.88% 175.1 $588,200 9.64% 176.5 $574,700 9.22% - - - 138.6 $207,300 9.05% Toronto E04 175.0 $439,300 14.53% 180.5 $533,000 11.90% 176.2 $427,500 12.30% 171.3 $370,200 12.77% 174.4 $264,200 21.53% Toronto E05 162.1 $433,500 9.16% 185.0 $653,200 12.74% 182.5 $503,000 13.21% 164.2 $357,000 10.05% 134.7 $264,600 2.82% Toronto E06 185.0 $522,800 9.14% 185.6 $530,400 8.98% 191.4 $452,700 7.71% - - - 165.8 $365,600 11.65% Toronto E07 173.8 $428,500 11.05% 192.3 $629,400 15.50% 183.4 $479,400 13.63% 178.0 $384,900 12.66% 150.3 $257,300 6.14% Toronto E08 162.4 $398,000 10.10% 175.7 $548,500 9.06% 162.0 $414,600 4.85% 166.3 $336,700 14.22% 134.0 $213,900 12.42% Toronto E09 158.1 $381,700 9.34% 172.1 $489,800 11.90% 164.0 $402,500 11.26% 154.3 $284,300 13.21% 142.0 $266,300 5.03% Toronto E10 164.6 $466,000 9.01% 166.0 $531,400 8.78% 163.0 $424,000 7.59% 170.1 $297,900 12.57% 130.1 $209,700 11.58% Toronto E11 157.2 $346,600 11.02% 174.5 $484,600 8.79% 167.3 $379,600 8.92% 130.2 $255,900 18.04% 132.2 $197,300 18.04% ApartmentComposite Single-Family Detached Single-Family Attached Townhouse CLICK HERE FOR MORE BACKGROUND INFORMATION ON THE MLS® HPI
- 27. July 2010Page 3 Toronto Real Estate Board Market Watch, April 2014 27 YEAR SALES AVERAGE PRICE 2003 78,898 $293,067 2004 83,501 $315,231 2005 84,145 $335,907 2006 83,084 $351,941 2007 93,193 $376,236 2008 74,552 $379,347 2009 87,308 $395,460 2010 85,545 $431,276 2011 89,096 $465,014 2012 85,496 $497,130 2013 87,064 $523,013 January 4,229 $482,080 February 5,613 $509,396 March 7,537 $517,232 April 9,535 $524,868 May 9,946 $540,544 June 8,821 $529,614 July 8,367 $512,286 August 7,392 $501,739 September 7,258 $532,631 October 7,947 $539,431 November 6,358 $538,867 December 4,061 $520,242 Annual 87,064 $523,013 January 4,106 $526,927 February 5,699 $552,736 March 8,067 $557,725 April 9,706 $577,898 May - - June - - July - - August - - September - - October - - November - - December - - Year-to-Date 27,578 $559,208 HISTORIC ANNUAL STATISTICS1,6,7 2014 MONTHLY STATISTICS1,7 2013 MONTHLY STATISTICS1,7 *For historic annual sales and average price data over a longer time frame go to: http://www.torontorealestateboard.com/market_news/market_watch/histori c_stats/pdf/TREB_historic_statistics.pdf NOTES 8 SNLR = Sales-to-New Listings Ratio. Calculated using a 12-month moving average (sales/new listings). 9 Mos. Inv. = Months of Inventory. Calculated using a 12-month moving average (active listings/sales). 7 Past monthly and year-to-date figures are revised on a monthly basis. 1 Sales, dollar volume, average sale prices and median sale prices are based on firm transactions entered into the TorontoMLS® system between the first and last day of the month/period being reported. 2 New listings entered into the TorontoMLS® system between the first and last day of the month/period being reported. 3 Active listings at the end of the last day of the month/period being reported. 4 Ratio of the average selling price to the average listing price for firm transactions entered into the TorontoMLS® system between the first and last day of the month/period being reported. 5 Average number of days on the market for firm transactions entered into the TorontoMLS® system between the first and last day of the month/period being reported. 6 Due to past changes to TREB's service area, caution should be exercised when making historical comparisons. Copyright® 2014 Toronto Real Estate Board