SlideShare a Scribd company logo
1 of 1
Download to read offline
Office Market Dashboard
      Downtown
  2011 Q1
 MARKET SNAPSHOT                                                                                                                                               MAP OF MARKET
                                                            2010 Q4              2011 Q1             Trend
                           Office Inventory*             69,853,423             69,731,115             q
                            Net Absorption                  705,012              774,454               p
                            Vacancy Rate                     5.6%                 5.7%                 p
           Average Asking Net Rent                          $22.99               $22.82                q
                 Average Additional Rent                    $24.64               $24.90                p
 *Office Inventory: For the purpose of this report, buildings with less than 10,000 SF of
 office space and buildings owned and occupied by the government have not been
 included in the office inventory. There are 524 office buildings surveyed in the
 Downtown office region.


 GROSS RENT & AVAILABILITY BY BUILDING CLASS                                                                                                                   AVAILABLE SUPPLY SPLIT
                                 Avail. Office Space        Not Avail. Office Space          Gross Rent                                                                            Sublease Avail      Direct Avail     Sublease % of Total Avail.
                                                                                                                                                                             800                                                                     20%
                     $80                                                                               3,000
                                                                                                                                                                             700                                                                     18%
                     $70                                                                                                                                                                                                                             16%
                             $67.81                                                                    2,500                                                                 600
                                                                                                                                                                                                                                                     14%
                                                                                                                                                             SF (10,000's)

                     $60                                                                                                                                                     500                                                                     12%
                                                                                                       2,000                                                                 400                                                                     10%
                     $50
                                                                                                                SF (10,000's)


                                            $46.35                                                                                                                                                                                                   8%
  Gross Rent $/SF


                                                                                                                                                                             300
                     $40                                                                               1,500                                                                                                                                         6%
                                                                 $35.47                                                                                                      200
                                                                                                                                                                                                                                                     4%
                     $30                                                          $30.06                                                                                     100
                                                                                                       1,000                                                                                                                                         2%
                     $20                                                                                                                                                       0                                                                     0%
                                                                                                       500                                                                         2009 Q4   2010 Q1   2010 Q2    2010 Q3   2010 Q4   2011 Q1
                     $10

                       $-                                                                              0
                                Class AAA         Class A             Class B           Class C
                                                                                                                                                               RECENT TRANSACTIONS
                                                                                                                                                                    * The top sale transaction this quarter was 409,659 SF for $103,000,000
                                                                                                                                                                    at 180 Dundas Street West. The deal closed January 25th.
 Note: Not available office space (light blue) and available office space (dark blue) add
 up to the total inventory of office space in the respective building class.                                                                                        * The top lease transaction this quarter was 28,265 SF at 100 King
                                                                                                                                                                    Street West. The deal closed on February 28th and the tenant was UBS
                                                                                                                                                                    Bank.

 18 MONTH TREND                                                                                                                                                TOP PROJECTS UNDER CONSTRUCTION
                                                                                                                                                                       * GWL Realty Advisors has 644,952 SF under construction at 18 York
                                        Absorption          Vacancy Rate          Asking Net Rent                                                                      Street.

           1,000                                                                            $22.82         25
                                                                                                                    Asking Net Rent ($) / Vacancy Rate (%)


                    800                                                                                                                                        MARKET CHARACTERISTICS
                                                                                                           20
                                                                                                                                                                    * The Downtown market includes the Financial Core, Downtown East,
                    600                                                                                                                                             Downtown North, Downtown South & Downtown West.
Thousands (SF)


                                                                                                           15                                                       * GTA top annual rental rates are achieved in buildings located in this
                                                                                                                                                                    market.
                    400
                                                                                                                                                                    * Market is in high demand by users looking for a prestige urban location
                                                                                                           10                                                       and modern, state-of-the-art architecture.
                    200                                                                                                                                             * Limited parking, but great access to public transit and the PATH system
                                                                                           5.7                                                                      (Toronto's underground walkway).
                                                                                                           5                                                        * Proximity to multiple amenities and services add convenience for
                       -
                                                                                                                                                                    employees and customers.
                              2009 Q4   2010 Q1        2010 Q2     2010 Q3       2010 Q4     2011 Q1                                                                * Submarket will benefit from the development of the Metrolinx
                    -200                                                                                   0                                                        transportation plan and MoveOntario 2020.


 Colliers International, 2011 Q1
 Information contained herein has been obtained from the owners or other sources deemed reliable. We have no reason to doubt its accuracy but regret we cannot guarantee it. All
 properties subject to change or withdrawal without notice. All numbers reported use the most accurate information available at the time of publishing, however we acknowledge that
 there may be marginal changes over time as more accurate information becomes available. Colliers Macaulay Nicolls (Ontario) Inc., Brokerage.

More Related Content

What's hot

Attribution Case Study - Ad-Tech Presentation
Attribution Case Study - Ad-Tech Presentation Attribution Case Study - Ad-Tech Presentation
Attribution Case Study - Ad-Tech Presentation Encore Media Metrics
 
CloroxAR08_Complete
CloroxAR08_CompleteCloroxAR08_Complete
CloroxAR08_Completefinance48
 
Attribution Case Study (Detailed) | Encore Media Metrics
Attribution Case Study (Detailed) | Encore Media MetricsAttribution Case Study (Detailed) | Encore Media Metrics
Attribution Case Study (Detailed) | Encore Media MetricsEncore Media Metrics
 
Loopnet Q4 2009 Insight Report 1 16 09
Loopnet Q4 2009 Insight Report 1 16 09Loopnet Q4 2009 Insight Report 1 16 09
Loopnet Q4 2009 Insight Report 1 16 09aporrazzo
 
southwest airline ar03
southwest airline ar03southwest airline ar03
southwest airline ar03finance40
 
Arvinmeritor2001 Annua lReport
Arvinmeritor2001 Annua lReportArvinmeritor2001 Annua lReport
Arvinmeritor2001 Annua lReportfinance27
 
telephone data systems USM2007AnnualReport
telephone data systems  USM2007AnnualReporttelephone data systems  USM2007AnnualReport
telephone data systems USM2007AnnualReportfinance48
 
Big_Lots_AR2004
Big_Lots_AR2004Big_Lots_AR2004
Big_Lots_AR2004finance50
 
williams 2008 AR Final
williams 2008 AR Finalwilliams 2008 AR Final
williams 2008 AR Finalfinance21
 
southwest airline ar01
southwest airline ar01southwest airline ar01
southwest airline ar01finance40
 
whirlpool Annual Report2005
whirlpool Annual Report2005whirlpool Annual Report2005
whirlpool Annual Report2005finance13
 
Fairborne Energy Corporate Presentation
Fairborne Energy Corporate PresentationFairborne Energy Corporate Presentation
Fairborne Energy Corporate PresentationCompany Spotlight
 
ns_2008_Annual_Report
ns_2008_Annual_Reportns_2008_Annual_Report
ns_2008_Annual_Reportfinance41
 
Loopnet Report Year End 2009 Sacramento
Loopnet Report Year End 2009 SacramentoLoopnet Report Year End 2009 Sacramento
Loopnet Report Year End 2009 Sacramentoaporrazzo
 
southwest airline ar02
southwest airline ar02southwest airline ar02
southwest airline ar02finance40
 

What's hot (16)

Attribution Case Study - Ad-Tech Presentation
Attribution Case Study - Ad-Tech Presentation Attribution Case Study - Ad-Tech Presentation
Attribution Case Study - Ad-Tech Presentation
 
CloroxAR08_Complete
CloroxAR08_CompleteCloroxAR08_Complete
CloroxAR08_Complete
 
Attribution Case Study (Detailed) | Encore Media Metrics
Attribution Case Study (Detailed) | Encore Media MetricsAttribution Case Study (Detailed) | Encore Media Metrics
Attribution Case Study (Detailed) | Encore Media Metrics
 
Loopnet Q4 2009 Insight Report 1 16 09
Loopnet Q4 2009 Insight Report 1 16 09Loopnet Q4 2009 Insight Report 1 16 09
Loopnet Q4 2009 Insight Report 1 16 09
 
southwest airline ar03
southwest airline ar03southwest airline ar03
southwest airline ar03
 
Arvinmeritor2001 Annua lReport
Arvinmeritor2001 Annua lReportArvinmeritor2001 Annua lReport
Arvinmeritor2001 Annua lReport
 
telephone data systems USM2007AnnualReport
telephone data systems  USM2007AnnualReporttelephone data systems  USM2007AnnualReport
telephone data systems USM2007AnnualReport
 
Big_Lots_AR2004
Big_Lots_AR2004Big_Lots_AR2004
Big_Lots_AR2004
 
Nexus Spring 2001
Nexus Spring 2001Nexus Spring 2001
Nexus Spring 2001
 
williams 2008 AR Final
williams 2008 AR Finalwilliams 2008 AR Final
williams 2008 AR Final
 
southwest airline ar01
southwest airline ar01southwest airline ar01
southwest airline ar01
 
whirlpool Annual Report2005
whirlpool Annual Report2005whirlpool Annual Report2005
whirlpool Annual Report2005
 
Fairborne Energy Corporate Presentation
Fairborne Energy Corporate PresentationFairborne Energy Corporate Presentation
Fairborne Energy Corporate Presentation
 
ns_2008_Annual_Report
ns_2008_Annual_Reportns_2008_Annual_Report
ns_2008_Annual_Report
 
Loopnet Report Year End 2009 Sacramento
Loopnet Report Year End 2009 SacramentoLoopnet Report Year End 2009 Sacramento
Loopnet Report Year End 2009 Sacramento
 
southwest airline ar02
southwest airline ar02southwest airline ar02
southwest airline ar02
 

Viewers also liked

Colliers na office_2014_q3_final
Colliers na office_2014_q3_finalColliers na office_2014_q3_final
Colliers na office_2014_q3_finalChris Fyvie
 
Q4 2014 San Francisco Office Report
Q4 2014 San Francisco Office ReportQ4 2014 San Francisco Office Report
Q4 2014 San Francisco Office ReportCoy Davidson
 
Colliers na office_2014_q3_final
Colliers na office_2014_q3_finalColliers na office_2014_q3_final
Colliers na office_2014_q3_finalChris Fyvie
 
The Colliers International Advantage
The Colliers International AdvantageThe Colliers International Advantage
The Colliers International AdvantageCoy Davidson
 
Colliers International Vietnam | Retail Services Capabilities Statement 2015
Colliers International Vietnam | Retail Services Capabilities Statement 2015Colliers International Vietnam | Retail Services Capabilities Statement 2015
Colliers International Vietnam | Retail Services Capabilities Statement 2015Colliers International | Vietnam
 
Colliers toronto office leasing market report 2014
Colliers toronto office leasing market report 2014Colliers toronto office leasing market report 2014
Colliers toronto office leasing market report 2014Chris Fyvie
 

Viewers also liked (7)

Colliers na office_2014_q3_final
Colliers na office_2014_q3_finalColliers na office_2014_q3_final
Colliers na office_2014_q3_final
 
Colliers
Colliers Colliers
Colliers
 
Q4 2014 San Francisco Office Report
Q4 2014 San Francisco Office ReportQ4 2014 San Francisco Office Report
Q4 2014 San Francisco Office Report
 
Colliers na office_2014_q3_final
Colliers na office_2014_q3_finalColliers na office_2014_q3_final
Colliers na office_2014_q3_final
 
The Colliers International Advantage
The Colliers International AdvantageThe Colliers International Advantage
The Colliers International Advantage
 
Colliers International Vietnam | Retail Services Capabilities Statement 2015
Colliers International Vietnam | Retail Services Capabilities Statement 2015Colliers International Vietnam | Retail Services Capabilities Statement 2015
Colliers International Vietnam | Retail Services Capabilities Statement 2015
 
Colliers toronto office leasing market report 2014
Colliers toronto office leasing market report 2014Colliers toronto office leasing market report 2014
Colliers toronto office leasing market report 2014
 

Similar to Downtown office market dashboard 2011 q1

Brazil Market Managed Services Trend
Brazil Market Managed Services TrendBrazil Market Managed Services Trend
Brazil Market Managed Services TrendMichel Abranches
 
Current Financial Situation in Latvia
Current Financial Situation in LatviaCurrent Financial Situation in Latvia
Current Financial Situation in LatviaRoberts Zīle
 
Stormwater Financing Mechanisms- Charlotte Katzenmoyer
Stormwater Financing Mechanisms- Charlotte KatzenmoyerStormwater Financing Mechanisms- Charlotte Katzenmoyer
Stormwater Financing Mechanisms- Charlotte KatzenmoyerCleanH2O
 
Loopnet Local Quarterly Insight Report Q1, 2009
Loopnet Local Quarterly Insight Report Q1, 2009Loopnet Local Quarterly Insight Report Q1, 2009
Loopnet Local Quarterly Insight Report Q1, 2009aporrazzo
 
Q4 11 office midtown - yonge-bloor dashboard
Q4 11 office midtown - yonge-bloor dashboardQ4 11 office midtown - yonge-bloor dashboard
Q4 11 office midtown - yonge-bloor dashboardChris Fyvie
 
Procurement Spending in the DC Region
Procurement Spending in the DC RegionProcurement Spending in the DC Region
Procurement Spending in the DC Regionkottmeier
 
Conneu 2011-welcomeand intro
Conneu 2011-welcomeand introConneu 2011-welcomeand intro
Conneu 2011-welcomeand introRob Blaauboer
 
Puget Sound Q4 2012 Office Market
Puget Sound Q4 2012 Office MarketPuget Sound Q4 2012 Office Market
Puget Sound Q4 2012 Office MarketGilWhiteCRE
 
2 Q11 Market Beat Industrial Lv
2 Q11 Market Beat Industrial Lv2 Q11 Market Beat Industrial Lv
2 Q11 Market Beat Industrial LvJessica Parrish
 
We are alive! Now what? by Kārlis Cērbulis
We are alive! Now what? by Kārlis CērbulisWe are alive! Now what? by Kārlis Cērbulis
We are alive! Now what? by Kārlis CērbulisRoberts Zīle
 
stryker 0D01F279-9F33-4E3E-A708-FE2047EF5E47_Stryker08AR.Single
stryker 0D01F279-9F33-4E3E-A708-FE2047EF5E47_Stryker08AR.Singlestryker 0D01F279-9F33-4E3E-A708-FE2047EF5E47_Stryker08AR.Single
stryker 0D01F279-9F33-4E3E-A708-FE2047EF5E47_Stryker08AR.Singlefinance34
 
qualcomm annual reports 2004
qualcomm annual reports 2004qualcomm annual reports 2004
qualcomm annual reports 2004finance43
 
Finalista Demo Day Startup Farm SP - 2a edição
Finalista Demo Day Startup Farm SP - 2a ediçãoFinalista Demo Day Startup Farm SP - 2a edição
Finalista Demo Day Startup Farm SP - 2a ediçãoStartup Farm
 

Similar to Downtown office market dashboard 2011 q1 (20)

Brazil Market Managed Services Trend
Brazil Market Managed Services TrendBrazil Market Managed Services Trend
Brazil Market Managed Services Trend
 
Current Financial Situation in Latvia
Current Financial Situation in LatviaCurrent Financial Situation in Latvia
Current Financial Situation in Latvia
 
MHK07/03/07
MHK07/03/07MHK07/03/07
MHK07/03/07
 
MHK07/03/07
MHK07/03/07MHK07/03/07
MHK07/03/07
 
Stormwater Financing Mechanisms- Charlotte Katzenmoyer
Stormwater Financing Mechanisms- Charlotte KatzenmoyerStormwater Financing Mechanisms- Charlotte Katzenmoyer
Stormwater Financing Mechanisms- Charlotte Katzenmoyer
 
Corporate Presentation
Corporate PresentationCorporate Presentation
Corporate Presentation
 
Loopnet Local Quarterly Insight Report Q1, 2009
Loopnet Local Quarterly Insight Report Q1, 2009Loopnet Local Quarterly Insight Report Q1, 2009
Loopnet Local Quarterly Insight Report Q1, 2009
 
Q4 11 office midtown - yonge-bloor dashboard
Q4 11 office midtown - yonge-bloor dashboardQ4 11 office midtown - yonge-bloor dashboard
Q4 11 office midtown - yonge-bloor dashboard
 
Procurement Spending in the DC Region
Procurement Spending in the DC RegionProcurement Spending in the DC Region
Procurement Spending in the DC Region
 
Conneu 2011-welcomeand intro
Conneu 2011-welcomeand introConneu 2011-welcomeand intro
Conneu 2011-welcomeand intro
 
Puget Sound Q4 2012 Office Market
Puget Sound Q4 2012 Office MarketPuget Sound Q4 2012 Office Market
Puget Sound Q4 2012 Office Market
 
Q32009 Austin Real Estate Market Report
Q32009 Austin Real Estate Market ReportQ32009 Austin Real Estate Market Report
Q32009 Austin Real Estate Market Report
 
P& L(1)
P& L(1)P& L(1)
P& L(1)
 
2 Q11 Market Beat Industrial Lv
2 Q11 Market Beat Industrial Lv2 Q11 Market Beat Industrial Lv
2 Q11 Market Beat Industrial Lv
 
snapshot 489 house prices
snapshot 489   house pricessnapshot 489   house prices
snapshot 489 house prices
 
We are alive! Now what? by Kārlis Cērbulis
We are alive! Now what? by Kārlis CērbulisWe are alive! Now what? by Kārlis Cērbulis
We are alive! Now what? by Kārlis Cērbulis
 
stryker 0D01F279-9F33-4E3E-A708-FE2047EF5E47_Stryker08AR.Single
stryker 0D01F279-9F33-4E3E-A708-FE2047EF5E47_Stryker08AR.Singlestryker 0D01F279-9F33-4E3E-A708-FE2047EF5E47_Stryker08AR.Single
stryker 0D01F279-9F33-4E3E-A708-FE2047EF5E47_Stryker08AR.Single
 
qualcomm annual reports 2004
qualcomm annual reports 2004qualcomm annual reports 2004
qualcomm annual reports 2004
 
Finalista Demo Day Startup Farm SP - 2a edição
Finalista Demo Day Startup Farm SP - 2a ediçãoFinalista Demo Day Startup Farm SP - 2a edição
Finalista Demo Day Startup Farm SP - 2a edição
 
Re Insights Graphs Oct
Re Insights Graphs OctRe Insights Graphs Oct
Re Insights Graphs Oct
 

More from Chris Fyvie

Colliers canada national market snapshot 2020 q4
Colliers canada national market snapshot 2020 q4Colliers canada national market snapshot 2020 q4
Colliers canada national market snapshot 2020 q4Chris Fyvie
 
Colliers GTA Office Statistics Q1 2017
Colliers GTA Office Statistics Q1 2017Colliers GTA Office Statistics Q1 2017
Colliers GTA Office Statistics Q1 2017Chris Fyvie
 
Downtown toronto office survey package august 25 2016
Downtown toronto office survey package   august 25 2016Downtown toronto office survey package   august 25 2016
Downtown toronto office survey package august 25 2016Chris Fyvie
 
WTF Properties - Toronto Office Space July availability report
WTF Properties - Toronto Office Space July availability reportWTF Properties - Toronto Office Space July availability report
WTF Properties - Toronto Office Space July availability reportChris Fyvie
 
Plug in to peak productivity - Colliers Spark Report
Plug in to peak productivity - Colliers Spark ReportPlug in to peak productivity - Colliers Spark Report
Plug in to peak productivity - Colliers Spark ReportChris Fyvie
 
Lennard commercial office space downtown toronto
Lennard commercial office space downtown torontoLennard commercial office space downtown toronto
Lennard commercial office space downtown torontoChris Fyvie
 
Q1 2016 cresa market report
Q1 2016 cresa market reportQ1 2016 cresa market report
Q1 2016 cresa market reportChris Fyvie
 
2016 office condo report
2016 office condo report2016 office condo report
2016 office condo reportChris Fyvie
 
Toronto office market report q1 2016
Toronto office market report q1 2016Toronto office market report q1 2016
Toronto office market report q1 2016Chris Fyvie
 
Colliers Gta office market statistics q1 2016
Colliers Gta office market statistics q1 2016Colliers Gta office market statistics q1 2016
Colliers Gta office market statistics q1 2016Chris Fyvie
 
Cadillac Fairview Office Vacancy - May 2016
Cadillac Fairview Office Vacancy - May 2016Cadillac Fairview Office Vacancy - May 2016
Cadillac Fairview Office Vacancy - May 2016Chris Fyvie
 
Security deposit insecurity - Daoust Vukovich LLP
Security deposit insecurity - Daoust Vukovich LLPSecurity deposit insecurity - Daoust Vukovich LLP
Security deposit insecurity - Daoust Vukovich LLPChris Fyvie
 
Costs to Furnish Toronto Office Space
Costs to Furnish Toronto Office SpaceCosts to Furnish Toronto Office Space
Costs to Furnish Toronto Office SpaceChris Fyvie
 
Audio Visual Construction Costs
Audio Visual Construction CostsAudio Visual Construction Costs
Audio Visual Construction CostsChris Fyvie
 
Office Space Construction Costs
Office Space Construction CostsOffice Space Construction Costs
Office Space Construction CostsChris Fyvie
 
Toronto Innovate Office Spaces
Toronto Innovate Office SpacesToronto Innovate Office Spaces
Toronto Innovate Office SpacesChris Fyvie
 
Cadillac fairview gta reports-nov_2015
Cadillac fairview   gta reports-nov_2015Cadillac fairview   gta reports-nov_2015
Cadillac fairview gta reports-nov_2015Chris Fyvie
 
Ashlar november-2015-availability-report
Ashlar november-2015-availability-reportAshlar november-2015-availability-report
Ashlar november-2015-availability-reportChris Fyvie
 
Colliers Toronto office market report 2015 q3
Colliers Toronto office market report 2015 q3Colliers Toronto office market report 2015 q3
Colliers Toronto office market report 2015 q3Chris Fyvie
 
#Toronto Businesses now demanding their offices be close to accessible, rapid...
#Toronto Businesses now demanding their offices be close to accessible, rapid...#Toronto Businesses now demanding their offices be close to accessible, rapid...
#Toronto Businesses now demanding their offices be close to accessible, rapid...Chris Fyvie
 

More from Chris Fyvie (20)

Colliers canada national market snapshot 2020 q4
Colliers canada national market snapshot 2020 q4Colliers canada national market snapshot 2020 q4
Colliers canada national market snapshot 2020 q4
 
Colliers GTA Office Statistics Q1 2017
Colliers GTA Office Statistics Q1 2017Colliers GTA Office Statistics Q1 2017
Colliers GTA Office Statistics Q1 2017
 
Downtown toronto office survey package august 25 2016
Downtown toronto office survey package   august 25 2016Downtown toronto office survey package   august 25 2016
Downtown toronto office survey package august 25 2016
 
WTF Properties - Toronto Office Space July availability report
WTF Properties - Toronto Office Space July availability reportWTF Properties - Toronto Office Space July availability report
WTF Properties - Toronto Office Space July availability report
 
Plug in to peak productivity - Colliers Spark Report
Plug in to peak productivity - Colliers Spark ReportPlug in to peak productivity - Colliers Spark Report
Plug in to peak productivity - Colliers Spark Report
 
Lennard commercial office space downtown toronto
Lennard commercial office space downtown torontoLennard commercial office space downtown toronto
Lennard commercial office space downtown toronto
 
Q1 2016 cresa market report
Q1 2016 cresa market reportQ1 2016 cresa market report
Q1 2016 cresa market report
 
2016 office condo report
2016 office condo report2016 office condo report
2016 office condo report
 
Toronto office market report q1 2016
Toronto office market report q1 2016Toronto office market report q1 2016
Toronto office market report q1 2016
 
Colliers Gta office market statistics q1 2016
Colliers Gta office market statistics q1 2016Colliers Gta office market statistics q1 2016
Colliers Gta office market statistics q1 2016
 
Cadillac Fairview Office Vacancy - May 2016
Cadillac Fairview Office Vacancy - May 2016Cadillac Fairview Office Vacancy - May 2016
Cadillac Fairview Office Vacancy - May 2016
 
Security deposit insecurity - Daoust Vukovich LLP
Security deposit insecurity - Daoust Vukovich LLPSecurity deposit insecurity - Daoust Vukovich LLP
Security deposit insecurity - Daoust Vukovich LLP
 
Costs to Furnish Toronto Office Space
Costs to Furnish Toronto Office SpaceCosts to Furnish Toronto Office Space
Costs to Furnish Toronto Office Space
 
Audio Visual Construction Costs
Audio Visual Construction CostsAudio Visual Construction Costs
Audio Visual Construction Costs
 
Office Space Construction Costs
Office Space Construction CostsOffice Space Construction Costs
Office Space Construction Costs
 
Toronto Innovate Office Spaces
Toronto Innovate Office SpacesToronto Innovate Office Spaces
Toronto Innovate Office Spaces
 
Cadillac fairview gta reports-nov_2015
Cadillac fairview   gta reports-nov_2015Cadillac fairview   gta reports-nov_2015
Cadillac fairview gta reports-nov_2015
 
Ashlar november-2015-availability-report
Ashlar november-2015-availability-reportAshlar november-2015-availability-report
Ashlar november-2015-availability-report
 
Colliers Toronto office market report 2015 q3
Colliers Toronto office market report 2015 q3Colliers Toronto office market report 2015 q3
Colliers Toronto office market report 2015 q3
 
#Toronto Businesses now demanding their offices be close to accessible, rapid...
#Toronto Businesses now demanding their offices be close to accessible, rapid...#Toronto Businesses now demanding their offices be close to accessible, rapid...
#Toronto Businesses now demanding their offices be close to accessible, rapid...
 

Downtown office market dashboard 2011 q1

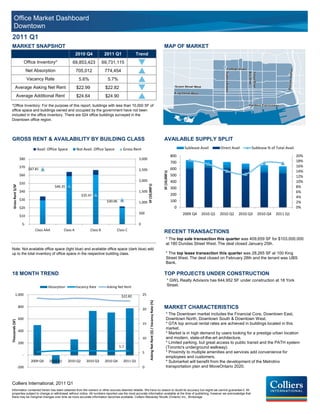
  • 1. Office Market Dashboard Downtown 2011 Q1 MARKET SNAPSHOT MAP OF MARKET 2010 Q4 2011 Q1 Trend Office Inventory* 69,853,423 69,731,115 q Net Absorption 705,012 774,454 p Vacancy Rate 5.6% 5.7% p Average Asking Net Rent $22.99 $22.82 q Average Additional Rent $24.64 $24.90 p *Office Inventory: For the purpose of this report, buildings with less than 10,000 SF of office space and buildings owned and occupied by the government have not been included in the office inventory. There are 524 office buildings surveyed in the Downtown office region. GROSS RENT & AVAILABILITY BY BUILDING CLASS AVAILABLE SUPPLY SPLIT Avail. Office Space Not Avail. Office Space Gross Rent Sublease Avail Direct Avail Sublease % of Total Avail. 800 20% $80 3,000 700 18% $70 16% $67.81 2,500 600 14% SF (10,000's) $60 500 12% 2,000 400 10% $50 SF (10,000's) $46.35 8% Gross Rent $/SF 300 $40 1,500 6% $35.47 200 4% $30 $30.06 100 1,000 2% $20 0 0% 500 2009 Q4 2010 Q1 2010 Q2 2010 Q3 2010 Q4 2011 Q1 $10 $- 0 Class AAA Class A Class B Class C RECENT TRANSACTIONS * The top sale transaction this quarter was 409,659 SF for $103,000,000 at 180 Dundas Street West. The deal closed January 25th. Note: Not available office space (light blue) and available office space (dark blue) add up to the total inventory of office space in the respective building class. * The top lease transaction this quarter was 28,265 SF at 100 King Street West. The deal closed on February 28th and the tenant was UBS Bank. 18 MONTH TREND TOP PROJECTS UNDER CONSTRUCTION * GWL Realty Advisors has 644,952 SF under construction at 18 York Absorption Vacancy Rate Asking Net Rent Street. 1,000 $22.82 25 Asking Net Rent ($) / Vacancy Rate (%) 800 MARKET CHARACTERISTICS 20 * The Downtown market includes the Financial Core, Downtown East, 600 Downtown North, Downtown South & Downtown West. Thousands (SF) 15 * GTA top annual rental rates are achieved in buildings located in this market. 400 * Market is in high demand by users looking for a prestige urban location 10 and modern, state-of-the-art architecture. 200 * Limited parking, but great access to public transit and the PATH system 5.7 (Toronto's underground walkway). 5 * Proximity to multiple amenities and services add convenience for - employees and customers. 2009 Q4 2010 Q1 2010 Q2 2010 Q3 2010 Q4 2011 Q1 * Submarket will benefit from the development of the Metrolinx -200 0 transportation plan and MoveOntario 2020. Colliers International, 2011 Q1 Information contained herein has been obtained from the owners or other sources deemed reliable. We have no reason to doubt its accuracy but regret we cannot guarantee it. All properties subject to change or withdrawal without notice. All numbers reported use the most accurate information available at the time of publishing, however we acknowledge that there may be marginal changes over time as more accurate information becomes available. Colliers Macaulay Nicolls (Ontario) Inc., Brokerage.