Logistics Market Snapshot Oct 2011

Last week, U.S. lawmakers approved the long-awaited free trade agreements with Colombia, Panama, and South Korea. The FTA’s will take effect in early 2012 and are expected to increase the U.S. GDP by $12 billion. · The U.S. Freight Index jumped to its highest level in more than three years in September, up 7.5% on the same month a year ago. · North American railcar owners put 11,087 more units (previously in storage) “back to work” in September, the largest reduction of the idled car fleet since March. · In FY11 the Port of Savannah became the second-biggest container export port in the U.S. on a tonnage basis. Savannah, now 2nd only to the Port of Los Angeles, handled 6.84 million tons of containerized export cargo.

Recommended
More Related Content
Viewers also liked
More from Brian Schoenbaechler
More from Brian Schoenbaechler (10)
Recently uploaded
Recently uploaded (20)
Logistics Market Snapshot Oct 2011
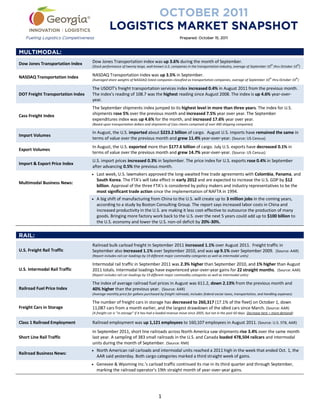
- 1. OCTOBER 2011 LOGISTICS MARKET SNAPSHOT Fueling Logistics Competiveness Prepared: October 15, 2011 MULTIMODAL: Dow Jones Transportation Index Dow Jones Transportation index was up 3.6% during the month of September. th th (Stock performance of twenty large, well-known U.S. companies in the transportation industry, average of September 10 thru October 10 ) NASDAQ Transportation Index NASDAQ Transportation Index was up 3.5% in September. th th (Averaged share weights of NASDAQ-listed companies classified as transportation companies, average of September 10 thru October 10 ) The USDOT's freight transportation services index increased 0.4% in August 2011 from the previous month. DOT Freight Transportation Index The index’s reading of 108.7 was the highest reading since August 2008. The index is up 4.6% year-over- year. The September shipments index jumped to its highest level in more than three years. The index for U.S. Cass Freight Index shipments rose 5% over the previous month and increased 7.5% year over year. The September expenditures index was up 4.6% for the month, and increased 17.6% year over year. (Based upon transportation dollars and shipments of Cass clients comprised of over 400 shipping companies) In August, the U.S. imported about $223.2 billion of cargo. August U.S. imports have remained the same in Import Volumes terms of value over the previous month and grew 11.4% year-over-year. (Source: US Census) In August, the U.S. exported more than $177.6 billion of cargo. July U.S. exports have decreased 0.1% in Export Volumes terms of value over the previous month and grew 14.7% year-over-year. (Source: US Census) U.S. import prices increased 0.3% in September. The price index for U.S. exports rose 0.4% in September Import & Export Price Index after advancing 0.5% the previous month. Last week, U.S. lawmakers approved the long-awaited free trade agreements with Colombia, Panama, and South Korea. The FTA’s will take effect in early 2012 and are expected to increase the U.S. GDP by $12 Multimodal Business News: billion. Approval of the three FTA’s is considered by policy makers and industry representatives to be the most significant trade action since the implementation of NAFTA in 1994. A big shift of manufacturing from China to the U.S. will create up to 3 million jobs in the coming years, according to a study by Boston Consulting Group. The report says increased labor costs in China and increased productivity in the U.S. are making it less cost-effective to outsource the production of many goods. Bringing more factory work back to the U.S. over the next 5 years could add up to $100 billion to the U.S. economy and lower the U.S. non-oil deficit by 20%-30%. RAIL: Railroad bulk carload freight in September 2011 increased 1.1% over August 2011. Freight traffic in U.S. Freight Rail Traffic September also increased 1.1% over September 2010, and was up 9.1% over September 2009. (Source: AAR) (Report includes rail car-loadings by 19 different major commodity categories as well as intermodal units) Intermodal rail traffic in September 2011 was 2.3% higher than September 2010, and 1% higher than August U.S. Intermodal Rail Traffic 2011 totals. Intermodal loadings have experienced year-over-year gains for 22 straight months. (Source: AAR) (Report includes rail car-loadings by 19 different major commodity categories as well as intermodal units) The index of average railroad fuel prices in August was 611.2, down 2.13% from the previous month and Railroad Fuel Price Index 40% higher than the previous year. (Source: AAR) (Average monthly price for gallons purchased by freight railroads; Includes federal excise taxes, transportation, and handling expenses) The number of freight cars in storage has decreased to 260,317 (17.1% of the fleet) on October 1, down Freight Cars in Storage 11,087 cars from a month earlier, and the largest drawdown of the idled cars since March. (Source: AAR) (A freight car is "in storage" if it has had a loaded revenue move since 2005, but not in the past 60 days. Decrease here = more demand) Class 1 Railroad Employment Railroad employment was up 1,121 employees to 160,107 employees in August 2011. (Source: U.S. STB, AAR) In September 2011, short line railroads across North America saw shipments rise 3.4% over the same month Short Line Rail Traffic last year. A sampling of 383 small railroads in the U.S. and Canada loaded 478,504 railcars and intermodal units during the month of September. (Source: RMI) North American rail carloads and intermodal units reached a 2011 high in the week that ended Oct. 1, the Railroad Business News: AAR said yesterday. Both cargo categories marked a third straight week of gains. Genesee & Wyoming Inc.'s carload traffic continued its rise in its third quarter and through September, marking the railroad operator's 19th straight month of year-over-year gains. 1
- 2. OCTOBER 2011 LOGISTICS MARKET SNAPSHOT Fueling Logistics Competiveness Prepared: October 15, 2011 TRUCKING: Over-the-Road Trucked Shipments fell 1% in September following a 1.4% decline in August. Overall trucked Over-the-Road Trucked Shipments shipments decreased 0.2% on a year-over-year basis. (From the Ceridian-UCLA Pulse of Commerce Index which is based on real-time fuel consumption data for over the road trucking) The ATA’s seasonally adjusted cargo index fell 0.2% in August after falling a revised 0.8% in July. The for-hire Trucking Volume truck tonnage index rose 5.2% year-over-year in August, following a 4.5% increase in July. The spot market for truckload freight in September rose 10% from the previous month, and was 47% higher Truckload Freight year-over-year. (Source: TransCore Freight Index) The freight rate index cost-per-mile decreased to $2.39 in October 2011, down from $2.43 in September. Freight Rate Index (This Cost Per Mile (CPM) indicator is comprised of 8 main and 65 total cost and cost influencing components, it considers complete ly, every cost related to freight transport by land) U.S. average diesel prices fell last week, to $3.72 per gallon. Last week’s average diesel price was 2.8¢ lower Diesel Prices than the previous week, and was 66¢ higher than the same week last year. Average diesel prices in the lower Atlantic states were $3.674 per gallon. (Source: U.S. DOE) (Reflects the costs and profits of the entire production and distribution chain.) Orders for heavy-duty Class 8 trucks in North America are expected to total 23,465 units in September 2011, Truck Orders a 12% increase from the previous month, and 56% higher year-over-year. (Source: FTR Associates) Surface transport-related trade between the U.S. and its NAFTA partners, Canada and Mexico, was up 18% NAFTA Trade in July compared to the same month in 2010, reaching $72.4 billion. July was the 20th consecutive month of year-over-year increases. (Source: US DOT) The trucking industry added 2,600 jobs in September. The trucking workforce increased 0.2% over the Trucking Employment previous month and rose 1% over the previous year. (Source: U.S. DOL) J.B. Hunt Transport Services posted a record net profit of $68.7 million in the third quarter. This is an Trucking Business News: increase of 32% from a year ago. The intermodal trucker’s third quarter revenue rose 19% to $1.17 billion. Fewer truckload carriers are planning to add capacity next year than had planned to do so six months ago. 73% of the carriers surveyed said they plan to add less than 5% capacity, up from 60% of carriers that planned to do the same in the second quarter. AIR FREIGHT: Global air freight in August fell 3.8% from one year ago and was down 1.3% over the previous month. North Air Cargo Traffic American air freight decreased 7% in August year-over-year. (Source: IATA) (Global air freight covers international scheduled air traffic; domestic traffic is not included. North American traffic includes only domestic freight traffic.) In July, Hartsfield-Jackson Atlanta International Airport transported 54,927 metric tons of cargo, a 2.9% Atlanta Air Cargo Traffic decrease since June and a 1.39% decrease year-over-year. (Source: HJIA) In August, average international air cargo prices rose 0.4% from the previous month, the first monthly increase since April. Average air freight rates were down 10.1% year-over-year, the tenth consecutive month Air Freight Price Index of year-over-year decline. (Source: JOC) (The Drewry Air Freight Price Index is based on the average of rates ($US per kg) for cargoes of 100+kg to 1,000+kg cargoes f rom Shanghai to London, Moscow, Prague, New York, and Los Angeles.) Jet Fuel Prices As of October 7, 2011, the global average jet fuel price was $122.20 per barrel; down 5.9% from the previous month, and 27.5% higher year-over-year. (Source: IATA) (The weekly index and price data shows the global average price paid at the refinery for aviation jet fuel) Qatar Airways is launching scheduled freighter services to Atlanta, Houston, and Toronto in early Air Freight Business News: November. The 777 freighter flights between Qatar and the three new North American locations will be routed through the Luxembourg hub of Cargolux. The TSA will not meet its December 31 deadline to screen all cargo on international passenger flights. The Agency says that the deadline was “too ambitious,” but they will soon have screening agreements with nations that ship more than 90% of air cargo to the U.S. 2
- 3. OCTOBER 2011 LOGISTICS MARKET SNAPSHOT Fueling Logistics Competiveness Prepared: October 15, 2011 OCEAN FREIGHT: Import shipment volume, in TEUs, at U.S. ports decreased 6.73% in September from the previous month and Import Volumes showed a similar decrease of 4.52% from the previous year. The total number of shipments in September decreased nearly 9% from August while showing a decrease of 2.31% from September 2010. (Source: Zepol) th Container rates for the week of October 10 fell 2.3% to $1,486 per FEU. The benchmark container rate was 35.4% lower than the $2,300 per FEU rate in the same week last year, and 30% below the $2,119 per FEU Container Rates high for 2011 in early January. (Source: JOC & Drewry Inc.) (Based on Drewry Shipping Consultants' research and derived from shipping rates from Hong Kong to Los Angeles. The rate is based on a full 40-foot container load or FEU, excluding terminal-handling charges in Hong Kong.) The composite index of spot container freight rates fell 3% during the week of October 13th to 1462.37. World Container Index Containerized freight rates in October are down 11.6% from the previous month’s rates. (Source: Drewry & Cleartrade Exchange) (The WCI reports individual market prices for 11 major East-West container shipping routes between Asia, North America, and Europe.) th The September 30 SCFI rate was $973.73 per FEU; down 1.8% from the previous week, and nearly 25% Shanghai Containerized lower year-over-year. The spot rate for shipments to the U.S. East Coast was $3,053 per FEU, down 2.3% Freight Index from the previous week. (Source: JOC) (The Shanghai Containerized Freight Index is a weekly reported average export spot rate from Shanghai for 15 different trade lanes.) The Baltic Dry Index increased 12.1% in September, ending at 1,886. The BDI has increased 12.8% for the Ocean Bulk Freight Rates first half of October and is currently at its highest point in 2011, up 104% from its February low. (Source: The Baltic Exchange) (The Baltic Dry Index is an index that tracks and averages worldwide international shipping prices of various dry bulk cargoes.) Average bunker fuel price was down 0.3% or $25/MT to $804.36/MT in September 2011. By mid-September, Bunker Fuel Prices bunker fuel prices were up 1.6% to $817.64/MT. (Source: Bunker Index) (The Bunker Index is the average global bunker fuel price from individual ports; measure in $US per MT or megaton) The Port of Savannah became the second-biggest container export port in the U.S. on a tonnage basis. Port of Savannah During FY2011, Savannah handled 6.84 million tons of containerized export cargo, second only to the Port of Los Angeles and ahead of Long Beach. (Source: U.S. Department of Commerce) In FY2011, the Port of Brunswick’s volume for auto and machinery increased 51%, compared to the U.S. rd th total growth of 16%. The port is now the 3 busiest U.S. port for auto imports and the 5 largest U.S. port Port of Brunswick for automobile tonnage overall. The Port of Brunswick represents 8.5% of the national total auto and machinery port movements. (Source: GPA) The Panama Canal set a new tonnage record of 322.1 million tons during FY2011, which ended on Ocean Freight Business News: September 30. This preliminary figure represents a 7.1% increase compared to the 300.8 million tons registered last year, and is 2.9% more than the previous record of 312.9 million tons in 2007. The Port of Savannah will expand its refrigerated storage capacity by 45% in order to grow poultry export business. The Georgia Ports Authority board approved a $4.75 million project last week for the construction of 20 four-story steel framed refrigerated container racks at Garden City Terminal. Savannah handled more than 40% of U.S. containerized poultry, or 1.5 billion pounds in FY2011. Ocean carriers and charter ship owners have placed orders worth $57 billion for new container vessels over the next four years, with about half of the value of orders made as the industry emerged from a slump in 2009. Maersk Line is the biggest spender with new ship commitments estimated at $6.5 billion. (Source: Alphaliner) The value of U.S. and Canadian log and lumber shipments to China in 2011 will double to $2.6 billion from last year as North American producers gain a larger share of the market. Wood Resource Quarterly reports that logs and lumber originated from the North America has grown from 4% in 2005 to roughly 18% in 2010. A.P. Moller-Maersk is selling its liquefied natural gas fleet to a joint venture between Teeday and Marubeni Corp for $1.4 billion in cash. The Danish company wishes to focus on container shipping and terminal operations instead. The LNG fleet consists of six LNG ships and a 26% stake in two further vessels. Archives of these monthly snapshots are posted to: snapshot.georgialogistics.org For more information about the Logistics Market Snapshot or the many other resources and activities of the Georgia Center of Innovation for Logistics please contact: Page Siplon, Executive Director – psiplon@georgia.org – 912.966.7867 3
- 4. OCTOBER 2011 LOGISTICS MARKET SNAPSHOT Fueling Logistics Competiveness Prepared: October 15, 2011 WAREHOUSING & DISTRIBUTION: The U.S. average industrial vacancy rate was 9.2% during Q3 2011, down from 9.3% in the previous quarter. Industrial Vacancy Overall vacancy was 11% in the South and 15.3% in Atlanta during the third quarter. (Source: Cassidy Turley) In Q3 2011, warehouse and distribution rental rates in the US averaged $5.13 per square foot. Rental rates Warehouse Rent Rates for warehouse space averaged $4.47/square foot in the South and $3.47/square foot in Atlanta. (Source: Cassidy Turley) Net absorption in the US during Q3 2011 totaled +24.7 million square feet. Absorption in the South led the Industrial Absorption regions with +13.8 million square feet, more than doubling the industrial absorption of any other region. (Source: Cassidy Turley) (Absorption is the net change in occupied space between two points in time. Positive absorption means that previously unoccupied space is being occupied.) The National PMI increased 1 point to 51.6 in September 2011. The September PMI has indicated expansion in the manufacturing sector for the 26th consecutive month. New orders remained the same at 49.6 and Purchasing Managers Index production increased 2.6 points to 51.2. (Source: ISM) (The PMI combines data on new orders, inventory, production, supplier deliveries, and employment. A reading above 50 indicates that the manufacturing economy is generally expanding.) Georgia’s PMI fell 9.4 points to 48.7 in September, more than offsetting the 7.4 points gained in August. Purchasing Managers Index New orders in Georgia were down 6.9 points to 45 and production fell 16.3 points to 46.7. in Georgia (Source: Kennesaw State University) (The PMI combines data on new orders, inventory, production, supplier deliveries, and employment. A reading above 50 indicates that the manufacturing economy is generally expanding.) Lowe’s has broken ground on a new $125 million distribution center in Rome, Georgia. The 1.4 million- square-foot facility will be located on 140 acres, and will bring 600 jobs to the region within three years. W&D Business News: The new distribution center joins three other warehouse facilities in Georgia, in Valdosta, Palmetto, and Savannah. U.S. MARKET: The U.S. GDP increased 1.3% in the second quarter 2011 according to the third estimate released by the Gross Domestic Product BEA. (Source: US BEA) The U.S. trade deficit remained the same in August at $45.6 billion. Exports decreased 0.1% to $177.6 billion U.S. Trade Deficit and imports remained the same at $223.2 billion. (Source: US DOC & Census Bureau) Increased to 45.4% in September 2011 from 45.2% in August 2011. (Source: The Conference Board) Consumer Confidence (The consumer confidence index is based on a monthly survey of 5,000 U.S. households. It is designed to gauge the financial health, spending power, and confidence of the average U.S. consumer.) The unemployment rate in America remained flat at 9.1% in September 2011. Approximately 103,000 jobs Unemployment Rate were created in September. July and August job gains were revised upward by 99,000 jobs. (Source: US DOL) The Leading Economic Index for the U.S. increased 0.3% in August to 116.2 (2004=100), following a 0.6% Leading Economic Index increase in July and a 0.3% increase in June. (Source: Conference Board) (The LEI is a composite of 10 economic indicators that together create an analytic system designed to signal peaks and troughs in the business cycle. The LEI reveals patterns in economic data in a clearer and more convincing manner than any individual component alone.) Retail and food service sales rose in September to $395.5 Billion, up 1.1% from the previous month, and up Retail Sales 7.9% from September 2010. Non-store retailer sales were up 10.1% from last year. (Source: US Census) Total combined sales and manufacturing shipments totaled nearly $1.201 Trillion in August 2011, up 0.3% Manufacturing & Trade Sales from July and up 11.8% from the previous year. (Source: US Census) Total value of inventory on hand is estimated at $1.536 Trillion in August 2011, up 0.5% from July and up Manufacturing & Trade Inventory 10.5% from August 2010. (Source: US Census) In August, housing starts decreased 5% to an annual rate of 571,000 units. Building permits (an indicator of Housing Starts future housing starts) increased 3.2% to an annual rate of 601,000. 4