SlideShare a Scribd company logo
1 of 22
In this presentation we fully examine two great
  Free online Graph making applications.
http://nces.ed.gov/nceskids/createagraph/default.aspx
Step 1: Click to choose the Graph Type
For our example, we will
Shoe Length   Nbr of People   draw our “Shoe Length
21 cm         1
                              Survey” data as a
                              Bar Graph.
24 cm         3
25 cm         3
26 cm         2               In this survey, each
27 cm         8
                              student measured the
                              length of their shoe.
28 cm         5
29 cm         1                We then gathered
30 cm         1               together all the results
31 cm         1               into the frequency table
                              shown on the left.
For our example, we are
drawing the Shoe Length
data from our class as a
Bar Graph.
First we set up the design
for our bar chart graph on
the “Design” Tab.
 We then work our way
down through the other
Tabs.

(Continued next Slide)
It is important to set the
“Grid Lines” to a number
which will enable us later
on to have a vertical scale
in ones, rather than in lots
of in between decimal
values on the y-axis.
For our nine items, the
closest grid lines available
in the drop down menu
is 11.
Next we use the “Data”
tab to enter the Graph
Title, and the text labels
for the horizontal x-axis,
and the vertical y-axis.

We then choose our
bars colour, and enter
in all of our data items.

(Continued next slide).
Note that the maximum
and minimum values we
have set are 0 and 10,
because we set eleven
grid lines back on the
Design screen tab.

0 to 10 is eleven values,
(count them on your
fingers), and this means
with eleven grid lines we
should get a vertical scale
for our completed graph
which goes in ones.
On the “Labels” tab we
have set "show labels" to
"No", which means there
will not be any numbers
place above individual
bars saying how high they
each are.

If you like having each bar
labeled at the top, with its
height value, then set this
"labels" option to "Yes".
We are now ready to check
how our completed Graph
will look, which we do by
clicking on the "Preview"
tab.
If we need to go back and
change anything, we simply
go click on the tab(s) where
we need to make changes.
We then click the bottom of
screen “Update” button, and
try the “Preview” tab again.
Our Final Step is to
Print or Save our
completed Graph.
We can even email our
finished graph to our
Instructor.
Click on “Download”
which takes us to the
screen shown on the
next slide.
There are several different
ways to save our graph,
which we access by clicking
the drop down menu button.
The size of our saved JPG
picture was 600x453 pixels
in size, and it was of very
good image quality.

After one save, we can also
re-save into another format
if we want to.
This is our completed and saved Bar Chart for the Shoe Length Survey.
http://www.chartgo.com/
We will now graph the “Shoe
Shoe Length   Nbr of People   Length Survey” results using
21 cm         1               the “Chart Go” site at :
24 cm         3
25 cm         3
                              http://www.chartgo.com/
26 cm         2               At this website, we receive an
27 cm         8               opening screen, where we can
28 cm         5               select our graph type and set
29 cm         1               up all of its data and labeling.
30 cm         1
31 cm         1               (See next slide for full details)
After we click the
“Create Chart” button
we get our graph.
If we click on “Modify
this Chart” we can go
back and redo items
on the data entry
opening screen.
If we right click with
our mouse on the
graph, we can do a
“Save As” and save a
picture of our graph.
This is our completed and saved Bar Chart for the Shoe Length Survey.
http://nces.ed.gov/nceskids/createagraph/default.aspx


                                We can also make Pie Charts
Car Colour      Nbr of Cars     and Line Graphs with the
Red             8               "Create a Graph" Application.
Silver          15
Black           24
                                Here is the frequency table for
White           18              a Car Park Survey we carried
Blue            6               out recently.

                                (Graph on Next Slide)
We
http://www.chartgo.com

               We can also make
               Pie Charts and Line
               Graphs with the
               "Chart Go" free web
               online application.

               Here is the Car Park
               pie chart as made in
               “Chart Go”.
http://passyworldofmathematics.com/

More Related Content

Viewers also liked

Questionnaire analysis
Questionnaire analysisQuestionnaire analysis
Questionnaire analysisdaniellebridge
 
Describing graph, chart and diagram
Describing graph, chart and diagramDescribing graph, chart and diagram
Describing graph, chart and diagramMusfera Nara Vadia
 
Mathematics for Grade 5, Topic: Pie Graph
Mathematics for Grade 5, Topic: Pie GraphMathematics for Grade 5, Topic: Pie Graph
Mathematics for Grade 5, Topic: Pie GraphDepartment of Education
 
Types of graphs
Types of graphsTypes of graphs
Types of graphsbweldon
 
I Can't Teach That!
I Can't Teach That!I Can't Teach That!
I Can't Teach That!mrrobbo
 
Liquid Skills: how the world of learning is changing
Liquid Skills: how the world of learning is changingLiquid Skills: how the world of learning is changing
Liquid Skills: how the world of learning is changingForesight Factory
 

Viewers also liked (11)

Intro to the line graph
Intro to the line graphIntro to the line graph
Intro to the line graph
 
Intro to the bar graph
Intro to the bar graphIntro to the bar graph
Intro to the bar graph
 
Questionnaire analysis
Questionnaire analysisQuestionnaire analysis
Questionnaire analysis
 
Describing graph, chart and diagram
Describing graph, chart and diagramDescribing graph, chart and diagram
Describing graph, chart and diagram
 
Mathematics for Grade 5, Topic: Pie Graph
Mathematics for Grade 5, Topic: Pie GraphMathematics for Grade 5, Topic: Pie Graph
Mathematics for Grade 5, Topic: Pie Graph
 
02graphing
02graphing02graphing
02graphing
 
Survey and Graph Information
Survey and Graph InformationSurvey and Graph Information
Survey and Graph Information
 
Types of graphs
Types of graphsTypes of graphs
Types of graphs
 
I Can't Teach That!
I Can't Teach That!I Can't Teach That!
I Can't Teach That!
 
Liquid Skills: how the world of learning is changing
Liquid Skills: how the world of learning is changingLiquid Skills: how the world of learning is changing
Liquid Skills: how the world of learning is changing
 
Slideshare ppt
Slideshare pptSlideshare ppt
Slideshare ppt
 

More from Passy World

Why Exponents are Important
Why Exponents are ImportantWhy Exponents are Important
Why Exponents are ImportantPassy World
 
Equations with Fractions on Both Sides
Equations with Fractions on Both SidesEquations with Fractions on Both Sides
Equations with Fractions on Both SidesPassy World
 
Equations with Variables on Both Sides
Equations with Variables on Both SidesEquations with Variables on Both Sides
Equations with Variables on Both SidesPassy World
 
Gradient of Straight Lines
Gradient of Straight LinesGradient of Straight Lines
Gradient of Straight LinesPassy World
 
Midpoint Between Two Points
Midpoint Between Two PointsMidpoint Between Two Points
Midpoint Between Two PointsPassy World
 
Back to Back S&L Plots
Back to Back S&L PlotsBack to Back S&L Plots
Back to Back S&L PlotsPassy World
 
Symmetry and Skew
Symmetry and Skew Symmetry and Skew
Symmetry and Skew Passy World
 
Grouped Mean Median Mode
Grouped Mean Median ModeGrouped Mean Median Mode
Grouped Mean Median ModePassy World
 
The Tangent Ratio
The Tangent RatioThe Tangent Ratio
The Tangent RatioPassy World
 
The Cosine Ratio
The Cosine RatioThe Cosine Ratio
The Cosine RatioPassy World
 
Labeling Trigonometry Triangles
Labeling Trigonometry TrianglesLabeling Trigonometry Triangles
Labeling Trigonometry TrianglesPassy World
 
Similar Triangles II
Similar Triangles IISimilar Triangles II
Similar Triangles IIPassy World
 
Similar Triangles
Similar TrianglesSimilar Triangles
Similar TrianglesPassy World
 
Congruent Triangles
Congruent TrianglesCongruent Triangles
Congruent TrianglesPassy World
 
Factorising Common Factors
Factorising Common FactorsFactorising Common Factors
Factorising Common FactorsPassy World
 
Expanding Binomial Brackets
Expanding Binomial BracketsExpanding Binomial Brackets
Expanding Binomial BracketsPassy World
 
Rearranging Formulas
Rearranging FormulasRearranging Formulas
Rearranging FormulasPassy World
 

More from Passy World (20)

Why Exponents are Important
Why Exponents are ImportantWhy Exponents are Important
Why Exponents are Important
 
Exponents Rules
Exponents RulesExponents Rules
Exponents Rules
 
Equations with Fractions on Both Sides
Equations with Fractions on Both SidesEquations with Fractions on Both Sides
Equations with Fractions on Both Sides
 
Equations with Variables on Both Sides
Equations with Variables on Both SidesEquations with Variables on Both Sides
Equations with Variables on Both Sides
 
Gradient of Straight Lines
Gradient of Straight LinesGradient of Straight Lines
Gradient of Straight Lines
 
Midpoint Between Two Points
Midpoint Between Two PointsMidpoint Between Two Points
Midpoint Between Two Points
 
Linear Rules
Linear RulesLinear Rules
Linear Rules
 
Back to Back S&L Plots
Back to Back S&L PlotsBack to Back S&L Plots
Back to Back S&L Plots
 
Symmetry and Skew
Symmetry and Skew Symmetry and Skew
Symmetry and Skew
 
Grouped Mean Median Mode
Grouped Mean Median ModeGrouped Mean Median Mode
Grouped Mean Median Mode
 
The Tangent Ratio
The Tangent RatioThe Tangent Ratio
The Tangent Ratio
 
The Cosine Ratio
The Cosine RatioThe Cosine Ratio
The Cosine Ratio
 
The Sine Ratio
The Sine RatioThe Sine Ratio
The Sine Ratio
 
Labeling Trigonometry Triangles
Labeling Trigonometry TrianglesLabeling Trigonometry Triangles
Labeling Trigonometry Triangles
 
Similar Triangles II
Similar Triangles IISimilar Triangles II
Similar Triangles II
 
Similar Triangles
Similar TrianglesSimilar Triangles
Similar Triangles
 
Congruent Triangles
Congruent TrianglesCongruent Triangles
Congruent Triangles
 
Factorising Common Factors
Factorising Common FactorsFactorising Common Factors
Factorising Common Factors
 
Expanding Binomial Brackets
Expanding Binomial BracketsExpanding Binomial Brackets
Expanding Binomial Brackets
 
Rearranging Formulas
Rearranging FormulasRearranging Formulas
Rearranging Formulas
 

Recently uploaded

4.11.24 Poverty and Inequality in America.pptx
4.11.24 Poverty and Inequality in America.pptx4.11.24 Poverty and Inequality in America.pptx
4.11.24 Poverty and Inequality in America.pptxmary850239
 
Unraveling Hypertext_ Analyzing Postmodern Elements in Literature.pptx
Unraveling Hypertext_ Analyzing  Postmodern Elements in  Literature.pptxUnraveling Hypertext_ Analyzing  Postmodern Elements in  Literature.pptx
Unraveling Hypertext_ Analyzing Postmodern Elements in Literature.pptxDhatriParmar
 
Decoding the Tweet _ Practical Criticism in the Age of Hashtag.pptx
Decoding the Tweet _ Practical Criticism in the Age of Hashtag.pptxDecoding the Tweet _ Practical Criticism in the Age of Hashtag.pptx
Decoding the Tweet _ Practical Criticism in the Age of Hashtag.pptxDhatriParmar
 
4.9.24 Social Capital and Social Exclusion.pptx
4.9.24 Social Capital and Social Exclusion.pptx4.9.24 Social Capital and Social Exclusion.pptx
4.9.24 Social Capital and Social Exclusion.pptxmary850239
 
DiskStorage_BasicFileStructuresandHashing.pdf
DiskStorage_BasicFileStructuresandHashing.pdfDiskStorage_BasicFileStructuresandHashing.pdf
DiskStorage_BasicFileStructuresandHashing.pdfChristalin Nelson
 
Shark introduction Morphology and its behaviour characteristics
Shark introduction Morphology and its behaviour characteristicsShark introduction Morphology and its behaviour characteristics
Shark introduction Morphology and its behaviour characteristicsArubSultan
 
PART 1 - CHAPTER 1 - CELL THE FUNDAMENTAL UNIT OF LIFE
PART 1 - CHAPTER 1 - CELL THE FUNDAMENTAL UNIT OF LIFEPART 1 - CHAPTER 1 - CELL THE FUNDAMENTAL UNIT OF LIFE
PART 1 - CHAPTER 1 - CELL THE FUNDAMENTAL UNIT OF LIFEMISSRITIMABIOLOGYEXP
 
6 ways Samsung’s Interactive Display powered by Android changes the classroom
6 ways Samsung’s Interactive Display powered by Android changes the classroom6 ways Samsung’s Interactive Display powered by Android changes the classroom
6 ways Samsung’s Interactive Display powered by Android changes the classroomSamsung Business USA
 
CLASSIFICATION OF ANTI - CANCER DRUGS.pptx
CLASSIFICATION OF ANTI - CANCER DRUGS.pptxCLASSIFICATION OF ANTI - CANCER DRUGS.pptx
CLASSIFICATION OF ANTI - CANCER DRUGS.pptxAnupam32727
 
ClimART Action | eTwinning Project
ClimART Action    |    eTwinning ProjectClimART Action    |    eTwinning Project
ClimART Action | eTwinning Projectjordimapav
 
Blowin' in the Wind of Caste_ Bob Dylan's Song as a Catalyst for Social Justi...
Blowin' in the Wind of Caste_ Bob Dylan's Song as a Catalyst for Social Justi...Blowin' in the Wind of Caste_ Bob Dylan's Song as a Catalyst for Social Justi...
Blowin' in the Wind of Caste_ Bob Dylan's Song as a Catalyst for Social Justi...DhatriParmar
 
MS4 level being good citizen -imperative- (1) (1).pdf
MS4 level   being good citizen -imperative- (1) (1).pdfMS4 level   being good citizen -imperative- (1) (1).pdf
MS4 level being good citizen -imperative- (1) (1).pdfMr Bounab Samir
 
Mythology Quiz-4th April 2024, Quiz Club NITW
Mythology Quiz-4th April 2024, Quiz Club NITWMythology Quiz-4th April 2024, Quiz Club NITW
Mythology Quiz-4th April 2024, Quiz Club NITWQuiz Club NITW
 
Sulphonamides, mechanisms and their uses
Sulphonamides, mechanisms and their usesSulphonamides, mechanisms and their uses
Sulphonamides, mechanisms and their usesVijayaLaxmi84
 
Comparative Literature in India by Amiya dev.pptx
Comparative Literature in India by Amiya dev.pptxComparative Literature in India by Amiya dev.pptx
Comparative Literature in India by Amiya dev.pptxAvaniJani1
 
Satirical Depths - A Study of Gabriel Okara's Poem - 'You Laughed and Laughed...
Satirical Depths - A Study of Gabriel Okara's Poem - 'You Laughed and Laughed...Satirical Depths - A Study of Gabriel Okara's Poem - 'You Laughed and Laughed...
Satirical Depths - A Study of Gabriel Okara's Poem - 'You Laughed and Laughed...HetalPathak10
 
Healthy Minds, Flourishing Lives: A Philosophical Approach to Mental Health a...
Healthy Minds, Flourishing Lives: A Philosophical Approach to Mental Health a...Healthy Minds, Flourishing Lives: A Philosophical Approach to Mental Health a...
Healthy Minds, Flourishing Lives: A Philosophical Approach to Mental Health a...Osopher
 

Recently uploaded (20)

4.11.24 Poverty and Inequality in America.pptx
4.11.24 Poverty and Inequality in America.pptx4.11.24 Poverty and Inequality in America.pptx
4.11.24 Poverty and Inequality in America.pptx
 
Unraveling Hypertext_ Analyzing Postmodern Elements in Literature.pptx
Unraveling Hypertext_ Analyzing  Postmodern Elements in  Literature.pptxUnraveling Hypertext_ Analyzing  Postmodern Elements in  Literature.pptx
Unraveling Hypertext_ Analyzing Postmodern Elements in Literature.pptx
 
Decoding the Tweet _ Practical Criticism in the Age of Hashtag.pptx
Decoding the Tweet _ Practical Criticism in the Age of Hashtag.pptxDecoding the Tweet _ Practical Criticism in the Age of Hashtag.pptx
Decoding the Tweet _ Practical Criticism in the Age of Hashtag.pptx
 
4.9.24 Social Capital and Social Exclusion.pptx
4.9.24 Social Capital and Social Exclusion.pptx4.9.24 Social Capital and Social Exclusion.pptx
4.9.24 Social Capital and Social Exclusion.pptx
 
DiskStorage_BasicFileStructuresandHashing.pdf
DiskStorage_BasicFileStructuresandHashing.pdfDiskStorage_BasicFileStructuresandHashing.pdf
DiskStorage_BasicFileStructuresandHashing.pdf
 
Shark introduction Morphology and its behaviour characteristics
Shark introduction Morphology and its behaviour characteristicsShark introduction Morphology and its behaviour characteristics
Shark introduction Morphology and its behaviour characteristics
 
PART 1 - CHAPTER 1 - CELL THE FUNDAMENTAL UNIT OF LIFE
PART 1 - CHAPTER 1 - CELL THE FUNDAMENTAL UNIT OF LIFEPART 1 - CHAPTER 1 - CELL THE FUNDAMENTAL UNIT OF LIFE
PART 1 - CHAPTER 1 - CELL THE FUNDAMENTAL UNIT OF LIFE
 
prashanth updated resume 2024 for Teaching Profession
prashanth updated resume 2024 for Teaching Professionprashanth updated resume 2024 for Teaching Profession
prashanth updated resume 2024 for Teaching Profession
 
6 ways Samsung’s Interactive Display powered by Android changes the classroom
6 ways Samsung’s Interactive Display powered by Android changes the classroom6 ways Samsung’s Interactive Display powered by Android changes the classroom
6 ways Samsung’s Interactive Display powered by Android changes the classroom
 
CLASSIFICATION OF ANTI - CANCER DRUGS.pptx
CLASSIFICATION OF ANTI - CANCER DRUGS.pptxCLASSIFICATION OF ANTI - CANCER DRUGS.pptx
CLASSIFICATION OF ANTI - CANCER DRUGS.pptx
 
ClimART Action | eTwinning Project
ClimART Action    |    eTwinning ProjectClimART Action    |    eTwinning Project
ClimART Action | eTwinning Project
 
Mattingly "AI & Prompt Design" - Introduction to Machine Learning"
Mattingly "AI & Prompt Design" - Introduction to Machine Learning"Mattingly "AI & Prompt Design" - Introduction to Machine Learning"
Mattingly "AI & Prompt Design" - Introduction to Machine Learning"
 
Blowin' in the Wind of Caste_ Bob Dylan's Song as a Catalyst for Social Justi...
Blowin' in the Wind of Caste_ Bob Dylan's Song as a Catalyst for Social Justi...Blowin' in the Wind of Caste_ Bob Dylan's Song as a Catalyst for Social Justi...
Blowin' in the Wind of Caste_ Bob Dylan's Song as a Catalyst for Social Justi...
 
MS4 level being good citizen -imperative- (1) (1).pdf
MS4 level   being good citizen -imperative- (1) (1).pdfMS4 level   being good citizen -imperative- (1) (1).pdf
MS4 level being good citizen -imperative- (1) (1).pdf
 
Mythology Quiz-4th April 2024, Quiz Club NITW
Mythology Quiz-4th April 2024, Quiz Club NITWMythology Quiz-4th April 2024, Quiz Club NITW
Mythology Quiz-4th April 2024, Quiz Club NITW
 
Sulphonamides, mechanisms and their uses
Sulphonamides, mechanisms and their usesSulphonamides, mechanisms and their uses
Sulphonamides, mechanisms and their uses
 
Comparative Literature in India by Amiya dev.pptx
Comparative Literature in India by Amiya dev.pptxComparative Literature in India by Amiya dev.pptx
Comparative Literature in India by Amiya dev.pptx
 
Satirical Depths - A Study of Gabriel Okara's Poem - 'You Laughed and Laughed...
Satirical Depths - A Study of Gabriel Okara's Poem - 'You Laughed and Laughed...Satirical Depths - A Study of Gabriel Okara's Poem - 'You Laughed and Laughed...
Satirical Depths - A Study of Gabriel Okara's Poem - 'You Laughed and Laughed...
 
CARNAVAL COM MAGIA E EUFORIA _
CARNAVAL COM MAGIA E EUFORIA            _CARNAVAL COM MAGIA E EUFORIA            _
CARNAVAL COM MAGIA E EUFORIA _
 
Healthy Minds, Flourishing Lives: A Philosophical Approach to Mental Health a...
Healthy Minds, Flourishing Lives: A Philosophical Approach to Mental Health a...Healthy Minds, Flourishing Lives: A Philosophical Approach to Mental Health a...
Healthy Minds, Flourishing Lives: A Philosophical Approach to Mental Health a...
 

Free Online Graph and Chart Makers

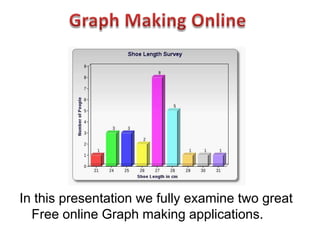
  • 1. In this presentation we fully examine two great Free online Graph making applications.
  • 3. Step 1: Click to choose the Graph Type
  • 4. For our example, we will Shoe Length Nbr of People draw our “Shoe Length 21 cm 1 Survey” data as a Bar Graph. 24 cm 3 25 cm 3 26 cm 2 In this survey, each 27 cm 8 student measured the length of their shoe. 28 cm 5 29 cm 1 We then gathered 30 cm 1 together all the results 31 cm 1 into the frequency table shown on the left.
  • 5. For our example, we are drawing the Shoe Length data from our class as a Bar Graph. First we set up the design for our bar chart graph on the “Design” Tab. We then work our way down through the other Tabs. (Continued next Slide)
  • 6. It is important to set the “Grid Lines” to a number which will enable us later on to have a vertical scale in ones, rather than in lots of in between decimal values on the y-axis. For our nine items, the closest grid lines available in the drop down menu is 11.
  • 7. Next we use the “Data” tab to enter the Graph Title, and the text labels for the horizontal x-axis, and the vertical y-axis. We then choose our bars colour, and enter in all of our data items. (Continued next slide).
  • 8. Note that the maximum and minimum values we have set are 0 and 10, because we set eleven grid lines back on the Design screen tab. 0 to 10 is eleven values, (count them on your fingers), and this means with eleven grid lines we should get a vertical scale for our completed graph which goes in ones.
  • 9. On the “Labels” tab we have set "show labels" to "No", which means there will not be any numbers place above individual bars saying how high they each are. If you like having each bar labeled at the top, with its height value, then set this "labels" option to "Yes".
  • 10. We are now ready to check how our completed Graph will look, which we do by clicking on the "Preview" tab. If we need to go back and change anything, we simply go click on the tab(s) where we need to make changes. We then click the bottom of screen “Update” button, and try the “Preview” tab again.
  • 11. Our Final Step is to Print or Save our completed Graph. We can even email our finished graph to our Instructor. Click on “Download” which takes us to the screen shown on the next slide.
  • 12. There are several different ways to save our graph, which we access by clicking the drop down menu button. The size of our saved JPG picture was 600x453 pixels in size, and it was of very good image quality. After one save, we can also re-save into another format if we want to.
  • 13. This is our completed and saved Bar Chart for the Shoe Length Survey.
  • 15. We will now graph the “Shoe Shoe Length Nbr of People Length Survey” results using 21 cm 1 the “Chart Go” site at : 24 cm 3 25 cm 3 http://www.chartgo.com/ 26 cm 2 At this website, we receive an 27 cm 8 opening screen, where we can 28 cm 5 select our graph type and set 29 cm 1 up all of its data and labeling. 30 cm 1 31 cm 1 (See next slide for full details)
  • 16.
  • 17. After we click the “Create Chart” button we get our graph. If we click on “Modify this Chart” we can go back and redo items on the data entry opening screen. If we right click with our mouse on the graph, we can do a “Save As” and save a picture of our graph.
  • 18. This is our completed and saved Bar Chart for the Shoe Length Survey.
  • 19. http://nces.ed.gov/nceskids/createagraph/default.aspx We can also make Pie Charts Car Colour Nbr of Cars and Line Graphs with the Red 8 "Create a Graph" Application. Silver 15 Black 24 Here is the frequency table for White 18 a Car Park Survey we carried Blue 6 out recently. (Graph on Next Slide)
  • 20. We
  • 21. http://www.chartgo.com We can also make Pie Charts and Line Graphs with the "Chart Go" free web online application. Here is the Car Park pie chart as made in “Chart Go”.