SlideShare a Scribd company logo
1 of 2
Download to read offline
© 2014 The American Road & Transportation Builders Association (ARTBA). All rights reserved. No part of this document may be reproduced or
transmitted in any form or by any means, electronic, mechanical, photocopying, recording, or otherwise, without prior written permission of
ARTBA.
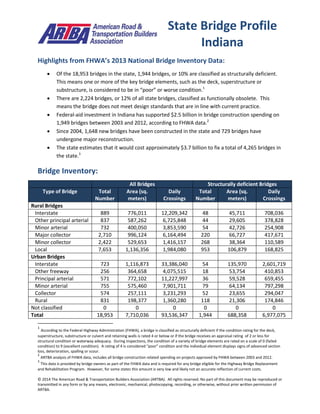
Highlights from FHWA’s 2013 National Bridge Inventory Data:
 Of the 18,953 bridges in the state, 1,944 bridges, or 10% are classified as structurally deficient.
This means one or more of the key bridge elements, such as the deck, superstructure or
substructure, is considered to be in “poor” or worse condition.1
 There are 2,224 bridges, or 12% of all state bridges, classified as functionally obsolete. This
means the bridge does not meet design standards that are in line with current practice.
 Federal-aid investment in Indiana has supported $2.5 billion in bridge construction spending on
1,949 bridges between 2003 and 2012, according to FHWA data.2
 Since 2004, 1,648 new bridges have been constructed in the state and 729 bridges have
undergone major reconstruction.
 The state estimates that it would cost approximately $3.7 billion to fix a total of 4,265 bridges in
the state.3
Bridge Inventory:
All Bridges Structurally deficient Bridges
Type of Bridge Total
Number
Area (sq.
meters)
Daily
Crossings
Total
Number
Area (sq.
meters)
Daily
Crossings
Rural Bridges
Interstate 889 776,011 12,209,342 48 45,711 708,036
Other principal arterial 837 587,262 6,725,848 44 29,605 378,828
Minor arterial 732 400,050 3,853,590 54 42,726 254,908
Major collector 2,710 996,124 6,164,494 220 66,727 417,671
Minor collector 2,422 529,653 1,416,157 268 38,364 110,589
Local 7,653 1,136,356 1,984,080 953 106,879 168,825
Urban Bridges
Interstate 723 1,116,873 33,386,040 54 135,970 2,601,719
Other freeway 256 364,658 4,075,515 18 53,754 410,853
Principal arterial 571 772,102 11,227,997 36 59,528 659,455
Minor arterial 755 575,460 7,901,711 79 64,134 797,298
Collector 574 257,111 3,231,293 52 23,655 294,047
Local 831 198,377 1,360,280 118 21,306 174,846
Not classified 0 0 0 0 0 0
Total 18,953 7,710,036 93,536,347 1,944 688,358 6,977,075
1
According to the Federal Highway Administration (FHWA), a bridge is classified as structurally deficient if the condition rating for the deck,
superstructure, substructure or culvert and retaining walls is rated 4 or below or if the bridge receives an appraisal rating of 2 or less for
structural condition or waterway adequacy. During inspections, the condition of a variety of bridge elements are rated on a scale of 0 (failed
condition) to 9 (excellent condition). A rating of 4 is considered “poor” condition and the individual element displays signs of advanced section
loss, deterioration, spalling or scour.
2
ARTBA analysis of FHWA data, includes all bridge construction related spending on projects approved by FHWA between 2003 and 2012.
3
This data is provided by bridge owners as part of the FHWA data and is required for any bridge eligible for the Highway Bridge Replacement
and Rehabilitation Program. However, for some states this amount is very low and likely not an accurate reflection of current costs.
State Bridge Profile
Indiana
© 2014 The American Road & Transportation Builders Association (ARTBA). All rights reserved. No part of this document may be reproduced or
transmitted in any form or by any means, electronic, mechanical, photocopying, recording, or otherwise, without prior written permission of
ARTBA.
Proposed bridge work:
Type of Work Number Cost (millions) Daily Crossings Area (sq. meters)
Bridge replacement 1,616 $1,958.6 1,971,228 251,124
Widening & rehabilitation 106 $100.1 3,038,021 82,406
Rehabilitation 1,389 $1,099.9 8,655,703 860,359
Deck rehabilitation/replacement 160 $427.3 1,163,325 113,541
Other work 994 $100.7 2,335,636 293,997
Top 10 Most Traveled Structurally Deficient Bridges in the State
County Year
Built
Daily
Crossings
Type of Bridge Location
(route/water under the bridge, traffic on the bridge and location)
Marion 1974 186,289 Urban Interstate NEW YORK STREET, I-65 CD, 1.9 km N I-70
Marion 1974 186,289 Urban Interstate CSX RR OHIO ST, I-65 CD, 1.8 km N I-70
Marion 1974 186,289 Urban Interstate VERMONT STREET, I-65 CD, 2.1 km N I-70
Clark 1962 171,336 Urban Interstate COURT AVENUE, I-65, 0.3 km S US 31
Marion 1972 165,767 Urban Interstate 7 STS ACCESS RD MONORA, I-65, 4.7 km N I-70
Marion 1973 137,908 Urban Interstate MERIDIAN STREET, I-70, 1.4 km W of I-65
Marion 1973 137,908 Urban Interstate MADISON AVE LI RR, I-70 RAMP 8E-N, 1 km W I-65
Clark 1952 88,299 Urban Interstate SR 62X/10TH STREET, I-65, 0.5 km N US 31
Johnson 1971 75,938 Rural Interstate DRAINAGE DITCH, I-65, 9.3 km S I-465
Lake 1980 72,167 Urban
freeway/expressway
BLOCK AVENUE, SR 912 2 RAMPS, 2.6 km W US-12
Sources: All data is from the 2013 National Bridge Inventory, released by the Federal Highway Administration in March 2014.
Note that specific conditions on bridge may have changed as a result of recent work. Cost estimates of bridge work provided as
part of the data and have been adjusted to 2013$ for inflation and estimated project costs. Contract awards data is for state
and local government awards and comes from McGraw Hill. Note that additional bridge investment may be a part of other
contract awards if a smaller bridge project is included with a highway project, and that would not be accounted for in the total
in this profile.

More Related Content

What's hot

State Bridge Profile Iowa 2014
State Bridge Profile Iowa 2014State Bridge Profile Iowa 2014
State Bridge Profile Iowa 2014artba
 
State Bridge Profile Kansas 2014
State Bridge Profile Kansas 2014State Bridge Profile Kansas 2014
State Bridge Profile Kansas 2014artba
 
State Bridge Profile Michigan 2014
State Bridge Profile Michigan 2014State Bridge Profile Michigan 2014
State Bridge Profile Michigan 2014artba
 
State Bridge Profile Kentucky 2014
State Bridge Profile Kentucky 2014State Bridge Profile Kentucky 2014
State Bridge Profile Kentucky 2014artba
 
State Bridge Profile Ohio 2014
State Bridge Profile Ohio 2014State Bridge Profile Ohio 2014
State Bridge Profile Ohio 2014artba
 
State Bridge Profile Texas 2014
State Bridge Profile Texas 2014State Bridge Profile Texas 2014
State Bridge Profile Texas 2014artba
 
Oklahoma State Bridge Profile
Oklahoma State Bridge ProfileOklahoma State Bridge Profile
Oklahoma State Bridge Profileartba
 
California State Bridge Profile
California State Bridge ProfileCalifornia State Bridge Profile
California State Bridge Profileartba
 
Hawaii State Bridge Profile
Hawaii State Bridge ProfileHawaii State Bridge Profile
Hawaii State Bridge Profileartba
 
State Bridge Profiles Arizona 2014
State Bridge Profiles Arizona 2014 State Bridge Profiles Arizona 2014
State Bridge Profiles Arizona 2014 artba
 
State Bridge Profile Wisconsin 2014
State Bridge Profile Wisconsin 2014State Bridge Profile Wisconsin 2014
State Bridge Profile Wisconsin 2014artba
 
Idaho State Bridge Profile
Idaho State Bridge ProfileIdaho State Bridge Profile
Idaho State Bridge Profileartba
 
Utah State Bridge Profile
Utah State Bridge ProfileUtah State Bridge Profile
Utah State Bridge Profileartba
 
State Bridge Profile New Mexico 2014
State Bridge Profile New Mexico 2014State Bridge Profile New Mexico 2014
State Bridge Profile New Mexico 2014artba
 
State Bridge Profile North Dakota 2014
State Bridge Profile North Dakota 2014State Bridge Profile North Dakota 2014
State Bridge Profile North Dakota 2014artba
 
State Bridge Profile West Virginia 2014
State Bridge Profile West Virginia 2014State Bridge Profile West Virginia 2014
State Bridge Profile West Virginia 2014artba
 
State Bridge Profile Arkansas 2014
State Bridge Profile Arkansas 2014State Bridge Profile Arkansas 2014
State Bridge Profile Arkansas 2014artba
 
South Dakota State Bridge Profile
South Dakota State Bridge ProfileSouth Dakota State Bridge Profile
South Dakota State Bridge Profileartba
 
Oregon State Bridge Profile
Oregon State Bridge ProfileOregon State Bridge Profile
Oregon State Bridge Profileartba
 
State Bridge Profile Washington 2014
State Bridge Profile Washington 2014State Bridge Profile Washington 2014
State Bridge Profile Washington 2014artba
 

What's hot (20)

State Bridge Profile Iowa 2014
State Bridge Profile Iowa 2014State Bridge Profile Iowa 2014
State Bridge Profile Iowa 2014
 
State Bridge Profile Kansas 2014
State Bridge Profile Kansas 2014State Bridge Profile Kansas 2014
State Bridge Profile Kansas 2014
 
State Bridge Profile Michigan 2014
State Bridge Profile Michigan 2014State Bridge Profile Michigan 2014
State Bridge Profile Michigan 2014
 
State Bridge Profile Kentucky 2014
State Bridge Profile Kentucky 2014State Bridge Profile Kentucky 2014
State Bridge Profile Kentucky 2014
 
State Bridge Profile Ohio 2014
State Bridge Profile Ohio 2014State Bridge Profile Ohio 2014
State Bridge Profile Ohio 2014
 
State Bridge Profile Texas 2014
State Bridge Profile Texas 2014State Bridge Profile Texas 2014
State Bridge Profile Texas 2014
 
Oklahoma State Bridge Profile
Oklahoma State Bridge ProfileOklahoma State Bridge Profile
Oklahoma State Bridge Profile
 
California State Bridge Profile
California State Bridge ProfileCalifornia State Bridge Profile
California State Bridge Profile
 
Hawaii State Bridge Profile
Hawaii State Bridge ProfileHawaii State Bridge Profile
Hawaii State Bridge Profile
 
State Bridge Profiles Arizona 2014
State Bridge Profiles Arizona 2014 State Bridge Profiles Arizona 2014
State Bridge Profiles Arizona 2014
 
State Bridge Profile Wisconsin 2014
State Bridge Profile Wisconsin 2014State Bridge Profile Wisconsin 2014
State Bridge Profile Wisconsin 2014
 
Idaho State Bridge Profile
Idaho State Bridge ProfileIdaho State Bridge Profile
Idaho State Bridge Profile
 
Utah State Bridge Profile
Utah State Bridge ProfileUtah State Bridge Profile
Utah State Bridge Profile
 
State Bridge Profile New Mexico 2014
State Bridge Profile New Mexico 2014State Bridge Profile New Mexico 2014
State Bridge Profile New Mexico 2014
 
State Bridge Profile North Dakota 2014
State Bridge Profile North Dakota 2014State Bridge Profile North Dakota 2014
State Bridge Profile North Dakota 2014
 
State Bridge Profile West Virginia 2014
State Bridge Profile West Virginia 2014State Bridge Profile West Virginia 2014
State Bridge Profile West Virginia 2014
 
State Bridge Profile Arkansas 2014
State Bridge Profile Arkansas 2014State Bridge Profile Arkansas 2014
State Bridge Profile Arkansas 2014
 
South Dakota State Bridge Profile
South Dakota State Bridge ProfileSouth Dakota State Bridge Profile
South Dakota State Bridge Profile
 
Oregon State Bridge Profile
Oregon State Bridge ProfileOregon State Bridge Profile
Oregon State Bridge Profile
 
State Bridge Profile Washington 2014
State Bridge Profile Washington 2014State Bridge Profile Washington 2014
State Bridge Profile Washington 2014
 

Viewers also liked

Viewers also liked (14)

Os Maias - Capítulo II
Os Maias - Capítulo IIOs Maias - Capítulo II
Os Maias - Capítulo II
 
Trafficking Ring Busted
Trafficking Ring BustedTrafficking Ring Busted
Trafficking Ring Busted
 
Dónde leemos nosotros
Dónde leemos nosotrosDónde leemos nosotros
Dónde leemos nosotros
 
Acta de constitución de ger (2)
Acta de constitución de ger (2)Acta de constitución de ger (2)
Acta de constitución de ger (2)
 
11
1111
11
 
6 to computacion
6 to computacion6 to computacion
6 to computacion
 
Resume2014 2
Resume2014 2Resume2014 2
Resume2014 2
 
802719 cs hats_offtomother
802719 cs hats_offtomother802719 cs hats_offtomother
802719 cs hats_offtomother
 
Melvin g
Melvin gMelvin g
Melvin g
 
Presentation1
Presentation1Presentation1
Presentation1
 
North Dakota State Bridge Profile
North Dakota State Bridge ProfileNorth Dakota State Bridge Profile
North Dakota State Bridge Profile
 
Iowa State Bridge Profile
Iowa State Bridge ProfileIowa State Bridge Profile
Iowa State Bridge Profile
 
Colorado State Bridge Profile
Colorado State Bridge ProfileColorado State Bridge Profile
Colorado State Bridge Profile
 
Presentación13
Presentación13Presentación13
Presentación13
 

Similar to Indiana's Aging Bridge Infrastructure

Louisiana State Bridge Profile
Louisiana State Bridge ProfileLouisiana State Bridge Profile
Louisiana State Bridge Profileartba
 
Nebraska State Bridge Profile
Nebraska State Bridge ProfileNebraska State Bridge Profile
Nebraska State Bridge Profileartba
 
Washington State Bridge Profile
Washington State Bridge ProfileWashington State Bridge Profile
Washington State Bridge Profileartba
 
Alaska State Bridge Profile
Alaska State Bridge ProfileAlaska State Bridge Profile
Alaska State Bridge Profileartba
 
Montana State Bridge Profile
Montana State Bridge ProfileMontana State Bridge Profile
Montana State Bridge Profileartba
 
State Bridge Profile Rhode Island 2014
State Bridge Profile Rhode Island 2014State Bridge Profile Rhode Island 2014
State Bridge Profile Rhode Island 2014artba
 
State Bridge Profile Illinois 2014
State Bridge Profile Illinois 2014State Bridge Profile Illinois 2014
State Bridge Profile Illinois 2014artba
 
State Bridge Profile Utah 2014
State Bridge Profile Utah 2014State Bridge Profile Utah 2014
State Bridge Profile Utah 2014artba
 
Vermont State Bridge Profile
Vermont State Bridge ProfileVermont State Bridge Profile
Vermont State Bridge Profileartba
 
State Bridge Profile South Dakota 2014
State Bridge Profile South Dakota 2014State Bridge Profile South Dakota 2014
State Bridge Profile South Dakota 2014artba
 
State Bridge Profiles Alaska 2014
State Bridge Profiles Alaska 2014 State Bridge Profiles Alaska 2014
State Bridge Profiles Alaska 2014 artba
 
State Bridge Profile Louisiana 2014
State Bridge Profile Louisiana 2014State Bridge Profile Louisiana 2014
State Bridge Profile Louisiana 2014artba
 
State Bridge Profile Nevada 2014
State Bridge Profile Nevada 2014State Bridge Profile Nevada 2014
State Bridge Profile Nevada 2014artba
 
State Bridge Profile Nebraska 2014
State Bridge Profile Nebraska 2014State Bridge Profile Nebraska 2014
State Bridge Profile Nebraska 2014artba
 
Rhode Island State Bridge Profile
Rhode Island State Bridge ProfileRhode Island State Bridge Profile
Rhode Island State Bridge Profileartba
 
State Bridge Profiles Alabama 2014
State Bridge Profiles Alabama 2014State Bridge Profiles Alabama 2014
State Bridge Profiles Alabama 2014artba
 
State Bridge Profile Vermont 2014
State Bridge Profile Vermont 2014State Bridge Profile Vermont 2014
State Bridge Profile Vermont 2014artba
 

Similar to Indiana's Aging Bridge Infrastructure (17)

Louisiana State Bridge Profile
Louisiana State Bridge ProfileLouisiana State Bridge Profile
Louisiana State Bridge Profile
 
Nebraska State Bridge Profile
Nebraska State Bridge ProfileNebraska State Bridge Profile
Nebraska State Bridge Profile
 
Washington State Bridge Profile
Washington State Bridge ProfileWashington State Bridge Profile
Washington State Bridge Profile
 
Alaska State Bridge Profile
Alaska State Bridge ProfileAlaska State Bridge Profile
Alaska State Bridge Profile
 
Montana State Bridge Profile
Montana State Bridge ProfileMontana State Bridge Profile
Montana State Bridge Profile
 
State Bridge Profile Rhode Island 2014
State Bridge Profile Rhode Island 2014State Bridge Profile Rhode Island 2014
State Bridge Profile Rhode Island 2014
 
State Bridge Profile Illinois 2014
State Bridge Profile Illinois 2014State Bridge Profile Illinois 2014
State Bridge Profile Illinois 2014
 
State Bridge Profile Utah 2014
State Bridge Profile Utah 2014State Bridge Profile Utah 2014
State Bridge Profile Utah 2014
 
Vermont State Bridge Profile
Vermont State Bridge ProfileVermont State Bridge Profile
Vermont State Bridge Profile
 
State Bridge Profile South Dakota 2014
State Bridge Profile South Dakota 2014State Bridge Profile South Dakota 2014
State Bridge Profile South Dakota 2014
 
State Bridge Profiles Alaska 2014
State Bridge Profiles Alaska 2014 State Bridge Profiles Alaska 2014
State Bridge Profiles Alaska 2014
 
State Bridge Profile Louisiana 2014
State Bridge Profile Louisiana 2014State Bridge Profile Louisiana 2014
State Bridge Profile Louisiana 2014
 
State Bridge Profile Nevada 2014
State Bridge Profile Nevada 2014State Bridge Profile Nevada 2014
State Bridge Profile Nevada 2014
 
State Bridge Profile Nebraska 2014
State Bridge Profile Nebraska 2014State Bridge Profile Nebraska 2014
State Bridge Profile Nebraska 2014
 
Rhode Island State Bridge Profile
Rhode Island State Bridge ProfileRhode Island State Bridge Profile
Rhode Island State Bridge Profile
 
State Bridge Profiles Alabama 2014
State Bridge Profiles Alabama 2014State Bridge Profiles Alabama 2014
State Bridge Profiles Alabama 2014
 
State Bridge Profile Vermont 2014
State Bridge Profile Vermont 2014State Bridge Profile Vermont 2014
State Bridge Profile Vermont 2014
 

More from artba

2017 media kit
2017 media kit2017 media kit
2017 media kitartba
 
September October tb_2016
September October tb_2016September October tb_2016
September October tb_2016artba
 
Transportation Builder July/August 2016
Transportation Builder July/August 2016Transportation Builder July/August 2016
Transportation Builder July/August 2016artba
 
The National Work Zone Management Conference Agenda 2016
The National Work Zone Management Conference Agenda 2016The National Work Zone Management Conference Agenda 2016
The National Work Zone Management Conference Agenda 2016artba
 
ARTBA 2016 National Convention Program
ARTBA 2016 National Convention ProgramARTBA 2016 National Convention Program
ARTBA 2016 National Convention Programartba
 
May/June Transportation Builder
May/June Transportation BuilderMay/June Transportation Builder
May/June Transportation Builderartba
 
Northeastern regional meeting
Northeastern regional meetingNortheastern regional meeting
Northeastern regional meetingartba
 
Southern regional meeting
Southern regional meetingSouthern regional meeting
Southern regional meetingartba
 
Central regional meeting
Central regional meetingCentral regional meeting
Central regional meetingartba
 
Western regional meeting
Western regional meetingWestern regional meeting
Western regional meetingartba
 
Western regional meeting
Western regional meetingWestern regional meeting
Western regional meetingartba
 
July/August 2015 TB magazine
July/August 2015 TB magazineJuly/August 2015 TB magazine
July/August 2015 TB magazineartba
 
September/October 2015 TB magazine
September/October 2015 TB magazineSeptember/October 2015 TB magazine
September/October 2015 TB magazineartba
 
November/December 2015 TB
November/December 2015 TBNovember/December 2015 TB
November/December 2015 TBartba
 
January/February 2016 TB
January/February 2016 TBJanuary/February 2016 TB
January/February 2016 TBartba
 
March/April 2016 TB
March/April 2016 TBMarch/April 2016 TB
March/April 2016 TBartba
 
2016 ­ARTBA FIP Schedule
2016 ­ARTBA FIP Schedule2016 ­ARTBA FIP Schedule
2016 ­ARTBA FIP Scheduleartba
 
2016 ARTBA FIP Program
2016 ARTBA FIP Program2016 ARTBA FIP Program
2016 ARTBA FIP Programartba
 
2016 ILDP Agenda
2016 ILDP Agenda2016 ILDP Agenda
2016 ILDP Agendaartba
 
P3 Agenda 2016
P3 Agenda 2016P3 Agenda 2016
P3 Agenda 2016artba
 

More from artba (20)

2017 media kit
2017 media kit2017 media kit
2017 media kit
 
September October tb_2016
September October tb_2016September October tb_2016
September October tb_2016
 
Transportation Builder July/August 2016
Transportation Builder July/August 2016Transportation Builder July/August 2016
Transportation Builder July/August 2016
 
The National Work Zone Management Conference Agenda 2016
The National Work Zone Management Conference Agenda 2016The National Work Zone Management Conference Agenda 2016
The National Work Zone Management Conference Agenda 2016
 
ARTBA 2016 National Convention Program
ARTBA 2016 National Convention ProgramARTBA 2016 National Convention Program
ARTBA 2016 National Convention Program
 
May/June Transportation Builder
May/June Transportation BuilderMay/June Transportation Builder
May/June Transportation Builder
 
Northeastern regional meeting
Northeastern regional meetingNortheastern regional meeting
Northeastern regional meeting
 
Southern regional meeting
Southern regional meetingSouthern regional meeting
Southern regional meeting
 
Central regional meeting
Central regional meetingCentral regional meeting
Central regional meeting
 
Western regional meeting
Western regional meetingWestern regional meeting
Western regional meeting
 
Western regional meeting
Western regional meetingWestern regional meeting
Western regional meeting
 
July/August 2015 TB magazine
July/August 2015 TB magazineJuly/August 2015 TB magazine
July/August 2015 TB magazine
 
September/October 2015 TB magazine
September/October 2015 TB magazineSeptember/October 2015 TB magazine
September/October 2015 TB magazine
 
November/December 2015 TB
November/December 2015 TBNovember/December 2015 TB
November/December 2015 TB
 
January/February 2016 TB
January/February 2016 TBJanuary/February 2016 TB
January/February 2016 TB
 
March/April 2016 TB
March/April 2016 TBMarch/April 2016 TB
March/April 2016 TB
 
2016 ­ARTBA FIP Schedule
2016 ­ARTBA FIP Schedule2016 ­ARTBA FIP Schedule
2016 ­ARTBA FIP Schedule
 
2016 ARTBA FIP Program
2016 ARTBA FIP Program2016 ARTBA FIP Program
2016 ARTBA FIP Program
 
2016 ILDP Agenda
2016 ILDP Agenda2016 ILDP Agenda
2016 ILDP Agenda
 
P3 Agenda 2016
P3 Agenda 2016P3 Agenda 2016
P3 Agenda 2016
 

Indiana's Aging Bridge Infrastructure

  • 1. © 2014 The American Road & Transportation Builders Association (ARTBA). All rights reserved. No part of this document may be reproduced or transmitted in any form or by any means, electronic, mechanical, photocopying, recording, or otherwise, without prior written permission of ARTBA. Highlights from FHWA’s 2013 National Bridge Inventory Data:  Of the 18,953 bridges in the state, 1,944 bridges, or 10% are classified as structurally deficient. This means one or more of the key bridge elements, such as the deck, superstructure or substructure, is considered to be in “poor” or worse condition.1  There are 2,224 bridges, or 12% of all state bridges, classified as functionally obsolete. This means the bridge does not meet design standards that are in line with current practice.  Federal-aid investment in Indiana has supported $2.5 billion in bridge construction spending on 1,949 bridges between 2003 and 2012, according to FHWA data.2  Since 2004, 1,648 new bridges have been constructed in the state and 729 bridges have undergone major reconstruction.  The state estimates that it would cost approximately $3.7 billion to fix a total of 4,265 bridges in the state.3 Bridge Inventory: All Bridges Structurally deficient Bridges Type of Bridge Total Number Area (sq. meters) Daily Crossings Total Number Area (sq. meters) Daily Crossings Rural Bridges Interstate 889 776,011 12,209,342 48 45,711 708,036 Other principal arterial 837 587,262 6,725,848 44 29,605 378,828 Minor arterial 732 400,050 3,853,590 54 42,726 254,908 Major collector 2,710 996,124 6,164,494 220 66,727 417,671 Minor collector 2,422 529,653 1,416,157 268 38,364 110,589 Local 7,653 1,136,356 1,984,080 953 106,879 168,825 Urban Bridges Interstate 723 1,116,873 33,386,040 54 135,970 2,601,719 Other freeway 256 364,658 4,075,515 18 53,754 410,853 Principal arterial 571 772,102 11,227,997 36 59,528 659,455 Minor arterial 755 575,460 7,901,711 79 64,134 797,298 Collector 574 257,111 3,231,293 52 23,655 294,047 Local 831 198,377 1,360,280 118 21,306 174,846 Not classified 0 0 0 0 0 0 Total 18,953 7,710,036 93,536,347 1,944 688,358 6,977,075 1 According to the Federal Highway Administration (FHWA), a bridge is classified as structurally deficient if the condition rating for the deck, superstructure, substructure or culvert and retaining walls is rated 4 or below or if the bridge receives an appraisal rating of 2 or less for structural condition or waterway adequacy. During inspections, the condition of a variety of bridge elements are rated on a scale of 0 (failed condition) to 9 (excellent condition). A rating of 4 is considered “poor” condition and the individual element displays signs of advanced section loss, deterioration, spalling or scour. 2 ARTBA analysis of FHWA data, includes all bridge construction related spending on projects approved by FHWA between 2003 and 2012. 3 This data is provided by bridge owners as part of the FHWA data and is required for any bridge eligible for the Highway Bridge Replacement and Rehabilitation Program. However, for some states this amount is very low and likely not an accurate reflection of current costs. State Bridge Profile Indiana
  • 2. © 2014 The American Road & Transportation Builders Association (ARTBA). All rights reserved. No part of this document may be reproduced or transmitted in any form or by any means, electronic, mechanical, photocopying, recording, or otherwise, without prior written permission of ARTBA. Proposed bridge work: Type of Work Number Cost (millions) Daily Crossings Area (sq. meters) Bridge replacement 1,616 $1,958.6 1,971,228 251,124 Widening & rehabilitation 106 $100.1 3,038,021 82,406 Rehabilitation 1,389 $1,099.9 8,655,703 860,359 Deck rehabilitation/replacement 160 $427.3 1,163,325 113,541 Other work 994 $100.7 2,335,636 293,997 Top 10 Most Traveled Structurally Deficient Bridges in the State County Year Built Daily Crossings Type of Bridge Location (route/water under the bridge, traffic on the bridge and location) Marion 1974 186,289 Urban Interstate NEW YORK STREET, I-65 CD, 1.9 km N I-70 Marion 1974 186,289 Urban Interstate CSX RR OHIO ST, I-65 CD, 1.8 km N I-70 Marion 1974 186,289 Urban Interstate VERMONT STREET, I-65 CD, 2.1 km N I-70 Clark 1962 171,336 Urban Interstate COURT AVENUE, I-65, 0.3 km S US 31 Marion 1972 165,767 Urban Interstate 7 STS ACCESS RD MONORA, I-65, 4.7 km N I-70 Marion 1973 137,908 Urban Interstate MERIDIAN STREET, I-70, 1.4 km W of I-65 Marion 1973 137,908 Urban Interstate MADISON AVE LI RR, I-70 RAMP 8E-N, 1 km W I-65 Clark 1952 88,299 Urban Interstate SR 62X/10TH STREET, I-65, 0.5 km N US 31 Johnson 1971 75,938 Rural Interstate DRAINAGE DITCH, I-65, 9.3 km S I-465 Lake 1980 72,167 Urban freeway/expressway BLOCK AVENUE, SR 912 2 RAMPS, 2.6 km W US-12 Sources: All data is from the 2013 National Bridge Inventory, released by the Federal Highway Administration in March 2014. Note that specific conditions on bridge may have changed as a result of recent work. Cost estimates of bridge work provided as part of the data and have been adjusted to 2013$ for inflation and estimated project costs. Contract awards data is for state and local government awards and comes from McGraw Hill. Note that additional bridge investment may be a part of other contract awards if a smaller bridge project is included with a highway project, and that would not be accounted for in the total in this profile.