SlideShare a Scribd company logo
1 of 48
Download to read offline
Thematic Study
                                                                                                         17 December 2009


            14TH ANNUAL WEALTH CREATION STUDY (2004-2009)


                                                   HIGHLIGHTS
                             India's NTD Era (Next       Trillion
                                                         Trillion Dollar of GDP) will be
                              marked by sustained        boom in discretionary spend,
                                           savings       and investment

                             Winner Categories and Category Winners will enjoy
                                       exponential growth in profits

                              Category Winners bought at reasonable valuation
                                 create significant wealth over the long term


                               TOP 10 WEALTH CREATORS (200 4 - 200 9)
                                      WEALTH CREAT    (2004    2009

      THE BIGGEST                       THE FASTEST                          THE MOST CONSISTENT
                           Wealth                             5-Year
                                                              5-Y                             Appeared          10-Year
                                                                                                                10-Y
Rank Company              Created       Company                Price         Company             in WC            Price
                           (Rs b)                           CAGR (%)                           Study (x)      CAGR (%)
  1   Reliance Inds.        1,514       Unitech                  122         HDFC                    10              25
  2   Bharti Airtel           891       Areva T&D                 97         Sun Pharma.             10              24
  3   BHEL                    588       BF Utilities              84         Reliance Inds.          10              22
  4   NMDC                    578       Opto Circuits             84         Hero Honda Motor        10              21
  5   ONGC                    471       NMDC                      71         Infosys Tech.           10               2
  6   ITC                     436       Shri.City Union.          70         Asian Paints             9              18
  7   Infosys Tech.           405       United Spirits            64         Nestle India             9              17
  8   Larsen & Toubro         291       Jindal Steel              64         HDFC Bank                9              16
  9   SAIL                    265       Sterling Intl             62         ITC                      9              16
 10   HDFC                    193       Chettinad Cement          58         Ambuja Cem.              9              11


Raamdeo Agrawal (Raamdeo@MotilalOswal.com ) / Shrinath Mithanthaya (ShrinathM@MotilalOswal.com)
We thank Mr Dhruv Mehta (dhruvlmehta@gmail.com), Investment Consultant, for his invaluable contribution to this report.
Wealth Creation Study 2004-2009


               Contents


               Objective, Concept and Methodology ........................................................................ 3


               Wealth Creation Study 2004-2009: Findings ......................................................... 4-18


               Theme 2010: Winner Categories + Category Winners ...................................... 20-34


               Market Outlook .................................................................................................... 36-39


               Appendix I: MOSL 100 – Biggest Wealth Creators .......................................... 41-42


               Appendix II: MOSL 100 – Fastest Wealth Creators ......................................... 43-44


               Appendix III: MOSL 100 – Wealth Creators (alphabetical).............................. 45-46


               Abbreviations and Terms used in this report

               ABBREVIATION / TERM         DESCRIPTION


               2004, 2009, etc             Reference to years for India are financial year ending March, unless otherwise stated
               Avg                         Average
               CAGR                        Compound Annual Growth Rate; All CAGR calculations are for 2004 to 2009
                                           unless otherwise stated
               L to P / P to L             Loss to Profit / Profit to Loss. In such cases, calculation of PAT CAGR is not possible
               Price CAGR                  In the case of aggregates, Price CAGR refers to Market Cap CAGR
               RS B                        Indian Rupees in billion
               WC                          Wealth Creation / Wealth Created
               Wealth Created              Increase in Market Capitalization over the last 5 years, duly adjusted for corporate
                                           events such as fresh equity issuance, mergers, demergers, share buybacks, etc.


17 December 2009   2
Wealth Creation Study 2004-2009


                          Wealth Creation Study 2004-2009

                          Objective, Concept and Methodology


                          Objective
                          The foundation of Wealth Creation is in buying businesses at a price substantially lower
                          than their “intrinsic value” or “expected value”. The lower the market value is compared
                          to the intrinsic value, the higher is the margin of safety. In this year’s study, we continue
                          our endeavor to cull out the characteristics of businesses, which create value for their
                          shareholders.

                          As Phil Fisher says, “It seems logical that even before thinking of buying any common
                          stock, the first step is to see how money has been most successfully made in the
                          past.” Our Wealth Creation studies are attempts to study the past as a guide to the future
                          and gain insights into How to Value a Business.


                          Concept
                          Wealth Creation is the process by which a company enhances the market value of the
                          capital entrusted to it by its shareholders. It is a basic measure of success for any commercial
                          venture. Wealth Creation is achieved by the rational actions of a company in a sustained
                          manner.


                          Methodology
                          For the purpose of our study*, we have identified the top 100 Wealth Creators in the Indian
                          stock market for the period 2004-2009. These companies have the distinction of having
                          added at least Rs1b to their market capitalization over this period of five years, after
                          adjusting for dilution. We have termed the group of Wealth Creators as the ‘MOSL - 100’.
                          The biggest and fastest Wealth Creators have been listed in Appendix I and II on page 41
                          and 43, respectively. Ranks have been accorded on the basis of Size and Speed of Wealth
                          Creation (speed is price CAGR during the period under study).

                          On the cover page, we have presented the top 10 companies in terms of Size of Wealth
                          Creation (called THE BIGGEST), the top 10 companies in terms of Speed of Wealth
                          Creation (called THE FASTEST), and the top 10 companies in terms of their frequency of
                          appearance as wealth creators in our Wealth Creation studies (called THE MOST
                          CONSISTENT).


                            Theme 2010
                            Our Theme for 2010 is Winner Categories + Category Winners, discussion on
                            which starts from page 20.

                          * Capitaline database has been used for this study


17 December 2009   3
Wealth Creation Study 2004-2009   Findings


 Wealth Creation

 2004-2009
 The 14TH Annual Study


Findings


17 December 2009   4
Wealth Creation Study 2004-2009                                                                                                                  Findings


 Wealth Creation                                           TOP 10 BIGGEST WEALTH CREATORS
                                                            RANK COMPANY                      NET WEALTH CREATED                      PRICE         PAT                P/E (X)
 2004-2009                                                                                      RS B   % SHARE                       CAGR (%)     CAGR (%)     FY09           FY04
                                                              1    Reliance Inds.                  1,514             15.6             28.3            24.3      15.7            14.6
 The Biggest Wealth Creators                                  2    Bharti Airtel                     891              9.2             32.3            68.9      14.8            49.0
 Reliance Industries is No.1                                  3    BHEL                              588              6.1             37.8            36.7      23.5            22.5
 Reliance Industries has emerged as the biggest               4    NMDC                              578              6.0             70.6            58.8      14.2             9.9
 wealth creator for the third time in a row.                  5    ONGC                              471              4.9              6.8            13.2      10.3            13.8
                                                              6    ITC                               436              4.5             21.6            15.4      21.4            16.2
 Although the absolute wealth created is lower than
                                                              7    Infosys Tech.                     405              4.2             16.5            36.2      13.0            26.5
 the previous two years, its share in total wealth
                                                              8    Larsen & Toubro                   291              3.0             36.2            45.6      11.3            13.4
 created has increased - 11.4% in FY07, 12% in
                                                              9    SAIL                              265              2.7             24.5            19.7       6.5             5.3
 FY08 and 15.6% in FY09.
                                                             10    HDFC                              193              2.0             17.0            21.8      17.6            18.6
 For the last six years, the biggest wealth creator in
 India has emerged from Oil & Gas - the first three        BIGGEST WEALTH CREATORS AND WEALTH CREATED (RS B): OIL & GAS DOMINATES
 years led by ONGC and next three by Reliance.
                                                            2009                                                   1,514    Reliance Inds
 Six companies have featured in the top 10 wealth           2008                                                                                             3,077     Reliance Inds
                                                            2007                                                             1,856    Reliance Inds
 creators for three consecutive years - Reliance,
                                                            2006                                                       1,678    ONGC
 Bharti, ONGC, BHEL, L&T and SAIL.
                                                            2005                                   1,065     ONGC
                                                            2004                                   1,030     ONGC
 Key Finding                                                2003        245    Wipro
 Reliance has commenced gas production in KG-               2002              383 Wipro
 D6 basin, and continues to aggressively pursue its         2001              377    Hind. Lever
 other E&P activity. In FY10, it has also merged            2000                                           1,247    Wipro

 Reliance Petroleum with itself. Further, its closest       1999          341       Hind. Lever
                                                            1998        262     Hind. Lever
 competitor in wealth creation - Bharti - is facing
                                                            1997   73   Hind. Lever
 sector headwinds. Thus, Reliance is likely to sustain             91
                                                            1996        Hind. Lever
 its top position for the next couple of years at least.


17 December 2009    5
Wealth Creation Study 2004-2009                                                                                                  Findings


 Wealth Creation                                           TOP 10 FASTEST WEALTH CREATORS
                                                           RANK COMPANY                       PRICE        PRICE       PAT        MCAP (RS B)              P/E (X)
 2004-2009                                                                                  APPREN. (X)   CAGR (%)   CAGR (%)     FY09    FY04           FY09    FY04
                                                              1    Unitech                        54        122        121         56.7              1.1   7.7       7.6
 The Fastest Wealth Creators
                                                              2    Areva T&D                      29         97         68         48.6              1.4  21.5       8.1
 Unitech is No.1                                              3    BF Utilities                   21         84       L to P       12.1              0.6 260.5         -
 Unitech is the Fastest Wealth Creator during                 4    Opto Circuits                  21         84         61         16.3              0.7  11.6       5.1
 2004-09, for the second time in a row.                       5    NMDC                           14         71         59        621.3             43.0  14.2       9.9
                                                              6    Shri.City Union.               14         70         45         14.9              0.6  12.7       3.4
 Its 5-year stock price CAGR is a staggering 122%,            7    United Spirits                 12         64         69         65.1              2.8  21.9      13.2
 albeit significantly lower than the last year figure of      8    Jindal Steel                   12         64         38        185.9             15.8  12.1       5.2
 284%.                                                        9    Sterling Intl                  11         62        -32         36.0              3.2     -      17.4
                                                             10    Chettinad Cement               10         58       P to L       13.5              1.4     -       9.9
 Unitech has featured among the Top 10 fastest
 wealth creators for the last four years in a row, B F
 Utilities for the last three years and NMDC for the       HISTORY OF FASTEST WEALTH CREATOR (PRICE APPRECIATION - X)

 last two years.
                                                            2009       54 Unitech
                                                            2008                                                                                      837 Unitech
 This year, NMDC has the unique distinction of              2007                                                                665 B F Utilities
 featuring in both the biggest and the fastest wealth       2006                      182 Matrix Labs
                                                            2005                136 Matrix Labs
 creators list.
                                                            2004          75 Matrix Labs
                                                            2003       50 e-Serve
                                                            2002         69 Wipro
 Key Finding                                                2001        66 Infosys
 In nine of the top 10 fastest wealth creators, at least    2000                       223 SSI
 two of the following three conditions hold true: (1)       1999         75 Satyam Computers
 Base market cap less than Rs4b, (2) Base P/E in            1998     23 Satyam Computers
                                                            1997   7 Cipla
 single digit, and (3) PAT growth of over 35%. In six                  30 Dr Reddy's Labs
                                                            1996
 cases, all the three hold true.


17 December 2009    6
Wealth Creation Study 2004-2009                                                                                                   Findings

                                                         TOP 10 CONSISTENT WEALTH CREATORS
 Wealth Creation
                                                         RANK COMPANY                APPEARED IN LAST             10-YR PRICE             PAT            P/E (X)
 2004-2009                                                                           10 WC STUDIES (X)             CAGR (%)             CAGR (%)      2009       2004
                                                            1   HDFC                           10                       24.9              21.8        17.6      18.6
 Most Consistent Wealth Creators                            2   Sun Pharma.                    10                       24.0              39.4        18.2      25.1
                                                            3   Reliance Inds.                 10                       21.9              24.3        15.7      14.6
 HDFC is Most Consistent                                    4   Hero Honda Motor               10                       20.9              12.0        16.7      13.4
 Five companies - HDFC, Sun Pharma, Reliance                5   Infosys Tech.                  10                       2.0               36.2        13.0      26.5
 Inds, Hero Honda and Infosys - have featured               6   Asian Paints                    9                       18.0              19.7        20.8      19.7
 among the top 100 wealth creators in each of the           7   Nestle India                    9                       17.2              15.2        28.1      23.2
 last 10 years. HDFC is ranked as the most                  8   HDFC Bank                       9                       15.9              34.5        18.3      21.1
 consistent by virtue of its 10-year price CAGR being       9   ITC                             9                       15.9              15.4        21.4      16.2
 the highest.                                              10   Ambuja Cem.                     9                       10.8              33.0         7.7      14.6


 This year, eight of the top 10 most consistent wealth
 creators are consumer-facing businesses with strong     CONSUMER FACING COMPANIES SCORE HIGH ON CONSISTENT WEALTH CREATION
 franchise. Our past studies have also clearly
 established the dominance of consumer-facing
                                                                                      Consistent Wealth Creators - 2005 to 2009
 companies in consistent wealth creation.

                                                                                  Consumer Facing                                         Non-Consumer Facing


                                                          Pharma                    FMCG                         Others                          IT
                                                            Cipla (4)                 Asian Paints (3)              Hero Honda (5)                  Infosys (3)
 Key Finding                                                Dr Reddy's Lab (3)                                                                      Wipro (3)
                                                                                      ITC (5)                       HDFC (5)
 Businesses like FMCG, Pharma and Banking are               GSK Pharma (2)            Nestle India (1)              HDFC Bank (1)                   Satyam (2)
 non-cyclical and have a high degree of customer            Piramal Health. (4)                                                                  Others
 captivity. With consumerism in India poised to rise,       Ranbaxy Lab (4)            Number in brackets indicates times appeared                  Reliance Inds (2)
 these businesses should continue to create wealth          Sun Pharma (2)             within top 10 in last five years, 2005 to 2009               Ambuja Cement (1)
 consistently.


17 December 2009   7
Wealth Creation Study 2004-2009                                                                                                                                                                                                  Findings


 Wealth Creators (Wealthex)                              WEALTH CREATORS’ INDEX V/S BSE SENSEX (31.3.04 TO 31.3.09)

                                                                                                                                         Wealthex - Rebased                                    Sensex
 Comparative Performance                                  32,000

 v/s BSE Sensex
                                                          24,000
 Superior performance over benchmark
 We have compared the performance of Wealthex             16,000

 (top 100 Wealth Creators index) with the BSE                                                                                                                                                             80% Outperform ance
                                                           8,000
 Sensex on three parameters - (1) market
 performance, (2) earnings growth, and (3) valuation.         0


                                                                   Mar-04

                                                                            Jun-04


                                                                                              Dec-04

                                                                                                       Mar-05

                                                                                                                Jun-05


                                                                                                                                     Dec-05

                                                                                                                                               Mar-06

                                                                                                                                                          Jun-06


                                                                                                                                                                             Dec-06

                                                                                                                                                                                      Mar-07

                                                                                                                                                                                                 Jun-07


                                                                                                                                                                                                                       Dec-07

                                                                                                                                                                                                                                Mar-08

                                                                                                                                                                                                                                           Jun-08


                                                                                                                                                                                                                                                             Dec-08

                                                                                                                                                                                                                                                                       Mar-09
                                                                                     Sep-04


                                                                                                                          Sep-05


                                                                                                                                                                   Sep-06


                                                                                                                                                                                                            Sep-07


                                                                                                                                                                                                                                                    Sep-08
 Market performance: The Wealthex beat the
 Sensex in each of five years, FY04 through FY09.
 Over the entire period, the Wealthex outperformed
 the Sensex by 83%.
                                                         SENSEX V/S WEALTH CREATORS: HIGHER EARNINGS GROWTH, LOWER VALUATION
                                                                                                                         MAR-04               MAR-05               MAR-06              MAR-07                  MAR-08 MAR-09                                 5-YEAR
 Earnings growth: In three of five years, Wealthex
                                                                                                                                                                                                                                                         CAGR (%)
 earnings growth was significantly better than the
                                                          BSE Sensex                                                       5,591                  6,493              11,280                13,072                    15,644               9,709                       11.7
 Sensex, and in two years, it was almost in line. Over
                                                           CAGR (%)                                                                                16.1                42.0                  32.7                      29.3                 11.7
 the five-year period, Wealthex earnings CAGR was
                                                           YoY Performance (%)                                                                     16.1                73.7                  15.9                      19.7               (37.9)
 24.2% compared to 18.8% for the Sensex.
                                                          Wealthex - based to Sensex                                       5,591                  7,050              12,600                14,759                    20,877              14,206                       20.5
 Valuation: The Wealthex average P/E was 16.3x,            CAGR (%)                                                                                26.1                50.1                  38.2                      39.0                 20.5
 lower than 16.8x for the Sensex.                          YoY Performance (%)                                                                     26.1                78.7                  17.1                      41.4               (32.0)
 Key Finding                                              Sensex EPS (Rs)                                                          348              450                 523                   718                       833                  825                      18.8
 Wealth creating companies tend to initially trade at      YoY Performance (%)                                                                     29.1                16.4                  37.3                      16.0                (1.0)
 a discount to market valuation. With superior             Sensex P/E (x)                                                      16.0                14.4                21.6                  18.2                      18.8                 11.8
 earnings growth over time, they get re-rated and end     Wealthex EPS (Rs)                                                     381                 533                 616                   840                      1085                1126                       24.2
 up at a premium to market valuation, leading to           YoY Performance (%)                                                                     39.7                15.6                  36.4                      29.2                  3.7
 outperformance.                                            Wealthex P/E (x)                                                   14.7                     13.2                20.5                17.6                   19.2                12.6

17 December 2009   8
Wealth Creation Study 2004-2009                                                                                                     Findings


 Wealth Creators                                           WEALTH CREATORS: CLASSIFICATION BY INDUSTRY                                                              (RS B)
                                                                                  WEALTH           SHARE OF WEALTH            PRICE             PAT         P/E (X)
 Classification By                                         INDUSTRY              CREATED              CREATED (%)             CAGR             CAGR     2009     2004
                                                                                   (RS B)            2009       2004            (%)              (%)
 Industry                                                  Oil & Gas (4)               2,126          22.1            43.3      15.5             16.9   12.8        13.6
                                                           Metals (10)                 1,458          15.1             6.5      35.5             32.9   10.1         9.2
 Value migration: Oil & Gas continues to be the
                                                           Engineering (13)            1,167          12.1             5.0      32.5             36.8   15.0        17.6
 largest wealth creating sector. However, over the         FMCG (16)                   1,044          10.8             0.7      18.4             14.3   21.0        17.6
 last five years, its share has fallen from 43% of         Telecom (4)                 1,012          10.5             0.0      30.3             61.5   16.5        48.4
 wealth created to 22%, clearly indicating value           Banking & Finance (12)        889           9.2            15.3      22.4             24.7    8.7         9.6
 migration to sectors such as Telecom and FMCG.            IT (5)                        492           5.1             7.4      12.4             33.2   12.6        29.6
                                                           Pharma (9)                    427           4.4             5.6      22.5             29.2   17.3        22.6
 Telecom's rising share of wealth created can be           Auto (8)                      357           3.7             6.0      14.5             16.7   16.8        18.5
 attributed to superior PAT CAGR of 62% over the           Others (7)                    198           2.1             3.6      21.4             27.9    7.9        10.3
 last 5 years. On the other hand, FMCG PAT CAGR            Cement (6)                    186           1.9             2.2      15.1             29.0    8.3        14.6
 is a muted 14%; however, the sector has seen a            Ultility (3)                  143           1.5             4.0      14.0              0.9   18.4        10.0
                                                           Construction / Real Estate (1) 56           0.6             0.0     121.6            120.9    7.7         7.6
 valuation re-rating, more so given the flight to safety
                                                           Media (1)                      53           0.5             0.4      -3.6             21.9   14.9        48.0
 phenomenon during the market downturn in FY09.            Retail (1)                     29           0.3             0.0      50.2             70.0   21.8        40.5
                                                           Total                       9,637         100.0           100.0      20.5             24.3   12.6        14.7
 Old v/s New Economy: Wealth creation in New
 Economy businesses - IT, Telecom, Media and Retail        NEW ECONOMY PERFORMANCE IN THE TOP 100 WEALTH CREATORS
 - has not been able to sustain momentum due to
                                                                                                  No of Companies            % Wealth Created
 slowdown in IT following global economic crisis.
 However, the longer term trend is clearly up.                                                                      20                                     16
                                                                                                                                        12
 Key Finding                                                                             10
 Banking has lost some share of wealth created due                                                                                                          11
                                                                                                                    10                 10
 to the economic slowdown in FY09 and 1HFY10.
 However, the outlook is improving from 2HFY10. As                    1                   5
                                                                             1
 a secular business with reasonable valuation, Indian
                                                                   2000-05              2001-06                 2002-07              2003-08              2004-09
 banking holds potential for huge wealth creation.


17 December 2009    9
Wealth Creation Study 2004-2009                                                                                                             Findings


 Wealth Creators                                        WEALTH CREATORS: MNCs V/S INDIAN COMPANIES                        MNC WEALTH CREATION BY SECTOR
                                                                                                 2004-2009
                                                                                            MNC       INDIAN                                       Pharma
 Classification By                                                                                                                                   4%   Cement
                                                        Number of Wealth Creators             23              77
 MNCs v/s Indian Companies                              % Wealth Created                    13.8            86.2
                                                                                                                                                            7%
                                                                                                                                                               Others
                                                        Sales CAGR (%)                      19.5            22.0                                                 3%
 Will the foreign hand rise again?
 In each of our first four Wealth Creation studies,     PAT CAGR (%)                        19.3            25.1                                              Auto
 Hindustan Lever (now renamed as Hindustan              Price CAGR (%)                      16.3            21.3                                              10%
                                                        P/E - 2004 (x)                      18.8            14.1                   FMCG
 Unilever) was the biggest wealth creator, signifying
                                                                                                                                    63%                      Engg
 the era of the MNCs.                                   P/E - 2009 (x)                      16.6            12.1
                                                                                                                                                             13%
                                                        RoE - 2004 (%)                      28.0            20.2
 However, for the past several years, MNCs have         RoE - 2009 (%)                      28.2            19.4
 lost significant share both in terms of number of
 companies and amount of wealth created.

 FY04-09 marks a semblance of the MNC
 resurgence, with number of top wealth creating
 companies more than doubling from 10 to 23 and         MNCs ARE WANING IN WEALTH CREATION BUT RECOVER SOMEWHAT IN 2004-2009
 share of wealth created increasing from 7% to 14%.
 A major factor for this resurgence is FMCG, led by           50                       Top Wealth Creating MNCs                Share of Wealth Created (%)

 ITC, Hindustan Unilever and Nestle.
                                                                               30
                                                            43                              23
                                                                     15
                                                                                                                                                                         14
                                                                                                                                       10
                                                                                                                           7                      7            7
                                                                                                       3           2
                                                                     21        19                                                                                        23
 Key Finding                                                                               16
                                                                                                                                       12         10           10
 PAT CAGR of MNCs is typically lower than that of                                                      10          8        11

 Indian companies. However, they still enjoy premium
 valuations. The main reasons are higher RoE and         1994-99   1995-00   1996-01     1997-02    1998-03    1999-04   2000-05    2001-06    2002-07       2003-08   2004-09
 healthy dividend payout.


17 December 2009   10
Wealth Creation Study 2004-2009                                                                                                         Findings


 Wealth Creators                                         WEALTH CREATORS: STATE-OWNED V/S PRIVATELY-OWNED                    PSU WEALTH CREATION BY SECTOR
                                                                                                   2004-2009
 Classification By                                                                           STATE-OWNED PRIVATE                                   Oil & Gas
                                                                                                                                                                    Others
                                                                                                                                                      23%
 Ownership: State v/s Private                            Number of Wealth Creators in Top 100     16            84                                                   2%
                                                         Share of Wealth Created (%)             27.0          73.0
 PSUs underperform private companies                                                                                                                            Banks
                                                         Sales CAGR (%)                          16.9          24.5              Mining &                        13%
 2004-2009, PSUs (public sector undertakings)            PAT CAGR (%)                            18.2          29.4               Metals
 underperformed their private counterparts on all        Price CAGR (%)                          16.2          22.8
                                                                                                                                  37%
 fronts - sales growth was lower, PAT growth was         P/E - 2004 (x)                          10.9          18.6                                      Engg
 lower, RoE declined and price CAGR was also                                                                                                             25%
                                                         P/E - 2009 (x)                          10.0          14.3
 significantly lower.                                    RoE - 2004 (%)                          22.0          20.1
 Number of PSUs among top wealth creators is the         RoE - 2009 (%)                          20.1          20.1
 lowest in the last six years. In fact, two large PSUs
 - Indian Oil and HPCL - feature among the top 10
 wealth destroyers during 2004-09.                       DEREGULATION DIMINISHES ROLE OF STATE-OWNED COMPANIES IN WEALTH CREATED

 Of the wealth created by the PSUs, 60% came
                                                                                                 No of PSUs       % Wealth Created
 through commodity businesses - Mining & Metals                   48.5                50.6
 (37%) and Oil & Gas (23%).
                                                                                                        35.9
 Key Finding                                                                                                                                34.6
 Assessment of the 16 PSU wealth creators indicates                              30
                                                                 28                                                   24.8                                              27.0
                                                                                                   26
 two key criteria for PSU stocks: (1) those with high                                                                                       25

 regulatory entry barriers -SBI, Punjab National Bank                                                                 18
                                                                                                                                                                   16
 (few new banking licenses), Bharat Electronics (near
 monopoly with defence sector), NMDC (mining
 licenses) and (2) advantage of legacy - GAIL (huge
 pipeline network), and Concor (strong relationships
                                                              1999-2004       2000-2005         2001-2006         2002-2007           2003-2008                 2004-2009
 with Indian Railways for container movement).


17 December 2009   11
Wealth Creation Study 2004-2009                                                                                                  Findings


 Wealth Creators                                        WEALTH CREATORS: CLASSIFICATION BY AGE-GROUP
                                                         NO. OF               NO. OF           WEALTH CREATED             % SHARE            PAT             PRICE
 Classification By                                        YEARS               COS.                  (RS B)                 OF WC        CAGR (%)           CAGR (%)

 Age Group and Market Cap                                   0-10                 7                  1,005                   10.4            83.5              33.7
                                                           11-20                24                  1,646                   17.1            17.4              14.7
 Young for speed, old for size                             21-30                19                  1,303                   13.5            30.7              19.5
 It has been consistently observed through our             31-40                10                  2,746                   28.5            27.7              28.4
 Wealth Creation studies, that young companies (10         41-50                14                  1,115                   11.6            22.4              24.6
 years since incorporation or less) generate the           51-60                13                    667                    6.9            27.0              14.5
 fastest wealth, as they record the highest earnings       61-70                 4                    237                    2.5            31.3              22.4
 growth on a low base.                                     71-80                 2                    229                    2.4             9.6              10.0
                                                           81-90                 3                    147                    1.5            15.8              19.3
 During 2004-09, the 5 companies in the 0-10 years
                                                            >90                  4                    542                    5.6            20.4              20.2
 bracket generated 84% PAT CAGR and 34% price
                                                           Total               100                  9,637                  100.0            24.3              20.5
 CAGR, significantly higher than the average of 24%
 and 21%, respectively.

 Older companies gain in size, but their stock prices   PRICE CAGR AND PAT CAGR BY BASE MARKET CAP RANGE

 tend to appreciate much more slowly.
                                                                                        Price CAGR (%)          PAT CAGR (%)
 Small is beautiful                                       92

 74 of the top 100 wealth creating companies had a             76
 base market cap of less than Rs50b in 2004. These
                                                                         56
 companies grew significantly ahead of average, both                49
 in terms of earnings and stock price.                                          32 35                                                              Avg PAT CAGR: 24%
                                                                                               33         33
                                                                                          28         28                                            Avg Price CAGR: 21%
                                                                                                                 18 19       21 20          22
                                                                                                                                       17
 Key Finding
                                                            <2       2-5         5-10      10-20     20-50       50-100      100-200   >200
 Identifying high-growth companies at an early stage
                                                                                 Base Market Cap Range (Rs b)
 is one of the keys to successful investing.


17 December 2009   12
Wealth Creation Study 2004-2009                                                                                                          Findings


 Wealth Creators                                           WEALTH CREATORS: CLASSIFICATION BY SALES GROWTH

                                                            SALES GR.              NO. OF         SHARE              PRICE    PAT           ROE (%)              P/E (X)
 Classification By                                            RANGE                    COS.        OF WC             CAGR     CAGR
                                                                  (%)                                  (%)            (%)      (%)       2009     2004         2009        2004
 Sales and Earnings Growth
                                                               0-10                       9         2.8              16.0     10.8       15.0     13.7         15.7        12.4
 Growth offers margin of safety                               10-20                      35        29.0              12.7     15.9       20.3     23.4         11.2        12.9
 Clearly, high sales/earnings growth and stock price          20-30                      26        35.0              26.7     28.2       17.6     17.8         13.8        14.6
 growth are positively correlated. Typically, high            30-40                      16        16.5              25.2     40.2       24.7     25.4         14.3        25.2
 growth is accompanied by somewhat premium                    40-50                       9        14.6              34.0     51.9       23.6     19.1         13.8        25.8
 market valuations. However, this should not be a              >50                        5         2.1              43.3     65.8       21.7     13.5          7.9        16.4
 deterrent to buying these stocks.                            Total                     100        100.0             20.5     24.3       20.1     21.0         12.6        14.7


 As can be seen from the adjacent tables, companies
 with sales/earnings growth of over 30% have all
 seen their P/E de-rated in 2009 over 2004. Still, due     PRICE CAGR BY 2004-09 PAT GROWTH RANGE                            CLASSIFICATION BY PAT GROWTH
 to the sheer high growth, their stocks have delivered
 Price CAGR significantly higher than average.                                                                        61     PAT GR.     NO. OF   SHARE OF            P/E (X)
                                                                                                                             RANGE (%)     COS        WC (%)    2009       2004
 Thus, high growth is a major source of margin of                                                                               0-10        12         6.1       18.9      14.1
                                                                                                              42
 safety.                                                                                          36                           10-20        24        22.2       10.8      12.4
                                                                                                                               20-30        18        25.1       13.4      15.6
                                                                                          26
                                                                                  20                                           30-40        17        18.7       14.8      21.3
 Key Finding
                                                             12          13
                                                                                                                               40-50        12         8.5       10.7      14.9
 During 2004-09, the fastest growing sectors were
                                                                                                                               50-70         9        17.1       14.8      30.8
 mainly cyclicals - metals, engineering and real
                                                                                                                                >70          8         2.3        5.4      11.6
 estate. One interesting non-cyclical exception was
                                                            0-10        10-20   20-30    30-40   40-50       50-70    >70      Total       100        100.0      12.6      14.7
 financial services. Going forward too, select financial
                                                                                PAT Growth Range (%)
 services stocks should continue their run of high
 growth, and generate wealth at rapid pace.


17 December 2009   13
Wealth Creation Study 2004-2009                                                                                                Findings


 Wealth Creators                                        WEALTH CREATORS: CLASSIFICATION BY BASE ROE
                                                          2004 ROE     NO. OF    SHARE OF       PRICE                PAT            ROE (%)          P/E (X)
 Classification By                                        RANGE (%)     COS.      WC (%)     CAGR        (%)    CAGR (%)      2009      2004       2009         2004

 RoE                                                          <5             5       1              23               L to L    -2.4     -37.5       -            -
                                                             5-10           13       5              29                 36       15        7        15           20
                                                            10-15           11      19              33                 46       21       12        16           27
 Indian markets prefer growth over quality
                                                            15-20           17      26              22                 23       15       17        13           13
 In Indian markets, Price CAGR has a direct
                                                            20-25           15      16              15                 20       22       22        11           13
 correlation between PAT CAGR but a rather inverse
                                                            25-30           18      16              17                 21       22       26        12           14
 correlation with RoE. Consistently, low base year
                                                            30-40           14       9              24                 37       33       36        11           17
 RoE companies have performed better on the
                                                             >40             7       8              16                 15       31       60        13           12
 markets than their high RoE counterparts by
                                                            Total          100     100              21                 24       20       21        13           15
 delivering superior PAT growth.

 Thus, during 2004-09, companies with 2004 RoE in
 the range of 5-15% have delivered PAT CAGR of          WEALTH CREATORS: PRICE CAGR BY ROE
 36-46%, translating into the highest Price CAGR
 of 29-33%.


                                                                                                           Avg Price CAGR: 21%

                                                                                  33
                                                                      29
                                                            23                                                                                24
                                                                                               22
                                                                                                                15             17                         16


 Key Finding
                                                            <5        5-10       10-15        15-20            20-25          25-30       30-40           >40
 Bargains are found when markets are blind to change.
                                                                                           2004 ROE Range (%)
 Anticipating change in profitability ahead of the
 crowd continues to be rewarded in the markets.


17 December 2009   14
Wealth Creation Study 2004-2009                                                                           Findings


 Wealth Creators                                          WEALTH CREATORS: CLASSIFICATION BY VALUATION PARAMETERS (MARCH 2004)
                                                                                    NO. OF COS       % WEALTH CREATED       PRICE CAGR %
 Classification By                                          P/E (x)
 Valuation Parameters                                       <5                           9                    3                  30
                                                            5-10                        22                   18                  25
                                                            10-15                       21                   32                  18
 Single-digit PE stocks more likely to
                                                            15-20                       19                   14                  18
 outperform
                                                            20-25                       13                   13                  28
 Stocks trading at P/E of less than 5x in 2004 offered
                                                            >25                         16                   20                  20
 a return of 30% compounded for the next five years.
                                                            Total                      100                  100                  21
 This is the highest compared to any other P/E band,
 indicating that stocks bought at single-digit P/Es are     Price/Book (x)
 more likely to outperform.                                 <1                           8                    3                  36
                                                            1-2                         21                    9                  21
 Watch out for Price/Book of less than 1x …                 2-3                         26                   47                  21
 Stocks trading at P/B of less than 1x in 2004 offered      3-4                         14                    6                  18
 a return of 36% compounded for the next five years.        4-5                          6                    8                  21
 All other Price/Book bands just about managed              >5                          25                   26                  19
 average returns.                                           Total                      100                  100                  21

                                                            Price/Sales (x)
 … and Price/Sales of up to 1x
                                                            <0.50                       13                    3                  58
 Stocks trading at Price/Sales of up to 1x in 2004
                                                            0.50-1.00                   12                    9                  31
 offered a return of 31-58% compounded for the next
                                                            1.00-1.50                   17                   24                  24
 five years.
                                                            1.50-2.00                   13                   14                  20
                                                            2.00-3.00                   18                   14                  29
                                                            3.00-5.00                   12                   16                  12
                                                            >5.00                       15                   21                  21
                                                            Total                      100                  100                  21


17 December 2009   15
Wealth Creation Study 2004-2009                                                                              Findings


 Wealth Creators                                           WEALTH CREATORS: CLASSIFICATION BY VALUATION PARAMETERS (MARCH 2004)
                                                                                     NO. OF COS        % WEALTH CREATED       PRICE CAGR %
 Classification By                                           Payback Ratio (x)
 Valuation Parameters (contd.)                               <0.25                        9                    3                   74
                                                             0.25-0.50                   13                   15                   39
 Payback ratio of less than 1x guarantees high               0.50-1.00                   19                   11                   25
 returns                                                     1-1.5                       18                   41                   19
 We define Payback ratio as Market Cap divided by            1.5-2                       25                   22                   21
 profits of the next five years.                             >2                          16                    9                   11
                                                             Total                      100                  100                   21
 When companies are in high growth phase, it is
 difficult to value them using conventional measures.
 Payback ratio is based on empirical wisdom that
 markets try and seek visibility of five years. Clearly,
 lower the payback ratio the better.
                                                           MEDIAN VALUATIONS (X)
 In hindsight, we find that stocks of companies which                                         2004                          2009
 offered a payback ratio of less than 1x in 2004,                                  SENSEX     WEALTH CREATORS      SENSEX   WEALTH CREATORS
 offered significantly high returns.                         Median P/E              16.4            14.6           12.2           14.2
                                                             Median P/B              3.1              2.8           2.2            2.7
 Key Finding                                                 Media P/S               2.3              1.8           2.0            1.9
 A sure shot formula for multi-baggers is -
     P/E of less than 10x
     Price/Book of less than 1x
     Price/Sales of 1x or less
     Payback ratio of 1x or less.

 However, as 2004 median valuations for wealth
 creators indicate, such stocks are not easily found.


17 December 2009    16
Wealth Creation Study 2004-2009                                                                             Findings


 Wealth Destroyers                                       TOP-10 WEALTH DESTROYERS (2004-2009)
                                                           COMPANY                                    WEALTH DESTROYED                PRICE
                                                                                           RS B                    % SHARE           CAGR (%)
                                                           Ranbaxy Labs.                    137                                  8     -19
                                                           IOCL                             129                                  8      -5
 Wealth destroyed is 17% of wealth created                 Tata Motors                      125                                  7     -17
 During 2004-09, Indian stock markets delivered            ICICI Bank                       125                                  7     -21
 compounded return of 12%. Still, there was                HPCL                              81                                  5     -12
 significant wealth destruction of Rs1,782b (17% of        Satyam Computer                   72                                  4     -24
 wealth created).                                          Oriental Bank                     45                                  3     -18
                                                           Tata Steel                        44                                  3      -2
 Most of the wealth destruction was due to company-        Reliance Infra.                   40                                  2      -8
 specific developments - US FDA ban on two units           MTNL                              37                                  2     -12
 of Ranbaxy, JLR acquisition by Tata Motors,               Total of Above                   835                                 49
 accounting scam at Satyam Computer and Corus              Total Wealth Destroyed          1,704                               100
 acquisition by Tata Steel.
                                                         WEALTH DESTRUCTION BY INDUSTRY

 HPCL has featured in the list of top wealth
 destroyers for the third successive year.
                                                                                                      Oil & Gas, 17
 Key Finding                                                                             Banking &
 During the bull run of 2003-08, wealth destroyed was                                   Finance, 16
 only 0.2% of the wealth created. In other words, when                                                            Others, 24

 the markets are buoyant, most stocks participate                                      Auto, 13
 regardless of quality.


 It is only during market downturns (as in FY09) that                                      Pharma, 12              Metals, 6
                                                                                                         IT, 11
 the true, sustainable wealth creators are separated
 from the also-rans.


17 December 2009   17
Wealth Creation Study 2004-2009                                                               Findings


 Wealth Creators
 and
 Entry Barriers
                                                         WEALTH CREATION BY COMPANIES WITH ENTRY BARRIERS
 In the next section of this report, we discuss
                                                           COMPANY                           NO OF     WEALTH CREATED    % OF
 businesses and companies with Entry Barriers.                                             COMPANIES        RS B        TOTAL
                                                           Companies with Entry Barriers       66           8,314         86
 Our study shows that companies with Entry Barriers        Others                              34           1,323         14
 enjoy exponential growth in profits. When bought          Total                              100           9,637        100
 at reasonable valuation, they create significant
 wealth over the long term.

 In fact, the list of top Wealth Creators between 2004
 and 2009 already proves this point. Of the top 100
 Wealth Creators, 66 had strong Entry Barriers. Even
 more interestingly, they accounted for a
 disproportionate 86% share of the wealth created.

 We are convinced this phenomenon will persist in
 the years to come.


17 December 2009   18
Wealth Creation Study 2004-2009


                        THIS PAGE IS INTENTIONALLY LEFT BLANK


17 December 2009   19
Wealth Creation Study 2004-2009   Theme 2009


 Wealth Creation

 2004-2009
 The 14TH Annual Study


Theme 2010


17 December 2009   20
Wealth Creation Study 2004-2009                                                                                                                                           Theme 2009


                                   Winner Categories + Category Winners
                                   Formula for sustained wealth creation in India's NTD Era


                                   Report Outline
                                   The outline of the investment theme covered in this report is as follows -
                                   1. Winner Categories = India's NTD opportunity + Scalability
                                   2. Category Winners = Winner Categories + Entry Barriers + Great management
                                   3. Winning investments = Category Winners + Reasonable valuation

                                   The following pages develop each of the above ideas.


                                   1. Recap of India's NTD Era
                                   1.1 Introduction
      After taking 60 years to     In 2007, we first wrote about India's NTD i.e. Next Trillion Dollars (of GDP). It took India
  get to its first US$1 trillion   over 60 years since independence to create its first US$1 trillion of GDP in FY08. However,
               GDP in FY08 …       growing nominally @ 12-15% per annum and at current US$/INR rates, India will add the
                                   next trillion dollar of GDP in 5-6 years. This journey is currently on.

                                   India's FY10E nominal GDP is estimated at US$1.3 trillion. Assuming 12.4% annual growth
                                   (7% real and 5% inflation), India's GDP in FY15 works out to US$2.3 trillion i.e. addition
                                   of US$1 trillion in the next 5 years.

                                   INDIA SHOULD ADD US$1 TRILLION GDP OVER THE NEXT FIVE YEARS (GDP IN US$ TRILLION)


                                    2.5                                                                                                                                                                                        2.3

                                    2.0                                                                                                                                         12% CAGR


 … India is on its way to add       1.5                                                                                                                                                1.3
                                                                                                                                            16% CAGR
      its NTD (Next Trillion
                                    1.0
  Dollar) in the next 5 years                                                                                                               0.6
                                                                         5% CAGR
                                    0.5


                                    0.0
                                                                                                                                                                                       FY10E
                                                                                                                                                                                               FY11E
                                                                                                                                                                                                       FY12E
                                                                                                                                                                                                               FY13E
                                                                                                                                                                                                                       FY14E
                                                                                                                                                                                                                               FY15E
                                          FY90
                                                 FY91
                                                        FY92
                                                               FY93
                                                                      FY94
                                                                             FY95
                                                                                    FY96
                                                                                           FY97
                                                                                                  FY98
                                                                                                         FY99
                                                                                                                FY00
                                                                                                                       FY01
                                                                                                                              FY02
                                                                                                                                     FY03
                                                                                                                                             FY04
                                                                                                                                                    FY05
                                                                                                                                                           FY06
                                                                                                                                                                  FY07
                                                                                                                                                                         FY08
                                                                                                                                                                                FY09


                                                                                                                                                                                           Source: CMIE/MOSL


                                   1.2 The Chinese experience
       India's NTD journey is      China achieved its first trillion dollar GDP in 1998. It took about six years to add the
      similar to that of China     second trillion in 2005. However, the third trillion took just 3 years, and all of the fourth
     between 1998 and 2005         came in just one year, 2008, when China's GDP hit US$4 trillion. India is hopefully on its
                                   way to mimicking the Chinese experience. Whether we will do it somewhat slower or
                                   faster is just a matter of time.


17 December 2009    21
Wealth Creation Study 2004-2009                                                                                            Theme 2009


                                   CHINA (GDP IN US$ TRILLION)


                                    5
                                                                                                                                                                 4.2
                                    4
        Indian GDP may well
                                                                                                                                                          3.3
      mimic China with a lag        3
           of about 10 years                                                                                                                 1.9
                                    2
                                                                                                                     1.0
                                    1                                                                 0.6

                                    0
                                        1980


                                                    1982


                                                           1984


                                                                    1986


                                                                           1988


                                                                                       1990


                                                                                              1992


                                                                                                       1994


                                                                                                              1996


                                                                                                                      1998


                                                                                                                               2000


                                                                                                                                      2002


                                                                                                                                                   2004


                                                                                                                                                          2006


                                                                                                                                                                       2008
                                                                                                                                      Source: World Bank/MOSL


                                    Minimizing the risk of forecasting
                                    It is said, "Prediction is very difficult, especially if it's about the future." Knowing this, we
                                    have largely relied on hindsight to get a sense of how the NTD Era may play out. Thus,
                                    we believe, India's journey from US$1 trillion to US$2 trillion GDP will broadly be an
                                    extension of its journey from US$0.5 trillion to US$1 trillion GDP.

                                    Further, even US$2 trillion is not a destination, but a milestone in India's ongoing journey
                                    towards US$4 trillion GDP in the subsequent 5-7 years, and so on. Thus, forecasting
                                    error of a year or two on either side is unlikely to have a major long-term impact.

                                   We see a huge consumption and savings/investment boom in India's NTD Era, which will
                                   throw up several Winning Categories. (For the purposes of this report, Winner Categories
                                   are those which are expected to grow annually @ 18%+ i.e. at least 1.5x faster than our
                                   nominal GDP growth rate assumption of ~12%.

                                   1.3 Consumption boom in the NTD Era
    India will see a sustained     In this section, we draw heavily upon McKinsey Global Institute's brilliant report titled
        boom in consumption        The Bird of Gold: The Rise of India's Consumer Market 1 (dated May 2007). The
                                   report captures how growth in GDP will shift India's demographics, which in turn, will
                                   alter the economy's consumption landscape. The key conclusions of the report are -

                                   1.3.1 India's aggregate consumption to quadruple during 2005-25

                                    Aggregate consumption                                                                    Household income brackets
                                                                                  4x                            70
                                    across income brackets                                                                   '000 Indian rupees, 2000
  By 2025, India is poised to                                                                                   14           Globals (>1,000)
                                    trillion, Indian rupees, 2000
     become the world's fifth
                                                                                                                16           Strivers (500-1,000)
  largest consuming country
                                                                                                 34                                                              Middle
       from current position                                                                      4      3                                                       Class
                                                                                                                25           Seekers (200-500)
                     of twelfth
                                                                                  17             12
                                                                  10 1                    2
                                                7                                                                            Aspirers (90-200)
                                                      1               3           9              12             12
                                                5                  5              4               3                          Deprived (<90)
1 - The report can be downloaded                                                                                 2
from www.mckinsey.com/mgi                      1985           1995           2005              2015           2025
                                                                                                                              Source: McKinsey Global Institute

17 December 2009    22
Wealth Creation Study 2004-2009                                                                         Theme 2009


YEAR    INFLATOR / (DEFLATOR) - X    CONVERTING CONSTANT RUPEES TO CURRENT VALUE
2005               1.3               One small challenge in McKinsey Global Institute's report is that all rupee values are expressed in
2015               2.1               constant 2000 rupee terms. The numbers may sometimes be better understood if re-stated in current
2025               3.4               value terms.

                                     This can be done by bringing in the inflation factor. Assuming inflation at about 5%, the 2005 numbers
                                     needs to be multiplied by an inflation factor of 1.3x, 2015 numbers by 2.1x and 2025 numbers by 3.4x.

                                     Thus, for instance, projected 2025 aggregate consumption at then market value works out to Rs237
                                     trillion, compared to Rs26 trillion in FY08, a CAGR of ~14%.


                                    1.3.2 Poverty will fall sharply
                                    Deprived class will fall from 93% in 1985 and 54% in 2005 to 22% by 2025. (Deprived
                                    class is defined as households with income less than Rs90,000 pa, in constant 2000 rupees).

                                    POVERTY WILL DECLINE FROM 93% IN 1985 TO 22% BY 2025

                                      Share of population in each income brackets                                   Household income brackets
                                      %, millions of people                                                         '000 Indian rupees, 2000
                                           755            928     1,107      1,278                     1,429
                                    100%     6                      4                                               Globals (>1,000)
                                                                                                         9
                                                           18                 19                                    Strivers (500-1,000)
                                                                            41                             32       Seekers (200-500)
       Poverty will continue to                                                             43
                fall sharply …               93
                                                           80                                              36       Aspirers (90-200)
                                                                            54
                                                                                            35
                                                                                                           22       Deprived (<90)


                                          1985            1995          2005                2015       2025

                                                                                                                   Source: McKinsey Global Institute


                                    1.3.3 Middle class will swell 12x from 50m in 2005 to 583m by 2025
                                    1985 to 2005 saw a wave of 400m Aspirers (i.e. people moving out of poverty); 2005 to
                                    2025 will see a tsunami of over 400m Seekers (i.e. lower middle class) and 120m Strivers
                                    (i.e. upper middle class), further fuelling the consumption boom.

                                    FIRST ASPIRERS AND THEN SEEKERS WILL BECOME THE LARGEST INCOME BRACKETS

                                     Number of households in each income brackets                                    Household income brackets
                                     %, millions of people                                                           '000 Indian rupees, 2000
                                    140
                                                                   Actual        Forecast
                                    120
                                                                                                                    Aspirers (90-200)
                                    100
                                                                                                                    Seekers (200-500)
  … and India's middle class
                                     80
                  will swell
                                     60
                                                                                                                    Deprived (<90)
                                     40
                                                                                                                    Strivers (500-1,000)
                                     20

                                      0                                                                             Globals (>1,000)
                                      1985        1990   1995    2000   2005       2010      2015   2020    2025

                                                                                                                   Source: McKinsey Global Institute

17 December 2009     23
Wealth Creation Study 2004-2009                                                                     Theme 2009


                                1.3.4 Discretionary spend will increase from 52% in 2005 to 70% in 2025
                                SPENDING PATTERNS WILL EVOLVE MARKEDLY OVER THE NEXT 20 YEARS


                                 Share of average households consumption                                       Discretionary spending
                                 %, '000 Indian rupees, 2000                                                   Necessities
                                           60             82              140                   248
                                 100%       4   3          7               9
                                                1          5                                    13        Health care
                                           11                    2          6
                                                                            3                    9        Education & recreation
                                           4              17                                     6
Discretionary spend will rise                   2                          19                             Communication
                                           14              8
         @ 10% in real terms                                     3                              20        Transporation
                                            5                                 9
                                                          12                        3
                                                           6                  12                11        Personal Products & Services
                                                                                                        3 Household Product
                                                                               5                 10       Housing & Utilities
                                           56                                                     5       Apparel
                                                          42
                                                                              34
                                                                                                 25       Food, beverages,& Tobacco


                                         1995            2005             2015                  2025
                                                                                                        Source: McKinsey Global Institute

                                1.3.5 Several categories will grow exponentially
                                There will be a significant rise in consumption pie for Alcoholic beverages, Transport
                                vehicles, Healthcare services, Education & recreation and Communication.
                                CATEGORY GROWTH TRENDS (RS BILLION, CONSTANT 2000 PRICES)

                                CATEGORY                               2005        % SHARE              2015      % SHARE          CAGR (%)

                                Food, beverages, tobacco              7,147              21.7         11,547            17.9            4.9
                                  Food                                6,565              20.0         10,366            16.1            4.7
                                  Non-alcoholic beverages               346               1.1            750             1.2            8.0
                                  Alcoholic beverages                   115               0.3            291             0.5            9.7
                                  Tobacco                               121               0.4            139             0.2            1.4
                                Transportation                        2,788               8.5          6,395             9.9            8.7
                                  Fuel                                1,008               3.1          3,024             4.7           11.6
                                  Services                            1,633               5.0          2,968             4.6            6.2
Food will remain the largest      Two-wheelers                           99               0.3            250             0.4            9.7
  category; Communication         Cars, UVs *                            49               0.1            153             0.2           12.1
                                Housing, Utilities, etc                2,019              6.1          4,032          6.3               7.2
    and Transportation will
                                Personal Products & Services           1,273              3.9          3,044          4.7               9.1
            grow the fastest      Personal and household services        987              3.0          2,301          3.6               8.8
                                  Personal non-durables                  256              0.8            673          1.0              10.1
                                  Jewelry                                 30              0.1             70          0.1               8.8
                                Healthcare                             1,148              3.5          3,076          4.8              10.4
                                  Medical services / equipment           364              1.1          1,835          2.8              17.6
                                  Pharmaceuticals                        784              2.4          1,241          1.9               4.7
                                Apparel and footwear                     931              2.8          1,847          2.9               7.1
                                Education and recreation               1,198              3.6          3,195          5.0              10.3
                                  Education                            1,148              3.5          3,076          4.8              10.4
                                  Recreation                              50              0.2            119          0.2               9.1
                                Household products                       484              1.5            959          1.5               7.1
                                Communication                            344              1.0          1,090          1.7              12.2
                                Total                                 32,892            100.0         64,456       100.0                7.0
                                * Excludes vehicles registered with companies                            Source: McKinsey Global      Institute

                                1.3.6 Implications for the NTD Era
                                    Sustained consumption boom led by the middle class
                                    Several potential Winner Categories - Processed foods, Alcoholic beverages, 2-
                                    wheelers & cars, Auto finance, Airlines, White goods, Entertainment media, Telecom,
                                    Education and Healthcare.

17 December 2009   24
14TH ANNUAL WEALTH CREATION STUDY HIGHLIGHTS INDIA'S NEXT TRILLION DOLLAR ERA

More Related Content

What's hot

Bajaj Corp ltd (NSE Code BAJAJCORP) - Jul'12 Katalyst Wealth Alpha Recommenda...
Bajaj Corp ltd (NSE Code BAJAJCORP) - Jul'12 Katalyst Wealth Alpha Recommenda...Bajaj Corp ltd (NSE Code BAJAJCORP) - Jul'12 Katalyst Wealth Alpha Recommenda...
Bajaj Corp ltd (NSE Code BAJAJCORP) - Jul'12 Katalyst Wealth Alpha Recommenda...Katalyst Wealth
 
Grant Thornton - India Watch Issue 16 - Indian companies listed on the London...
Grant Thornton - India Watch Issue 16 - Indian companies listed on the London...Grant Thornton - India Watch Issue 16 - Indian companies listed on the London...
Grant Thornton - India Watch Issue 16 - Indian companies listed on the London...Grant Thornton
 
Aditya Birla Private Equity
Aditya Birla Private EquityAditya Birla Private Equity
Aditya Birla Private EquityKunaldoshi
 
Vc Circle The Deal Outlook 2009
Vc Circle   The Deal Outlook 2009Vc Circle   The Deal Outlook 2009
Vc Circle The Deal Outlook 2009Jose Gonzalez
 
Research Report-SRF
Research Report-SRFResearch Report-SRF
Research Report-SRFAshok Lodha
 
Easy gold presentation
Easy gold presentationEasy gold presentation
Easy gold presentationAmit Kumar
 
Equity Research Of Colgate Palmolive Imppppppp
Equity Research Of Colgate Palmolive ImpppppppEquity Research Of Colgate Palmolive Imppppppp
Equity Research Of Colgate Palmolive Impppppppshyamal0086
 
India and sweden strategy brochure 2013 riskpro
India and sweden strategy brochure 2013 riskproIndia and sweden strategy brochure 2013 riskpro
India and sweden strategy brochure 2013 riskproRahul Bhan (CA, CIA, MBA)
 
India and sweden strategy brochure 2013 riskpro
India and sweden strategy brochure 2013 riskproIndia and sweden strategy brochure 2013 riskpro
India and sweden strategy brochure 2013 riskproRahul Bhan (CA, CIA, MBA)
 
Marico presentation final
Marico presentation finalMarico presentation final
Marico presentation finalAmit Trivedi
 
Mergers, Acquisition and corporate restructuring- Case Analysis
Mergers, Acquisition and corporate restructuring- Case AnalysisMergers, Acquisition and corporate restructuring- Case Analysis
Mergers, Acquisition and corporate restructuring- Case AnalysisSpartanski
 
Oberoi realty ipo-061010
Oberoi realty   ipo-061010Oberoi realty   ipo-061010
Oberoi realty ipo-061010Angel Broking
 

What's hot (19)

Bajaj Corp ltd (NSE Code BAJAJCORP) - Jul'12 Katalyst Wealth Alpha Recommenda...
Bajaj Corp ltd (NSE Code BAJAJCORP) - Jul'12 Katalyst Wealth Alpha Recommenda...Bajaj Corp ltd (NSE Code BAJAJCORP) - Jul'12 Katalyst Wealth Alpha Recommenda...
Bajaj Corp ltd (NSE Code BAJAJCORP) - Jul'12 Katalyst Wealth Alpha Recommenda...
 
Morning news &_views_-_10012013
Morning news &_views_-_10012013Morning news &_views_-_10012013
Morning news &_views_-_10012013
 
Grant Thornton - India Watch Issue 16 - Indian companies listed on the London...
Grant Thornton - India Watch Issue 16 - Indian companies listed on the London...Grant Thornton - India Watch Issue 16 - Indian companies listed on the London...
Grant Thornton - India Watch Issue 16 - Indian companies listed on the London...
 
Aditya Birla Private Equity
Aditya Birla Private EquityAditya Birla Private Equity
Aditya Birla Private Equity
 
Spiva mid2011
Spiva mid2011Spiva mid2011
Spiva mid2011
 
Vc Circle The Deal Outlook 2009
Vc Circle   The Deal Outlook 2009Vc Circle   The Deal Outlook 2009
Vc Circle The Deal Outlook 2009
 
Research Report-SRF
Research Report-SRFResearch Report-SRF
Research Report-SRF
 
Easy gold presentation
Easy gold presentationEasy gold presentation
Easy gold presentation
 
Equity Research Of Colgate Palmolive Imppppppp
Equity Research Of Colgate Palmolive ImpppppppEquity Research Of Colgate Palmolive Imppppppp
Equity Research Of Colgate Palmolive Imppppppp
 
Morning news &_views_-_09012013
Morning news &_views_-_09012013Morning news &_views_-_09012013
Morning news &_views_-_09012013
 
India and sweden strategy brochure 2013 riskpro
India and sweden strategy brochure 2013 riskproIndia and sweden strategy brochure 2013 riskpro
India and sweden strategy brochure 2013 riskpro
 
India and sweden strategy brochure 2013 riskpro
India and sweden strategy brochure 2013 riskproIndia and sweden strategy brochure 2013 riskpro
India and sweden strategy brochure 2013 riskpro
 
Shave code bdp 2012 2014
Shave code bdp 2012 2014Shave code bdp 2012 2014
Shave code bdp 2012 2014
 
CP Artha morning notes-09 april 2013
CP Artha morning notes-09 april 2013CP Artha morning notes-09 april 2013
CP Artha morning notes-09 april 2013
 
Marico presentation final
Marico presentation finalMarico presentation final
Marico presentation final
 
India entry strategy brochure 2013
India entry strategy brochure 2013India entry strategy brochure 2013
India entry strategy brochure 2013
 
Mergers, Acquisition and corporate restructuring- Case Analysis
Mergers, Acquisition and corporate restructuring- Case AnalysisMergers, Acquisition and corporate restructuring- Case Analysis
Mergers, Acquisition and corporate restructuring- Case Analysis
 
India entry strategy brochure 2013
India entry strategy brochure 2013India entry strategy brochure 2013
India entry strategy brochure 2013
 
Oberoi realty ipo-061010
Oberoi realty   ipo-061010Oberoi realty   ipo-061010
Oberoi realty ipo-061010
 

Viewers also liked

Unmetro India - Peter Suresh
Unmetro India - Peter SureshUnmetro India - Peter Suresh
Unmetro India - Peter SureshPeter Suresh
 
Och Du Trodde 3
Och Du Trodde  3Och Du Trodde  3
Och Du Trodde 3manta75
 
Milk Buddy-Presentation 3
Milk Buddy-Presentation 3Milk Buddy-Presentation 3
Milk Buddy-Presentation 3Cheryl Joy Lek
 
Cristian Martin Reinhold CV
Cristian Martin Reinhold CVCristian Martin Reinhold CV
Cristian Martin Reinhold CVcreinhold
 
Sprout Up2009 Prez
Sprout Up2009 PrezSprout Up2009 Prez
Sprout Up2009 Prezzerobaggage
 
Milk Buddy - 2nd presentation!
Milk Buddy - 2nd presentation!Milk Buddy - 2nd presentation!
Milk Buddy - 2nd presentation!Cheryl Joy Lek
 
Temex Ceramics
Temex CeramicsTemex Ceramics
Temex Ceramicsmacfly2000
 
Our Gates
Our GatesOur Gates
Our Gatesg8pro
 
Informe Gestion Educativa 2008
Informe Gestion Educativa 2008Informe Gestion Educativa 2008
Informe Gestion Educativa 2008guestb44256
 
Kertas kerja minggu bahasa arab
Kertas kerja minggu bahasa arabKertas kerja minggu bahasa arab
Kertas kerja minggu bahasa arabAkma Zhar
 
English year 1 ub1 2016
English year 1 ub1 2016English year 1 ub1 2016
English year 1 ub1 2016Akma Zhar
 
Taxation in redevelopment of Property
Taxation in redevelopment of PropertyTaxation in redevelopment of Property
Taxation in redevelopment of PropertyMeridien Bcpl
 
Building redevelopment referencer 27-09-2015-protected
Building redevelopment referencer   27-09-2015-protectedBuilding redevelopment referencer   27-09-2015-protected
Building redevelopment referencer 27-09-2015-protectedspandane
 
Preparing The Table of Specification
Preparing The Table of SpecificationPreparing The Table of Specification
Preparing The Table of SpecificationMary Eunice Quijano
 
Preparing table of specification for Grade 7 and Grade 8
Preparing table of specification for Grade 7 and Grade 8Preparing table of specification for Grade 7 and Grade 8
Preparing table of specification for Grade 7 and Grade 8Dominic Bais
 
Mecanica de-fluidos-ejercicios
Mecanica de-fluidos-ejerciciosMecanica de-fluidos-ejercicios
Mecanica de-fluidos-ejerciciosbriam mallqui
 

Viewers also liked (20)

Unmetro India - Peter Suresh
Unmetro India - Peter SureshUnmetro India - Peter Suresh
Unmetro India - Peter Suresh
 
Shuffleworks -ArchiX
Shuffleworks -ArchiXShuffleworks -ArchiX
Shuffleworks -ArchiX
 
Och Du Trodde 3
Och Du Trodde  3Och Du Trodde  3
Och Du Trodde 3
 
ross hamill
ross hamillross hamill
ross hamill
 
Milk Buddy-Presentation 3
Milk Buddy-Presentation 3Milk Buddy-Presentation 3
Milk Buddy-Presentation 3
 
Cristian Martin Reinhold CV
Cristian Martin Reinhold CVCristian Martin Reinhold CV
Cristian Martin Reinhold CV
 
Sprout Up2009 Prez
Sprout Up2009 PrezSprout Up2009 Prez
Sprout Up2009 Prez
 
Milk Buddy - 2nd presentation!
Milk Buddy - 2nd presentation!Milk Buddy - 2nd presentation!
Milk Buddy - 2nd presentation!
 
Temex Ceramics
Temex CeramicsTemex Ceramics
Temex Ceramics
 
Chapter2 1
Chapter2 1Chapter2 1
Chapter2 1
 
Our Gates
Our GatesOur Gates
Our Gates
 
Bones Of The Body
Bones Of The  BodyBones Of The  Body
Bones Of The Body
 
Informe Gestion Educativa 2008
Informe Gestion Educativa 2008Informe Gestion Educativa 2008
Informe Gestion Educativa 2008
 
Kertas kerja minggu bahasa arab
Kertas kerja minggu bahasa arabKertas kerja minggu bahasa arab
Kertas kerja minggu bahasa arab
 
English year 1 ub1 2016
English year 1 ub1 2016English year 1 ub1 2016
English year 1 ub1 2016
 
Taxation in redevelopment of Property
Taxation in redevelopment of PropertyTaxation in redevelopment of Property
Taxation in redevelopment of Property
 
Building redevelopment referencer 27-09-2015-protected
Building redevelopment referencer   27-09-2015-protectedBuilding redevelopment referencer   27-09-2015-protected
Building redevelopment referencer 27-09-2015-protected
 
Preparing The Table of Specification
Preparing The Table of SpecificationPreparing The Table of Specification
Preparing The Table of Specification
 
Preparing table of specification for Grade 7 and Grade 8
Preparing table of specification for Grade 7 and Grade 8Preparing table of specification for Grade 7 and Grade 8
Preparing table of specification for Grade 7 and Grade 8
 
Mecanica de-fluidos-ejercicios
Mecanica de-fluidos-ejerciciosMecanica de-fluidos-ejercicios
Mecanica de-fluidos-ejercicios
 

Similar to 14TH ANNUAL WEALTH CREATION STUDY HIGHLIGHTS INDIA'S NEXT TRILLION DOLLAR ERA

Motilal oswal 17th wealth creation study presentation economic moat - dec 2012
Motilal oswal 17th wealth creation study presentation   economic moat - dec 2012Motilal oswal 17th wealth creation study presentation   economic moat - dec 2012
Motilal oswal 17th wealth creation study presentation economic moat - dec 2012Varad Laghate
 
India - are we ready for reit in commercial real estate, game changes, taxati...
India - are we ready for reit in commercial real estate, game changes, taxati...India - are we ready for reit in commercial real estate, game changes, taxati...
India - are we ready for reit in commercial real estate, game changes, taxati...Anil GROVER
 
Indian Tobacco Corporation Ltd
Indian Tobacco Corporation LtdIndian Tobacco Corporation Ltd
Indian Tobacco Corporation LtdShradha Diwan
 
Fundamental analysis
Fundamental analysisFundamental analysis
Fundamental analysisDhaval Dedhia
 
Taylor Frigon Open House, July 2012
Taylor Frigon Open House, July 2012Taylor Frigon Open House, July 2012
Taylor Frigon Open House, July 2012dmathisen
 
Taylor Frigon Capital Management Open House, July 2012
Taylor Frigon Capital Management Open House, July 2012Taylor Frigon Capital Management Open House, July 2012
Taylor Frigon Capital Management Open House, July 2012dmathisen
 
Return-from-Indian-Private-Equity_1
Return-from-Indian-Private-Equity_1Return-from-Indian-Private-Equity_1
Return-from-Indian-Private-Equity_1Gaurav Aggarwal
 
Strategy and Finance for Starups@IISc
Strategy and Finance for Starups@IISc Strategy and Finance for Starups@IISc
Strategy and Finance for Starups@IISc Kazuaki ODA
 
Multibagger stock ideas
Multibagger stock ideasMultibagger stock ideas
Multibagger stock ideasAnkit Goyal
 
Road ahead - Murugappa Presentation
Road ahead - Murugappa PresentationRoad ahead - Murugappa Presentation
Road ahead - Murugappa PresentationPixel
 
Cera Sanitaryware Ltd - HBJ Capital's Business Insight Stock Reco
Cera Sanitaryware Ltd - HBJ Capital's Business Insight Stock RecoCera Sanitaryware Ltd - HBJ Capital's Business Insight Stock Reco
Cera Sanitaryware Ltd - HBJ Capital's Business Insight Stock RecoHBJ Capital Services Pvt. Ltd
 

Similar to 14TH ANNUAL WEALTH CREATION STUDY HIGHLIGHTS INDIA'S NEXT TRILLION DOLLAR ERA (20)

Motilal oswal 17th wealth creation study presentation economic moat - dec 2012
Motilal oswal 17th wealth creation study presentation   economic moat - dec 2012Motilal oswal 17th wealth creation study presentation   economic moat - dec 2012
Motilal oswal 17th wealth creation study presentation economic moat - dec 2012
 
Wealth Creation Study 2004-2009
Wealth Creation Study 2004-2009Wealth Creation Study 2004-2009
Wealth Creation Study 2004-2009
 
India - are we ready for reit in commercial real estate, game changes, taxati...
India - are we ready for reit in commercial real estate, game changes, taxati...India - are we ready for reit in commercial real estate, game changes, taxati...
India - are we ready for reit in commercial real estate, game changes, taxati...
 
Wealth Creation Study 2008-2013
Wealth Creation Study 2008-2013Wealth Creation Study 2008-2013
Wealth Creation Study 2008-2013
 
ppts of project
ppts of projectppts of project
ppts of project
 
Indian Tobacco Corporation Ltd
Indian Tobacco Corporation LtdIndian Tobacco Corporation Ltd
Indian Tobacco Corporation Ltd
 
Fundamental analysis
Fundamental analysisFundamental analysis
Fundamental analysis
 
Wealth Creation Study 2007-2012
Wealth Creation Study 2007-2012Wealth Creation Study 2007-2012
Wealth Creation Study 2007-2012
 
Taylor Frigon Open House, July 2012
Taylor Frigon Open House, July 2012Taylor Frigon Open House, July 2012
Taylor Frigon Open House, July 2012
 
Taylor Frigon Capital Management Open House, July 2012
Taylor Frigon Capital Management Open House, July 2012Taylor Frigon Capital Management Open House, July 2012
Taylor Frigon Capital Management Open House, July 2012
 
Return-from-Indian-Private-Equity_1
Return-from-Indian-Private-Equity_1Return-from-Indian-Private-Equity_1
Return-from-Indian-Private-Equity_1
 
Wealth Creation Study 2000-2005
Wealth Creation Study 2000-2005Wealth Creation Study 2000-2005
Wealth Creation Study 2000-2005
 
Corporate Governance
Corporate Governance Corporate Governance
Corporate Governance
 
Relative valuation
Relative valuationRelative valuation
Relative valuation
 
Strategy and Finance for Starups@IISc
Strategy and Finance for Starups@IISc Strategy and Finance for Starups@IISc
Strategy and Finance for Starups@IISc
 
Multibagger stock ideas
Multibagger stock ideasMultibagger stock ideas
Multibagger stock ideas
 
Road ahead - Murugappa Presentation
Road ahead - Murugappa PresentationRoad ahead - Murugappa Presentation
Road ahead - Murugappa Presentation
 
Cera Sanitaryware Ltd - HBJ Capital's Business Insight Stock Reco
Cera Sanitaryware Ltd - HBJ Capital's Business Insight Stock RecoCera Sanitaryware Ltd - HBJ Capital's Business Insight Stock Reco
Cera Sanitaryware Ltd - HBJ Capital's Business Insight Stock Reco
 
Mutual fund
Mutual fundMutual fund
Mutual fund
 
Mutual Funds Research Reports
Mutual Funds Research ReportsMutual Funds Research Reports
Mutual Funds Research Reports
 

14TH ANNUAL WEALTH CREATION STUDY HIGHLIGHTS INDIA'S NEXT TRILLION DOLLAR ERA

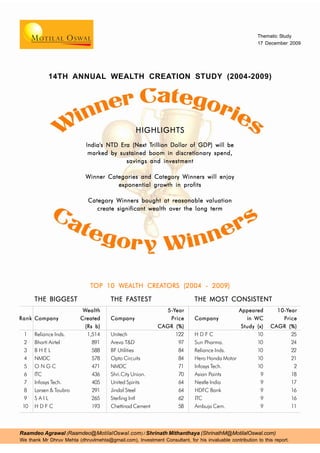
  • 1. Thematic Study 17 December 2009 14TH ANNUAL WEALTH CREATION STUDY (2004-2009) HIGHLIGHTS India's NTD Era (Next Trillion Trillion Dollar of GDP) will be marked by sustained boom in discretionary spend, savings and investment Winner Categories and Category Winners will enjoy exponential growth in profits Category Winners bought at reasonable valuation create significant wealth over the long term TOP 10 WEALTH CREATORS (200 4 - 200 9) WEALTH CREAT (2004 2009 THE BIGGEST THE FASTEST THE MOST CONSISTENT Wealth 5-Year 5-Y Appeared 10-Year 10-Y Rank Company Created Company Price Company in WC Price (Rs b) CAGR (%) Study (x) CAGR (%) 1 Reliance Inds. 1,514 Unitech 122 HDFC 10 25 2 Bharti Airtel 891 Areva T&D 97 Sun Pharma. 10 24 3 BHEL 588 BF Utilities 84 Reliance Inds. 10 22 4 NMDC 578 Opto Circuits 84 Hero Honda Motor 10 21 5 ONGC 471 NMDC 71 Infosys Tech. 10 2 6 ITC 436 Shri.City Union. 70 Asian Paints 9 18 7 Infosys Tech. 405 United Spirits 64 Nestle India 9 17 8 Larsen & Toubro 291 Jindal Steel 64 HDFC Bank 9 16 9 SAIL 265 Sterling Intl 62 ITC 9 16 10 HDFC 193 Chettinad Cement 58 Ambuja Cem. 9 11 Raamdeo Agrawal (Raamdeo@MotilalOswal.com ) / Shrinath Mithanthaya (ShrinathM@MotilalOswal.com) We thank Mr Dhruv Mehta (dhruvlmehta@gmail.com), Investment Consultant, for his invaluable contribution to this report.
  • 2. Wealth Creation Study 2004-2009 Contents Objective, Concept and Methodology ........................................................................ 3 Wealth Creation Study 2004-2009: Findings ......................................................... 4-18 Theme 2010: Winner Categories + Category Winners ...................................... 20-34 Market Outlook .................................................................................................... 36-39 Appendix I: MOSL 100 – Biggest Wealth Creators .......................................... 41-42 Appendix II: MOSL 100 – Fastest Wealth Creators ......................................... 43-44 Appendix III: MOSL 100 – Wealth Creators (alphabetical).............................. 45-46 Abbreviations and Terms used in this report ABBREVIATION / TERM DESCRIPTION 2004, 2009, etc Reference to years for India are financial year ending March, unless otherwise stated Avg Average CAGR Compound Annual Growth Rate; All CAGR calculations are for 2004 to 2009 unless otherwise stated L to P / P to L Loss to Profit / Profit to Loss. In such cases, calculation of PAT CAGR is not possible Price CAGR In the case of aggregates, Price CAGR refers to Market Cap CAGR RS B Indian Rupees in billion WC Wealth Creation / Wealth Created Wealth Created Increase in Market Capitalization over the last 5 years, duly adjusted for corporate events such as fresh equity issuance, mergers, demergers, share buybacks, etc. 17 December 2009 2
  • 3. Wealth Creation Study 2004-2009 Wealth Creation Study 2004-2009 Objective, Concept and Methodology Objective The foundation of Wealth Creation is in buying businesses at a price substantially lower than their “intrinsic value” or “expected value”. The lower the market value is compared to the intrinsic value, the higher is the margin of safety. In this year’s study, we continue our endeavor to cull out the characteristics of businesses, which create value for their shareholders. As Phil Fisher says, “It seems logical that even before thinking of buying any common stock, the first step is to see how money has been most successfully made in the past.” Our Wealth Creation studies are attempts to study the past as a guide to the future and gain insights into How to Value a Business. Concept Wealth Creation is the process by which a company enhances the market value of the capital entrusted to it by its shareholders. It is a basic measure of success for any commercial venture. Wealth Creation is achieved by the rational actions of a company in a sustained manner. Methodology For the purpose of our study*, we have identified the top 100 Wealth Creators in the Indian stock market for the period 2004-2009. These companies have the distinction of having added at least Rs1b to their market capitalization over this period of five years, after adjusting for dilution. We have termed the group of Wealth Creators as the ‘MOSL - 100’. The biggest and fastest Wealth Creators have been listed in Appendix I and II on page 41 and 43, respectively. Ranks have been accorded on the basis of Size and Speed of Wealth Creation (speed is price CAGR during the period under study). On the cover page, we have presented the top 10 companies in terms of Size of Wealth Creation (called THE BIGGEST), the top 10 companies in terms of Speed of Wealth Creation (called THE FASTEST), and the top 10 companies in terms of their frequency of appearance as wealth creators in our Wealth Creation studies (called THE MOST CONSISTENT). Theme 2010 Our Theme for 2010 is Winner Categories + Category Winners, discussion on which starts from page 20. * Capitaline database has been used for this study 17 December 2009 3
  • 4. Wealth Creation Study 2004-2009 Findings Wealth Creation 2004-2009 The 14TH Annual Study Findings 17 December 2009 4
  • 5. Wealth Creation Study 2004-2009 Findings Wealth Creation TOP 10 BIGGEST WEALTH CREATORS RANK COMPANY NET WEALTH CREATED PRICE PAT P/E (X) 2004-2009 RS B % SHARE CAGR (%) CAGR (%) FY09 FY04 1 Reliance Inds. 1,514 15.6 28.3 24.3 15.7 14.6 The Biggest Wealth Creators 2 Bharti Airtel 891 9.2 32.3 68.9 14.8 49.0 Reliance Industries is No.1 3 BHEL 588 6.1 37.8 36.7 23.5 22.5 Reliance Industries has emerged as the biggest 4 NMDC 578 6.0 70.6 58.8 14.2 9.9 wealth creator for the third time in a row. 5 ONGC 471 4.9 6.8 13.2 10.3 13.8 6 ITC 436 4.5 21.6 15.4 21.4 16.2 Although the absolute wealth created is lower than 7 Infosys Tech. 405 4.2 16.5 36.2 13.0 26.5 the previous two years, its share in total wealth 8 Larsen & Toubro 291 3.0 36.2 45.6 11.3 13.4 created has increased - 11.4% in FY07, 12% in 9 SAIL 265 2.7 24.5 19.7 6.5 5.3 FY08 and 15.6% in FY09. 10 HDFC 193 2.0 17.0 21.8 17.6 18.6 For the last six years, the biggest wealth creator in India has emerged from Oil & Gas - the first three BIGGEST WEALTH CREATORS AND WEALTH CREATED (RS B): OIL & GAS DOMINATES years led by ONGC and next three by Reliance. 2009 1,514 Reliance Inds Six companies have featured in the top 10 wealth 2008 3,077 Reliance Inds 2007 1,856 Reliance Inds creators for three consecutive years - Reliance, 2006 1,678 ONGC Bharti, ONGC, BHEL, L&T and SAIL. 2005 1,065 ONGC 2004 1,030 ONGC Key Finding 2003 245 Wipro Reliance has commenced gas production in KG- 2002 383 Wipro D6 basin, and continues to aggressively pursue its 2001 377 Hind. Lever other E&P activity. In FY10, it has also merged 2000 1,247 Wipro Reliance Petroleum with itself. Further, its closest 1999 341 Hind. Lever 1998 262 Hind. Lever competitor in wealth creation - Bharti - is facing 1997 73 Hind. Lever sector headwinds. Thus, Reliance is likely to sustain 91 1996 Hind. Lever its top position for the next couple of years at least. 17 December 2009 5
  • 6. Wealth Creation Study 2004-2009 Findings Wealth Creation TOP 10 FASTEST WEALTH CREATORS RANK COMPANY PRICE PRICE PAT MCAP (RS B) P/E (X) 2004-2009 APPREN. (X) CAGR (%) CAGR (%) FY09 FY04 FY09 FY04 1 Unitech 54 122 121 56.7 1.1 7.7 7.6 The Fastest Wealth Creators 2 Areva T&D 29 97 68 48.6 1.4 21.5 8.1 Unitech is No.1 3 BF Utilities 21 84 L to P 12.1 0.6 260.5 - Unitech is the Fastest Wealth Creator during 4 Opto Circuits 21 84 61 16.3 0.7 11.6 5.1 2004-09, for the second time in a row. 5 NMDC 14 71 59 621.3 43.0 14.2 9.9 6 Shri.City Union. 14 70 45 14.9 0.6 12.7 3.4 Its 5-year stock price CAGR is a staggering 122%, 7 United Spirits 12 64 69 65.1 2.8 21.9 13.2 albeit significantly lower than the last year figure of 8 Jindal Steel 12 64 38 185.9 15.8 12.1 5.2 284%. 9 Sterling Intl 11 62 -32 36.0 3.2 - 17.4 10 Chettinad Cement 10 58 P to L 13.5 1.4 - 9.9 Unitech has featured among the Top 10 fastest wealth creators for the last four years in a row, B F Utilities for the last three years and NMDC for the HISTORY OF FASTEST WEALTH CREATOR (PRICE APPRECIATION - X) last two years. 2009 54 Unitech 2008 837 Unitech This year, NMDC has the unique distinction of 2007 665 B F Utilities featuring in both the biggest and the fastest wealth 2006 182 Matrix Labs 2005 136 Matrix Labs creators list. 2004 75 Matrix Labs 2003 50 e-Serve 2002 69 Wipro Key Finding 2001 66 Infosys In nine of the top 10 fastest wealth creators, at least 2000 223 SSI two of the following three conditions hold true: (1) 1999 75 Satyam Computers Base market cap less than Rs4b, (2) Base P/E in 1998 23 Satyam Computers 1997 7 Cipla single digit, and (3) PAT growth of over 35%. In six 30 Dr Reddy's Labs 1996 cases, all the three hold true. 17 December 2009 6
  • 7. Wealth Creation Study 2004-2009 Findings TOP 10 CONSISTENT WEALTH CREATORS Wealth Creation RANK COMPANY APPEARED IN LAST 10-YR PRICE PAT P/E (X) 2004-2009 10 WC STUDIES (X) CAGR (%) CAGR (%) 2009 2004 1 HDFC 10 24.9 21.8 17.6 18.6 Most Consistent Wealth Creators 2 Sun Pharma. 10 24.0 39.4 18.2 25.1 3 Reliance Inds. 10 21.9 24.3 15.7 14.6 HDFC is Most Consistent 4 Hero Honda Motor 10 20.9 12.0 16.7 13.4 Five companies - HDFC, Sun Pharma, Reliance 5 Infosys Tech. 10 2.0 36.2 13.0 26.5 Inds, Hero Honda and Infosys - have featured 6 Asian Paints 9 18.0 19.7 20.8 19.7 among the top 100 wealth creators in each of the 7 Nestle India 9 17.2 15.2 28.1 23.2 last 10 years. HDFC is ranked as the most 8 HDFC Bank 9 15.9 34.5 18.3 21.1 consistent by virtue of its 10-year price CAGR being 9 ITC 9 15.9 15.4 21.4 16.2 the highest. 10 Ambuja Cem. 9 10.8 33.0 7.7 14.6 This year, eight of the top 10 most consistent wealth creators are consumer-facing businesses with strong CONSUMER FACING COMPANIES SCORE HIGH ON CONSISTENT WEALTH CREATION franchise. Our past studies have also clearly established the dominance of consumer-facing Consistent Wealth Creators - 2005 to 2009 companies in consistent wealth creation. Consumer Facing Non-Consumer Facing Pharma FMCG Others IT Cipla (4) Asian Paints (3) Hero Honda (5) Infosys (3) Key Finding Dr Reddy's Lab (3) Wipro (3) ITC (5) HDFC (5) Businesses like FMCG, Pharma and Banking are GSK Pharma (2) Nestle India (1) HDFC Bank (1) Satyam (2) non-cyclical and have a high degree of customer Piramal Health. (4) Others captivity. With consumerism in India poised to rise, Ranbaxy Lab (4) Number in brackets indicates times appeared Reliance Inds (2) these businesses should continue to create wealth Sun Pharma (2) within top 10 in last five years, 2005 to 2009 Ambuja Cement (1) consistently. 17 December 2009 7
  • 8. Wealth Creation Study 2004-2009 Findings Wealth Creators (Wealthex) WEALTH CREATORS’ INDEX V/S BSE SENSEX (31.3.04 TO 31.3.09) Wealthex - Rebased Sensex Comparative Performance 32,000 v/s BSE Sensex 24,000 Superior performance over benchmark We have compared the performance of Wealthex 16,000 (top 100 Wealth Creators index) with the BSE 80% Outperform ance 8,000 Sensex on three parameters - (1) market performance, (2) earnings growth, and (3) valuation. 0 Mar-04 Jun-04 Dec-04 Mar-05 Jun-05 Dec-05 Mar-06 Jun-06 Dec-06 Mar-07 Jun-07 Dec-07 Mar-08 Jun-08 Dec-08 Mar-09 Sep-04 Sep-05 Sep-06 Sep-07 Sep-08 Market performance: The Wealthex beat the Sensex in each of five years, FY04 through FY09. Over the entire period, the Wealthex outperformed the Sensex by 83%. SENSEX V/S WEALTH CREATORS: HIGHER EARNINGS GROWTH, LOWER VALUATION MAR-04 MAR-05 MAR-06 MAR-07 MAR-08 MAR-09 5-YEAR Earnings growth: In three of five years, Wealthex CAGR (%) earnings growth was significantly better than the BSE Sensex 5,591 6,493 11,280 13,072 15,644 9,709 11.7 Sensex, and in two years, it was almost in line. Over CAGR (%) 16.1 42.0 32.7 29.3 11.7 the five-year period, Wealthex earnings CAGR was YoY Performance (%) 16.1 73.7 15.9 19.7 (37.9) 24.2% compared to 18.8% for the Sensex. Wealthex - based to Sensex 5,591 7,050 12,600 14,759 20,877 14,206 20.5 Valuation: The Wealthex average P/E was 16.3x, CAGR (%) 26.1 50.1 38.2 39.0 20.5 lower than 16.8x for the Sensex. YoY Performance (%) 26.1 78.7 17.1 41.4 (32.0) Key Finding Sensex EPS (Rs) 348 450 523 718 833 825 18.8 Wealth creating companies tend to initially trade at YoY Performance (%) 29.1 16.4 37.3 16.0 (1.0) a discount to market valuation. With superior Sensex P/E (x) 16.0 14.4 21.6 18.2 18.8 11.8 earnings growth over time, they get re-rated and end Wealthex EPS (Rs) 381 533 616 840 1085 1126 24.2 up at a premium to market valuation, leading to YoY Performance (%) 39.7 15.6 36.4 29.2 3.7 outperformance. Wealthex P/E (x) 14.7 13.2 20.5 17.6 19.2 12.6 17 December 2009 8
  • 9. Wealth Creation Study 2004-2009 Findings Wealth Creators WEALTH CREATORS: CLASSIFICATION BY INDUSTRY (RS B) WEALTH SHARE OF WEALTH PRICE PAT P/E (X) Classification By INDUSTRY CREATED CREATED (%) CAGR CAGR 2009 2004 (RS B) 2009 2004 (%) (%) Industry Oil & Gas (4) 2,126 22.1 43.3 15.5 16.9 12.8 13.6 Metals (10) 1,458 15.1 6.5 35.5 32.9 10.1 9.2 Value migration: Oil & Gas continues to be the Engineering (13) 1,167 12.1 5.0 32.5 36.8 15.0 17.6 largest wealth creating sector. However, over the FMCG (16) 1,044 10.8 0.7 18.4 14.3 21.0 17.6 last five years, its share has fallen from 43% of Telecom (4) 1,012 10.5 0.0 30.3 61.5 16.5 48.4 wealth created to 22%, clearly indicating value Banking & Finance (12) 889 9.2 15.3 22.4 24.7 8.7 9.6 migration to sectors such as Telecom and FMCG. IT (5) 492 5.1 7.4 12.4 33.2 12.6 29.6 Pharma (9) 427 4.4 5.6 22.5 29.2 17.3 22.6 Telecom's rising share of wealth created can be Auto (8) 357 3.7 6.0 14.5 16.7 16.8 18.5 attributed to superior PAT CAGR of 62% over the Others (7) 198 2.1 3.6 21.4 27.9 7.9 10.3 last 5 years. On the other hand, FMCG PAT CAGR Cement (6) 186 1.9 2.2 15.1 29.0 8.3 14.6 is a muted 14%; however, the sector has seen a Ultility (3) 143 1.5 4.0 14.0 0.9 18.4 10.0 Construction / Real Estate (1) 56 0.6 0.0 121.6 120.9 7.7 7.6 valuation re-rating, more so given the flight to safety Media (1) 53 0.5 0.4 -3.6 21.9 14.9 48.0 phenomenon during the market downturn in FY09. Retail (1) 29 0.3 0.0 50.2 70.0 21.8 40.5 Total 9,637 100.0 100.0 20.5 24.3 12.6 14.7 Old v/s New Economy: Wealth creation in New Economy businesses - IT, Telecom, Media and Retail NEW ECONOMY PERFORMANCE IN THE TOP 100 WEALTH CREATORS - has not been able to sustain momentum due to No of Companies % Wealth Created slowdown in IT following global economic crisis. However, the longer term trend is clearly up. 20 16 12 Key Finding 10 Banking has lost some share of wealth created due 11 10 10 to the economic slowdown in FY09 and 1HFY10. However, the outlook is improving from 2HFY10. As 1 5 1 a secular business with reasonable valuation, Indian 2000-05 2001-06 2002-07 2003-08 2004-09 banking holds potential for huge wealth creation. 17 December 2009 9
  • 10. Wealth Creation Study 2004-2009 Findings Wealth Creators WEALTH CREATORS: MNCs V/S INDIAN COMPANIES MNC WEALTH CREATION BY SECTOR 2004-2009 MNC INDIAN Pharma Classification By 4% Cement Number of Wealth Creators 23 77 MNCs v/s Indian Companies % Wealth Created 13.8 86.2 7% Others Sales CAGR (%) 19.5 22.0 3% Will the foreign hand rise again? In each of our first four Wealth Creation studies, PAT CAGR (%) 19.3 25.1 Auto Hindustan Lever (now renamed as Hindustan Price CAGR (%) 16.3 21.3 10% P/E - 2004 (x) 18.8 14.1 FMCG Unilever) was the biggest wealth creator, signifying 63% Engg the era of the MNCs. P/E - 2009 (x) 16.6 12.1 13% RoE - 2004 (%) 28.0 20.2 However, for the past several years, MNCs have RoE - 2009 (%) 28.2 19.4 lost significant share both in terms of number of companies and amount of wealth created. FY04-09 marks a semblance of the MNC resurgence, with number of top wealth creating companies more than doubling from 10 to 23 and MNCs ARE WANING IN WEALTH CREATION BUT RECOVER SOMEWHAT IN 2004-2009 share of wealth created increasing from 7% to 14%. A major factor for this resurgence is FMCG, led by 50 Top Wealth Creating MNCs Share of Wealth Created (%) ITC, Hindustan Unilever and Nestle. 30 43 23 15 14 10 7 7 7 3 2 21 19 23 Key Finding 16 12 10 10 PAT CAGR of MNCs is typically lower than that of 10 8 11 Indian companies. However, they still enjoy premium valuations. The main reasons are higher RoE and 1994-99 1995-00 1996-01 1997-02 1998-03 1999-04 2000-05 2001-06 2002-07 2003-08 2004-09 healthy dividend payout. 17 December 2009 10
  • 11. Wealth Creation Study 2004-2009 Findings Wealth Creators WEALTH CREATORS: STATE-OWNED V/S PRIVATELY-OWNED PSU WEALTH CREATION BY SECTOR 2004-2009 Classification By STATE-OWNED PRIVATE Oil & Gas Others 23% Ownership: State v/s Private Number of Wealth Creators in Top 100 16 84 2% Share of Wealth Created (%) 27.0 73.0 PSUs underperform private companies Banks Sales CAGR (%) 16.9 24.5 Mining & 13% 2004-2009, PSUs (public sector undertakings) PAT CAGR (%) 18.2 29.4 Metals underperformed their private counterparts on all Price CAGR (%) 16.2 22.8 37% fronts - sales growth was lower, PAT growth was P/E - 2004 (x) 10.9 18.6 Engg lower, RoE declined and price CAGR was also 25% P/E - 2009 (x) 10.0 14.3 significantly lower. RoE - 2004 (%) 22.0 20.1 Number of PSUs among top wealth creators is the RoE - 2009 (%) 20.1 20.1 lowest in the last six years. In fact, two large PSUs - Indian Oil and HPCL - feature among the top 10 wealth destroyers during 2004-09. DEREGULATION DIMINISHES ROLE OF STATE-OWNED COMPANIES IN WEALTH CREATED Of the wealth created by the PSUs, 60% came No of PSUs % Wealth Created through commodity businesses - Mining & Metals 48.5 50.6 (37%) and Oil & Gas (23%). 35.9 Key Finding 34.6 Assessment of the 16 PSU wealth creators indicates 30 28 24.8 27.0 26 two key criteria for PSU stocks: (1) those with high 25 regulatory entry barriers -SBI, Punjab National Bank 18 16 (few new banking licenses), Bharat Electronics (near monopoly with defence sector), NMDC (mining licenses) and (2) advantage of legacy - GAIL (huge pipeline network), and Concor (strong relationships 1999-2004 2000-2005 2001-2006 2002-2007 2003-2008 2004-2009 with Indian Railways for container movement). 17 December 2009 11
  • 12. Wealth Creation Study 2004-2009 Findings Wealth Creators WEALTH CREATORS: CLASSIFICATION BY AGE-GROUP NO. OF NO. OF WEALTH CREATED % SHARE PAT PRICE Classification By YEARS COS. (RS B) OF WC CAGR (%) CAGR (%) Age Group and Market Cap 0-10 7 1,005 10.4 83.5 33.7 11-20 24 1,646 17.1 17.4 14.7 Young for speed, old for size 21-30 19 1,303 13.5 30.7 19.5 It has been consistently observed through our 31-40 10 2,746 28.5 27.7 28.4 Wealth Creation studies, that young companies (10 41-50 14 1,115 11.6 22.4 24.6 years since incorporation or less) generate the 51-60 13 667 6.9 27.0 14.5 fastest wealth, as they record the highest earnings 61-70 4 237 2.5 31.3 22.4 growth on a low base. 71-80 2 229 2.4 9.6 10.0 81-90 3 147 1.5 15.8 19.3 During 2004-09, the 5 companies in the 0-10 years >90 4 542 5.6 20.4 20.2 bracket generated 84% PAT CAGR and 34% price Total 100 9,637 100.0 24.3 20.5 CAGR, significantly higher than the average of 24% and 21%, respectively. Older companies gain in size, but their stock prices PRICE CAGR AND PAT CAGR BY BASE MARKET CAP RANGE tend to appreciate much more slowly. Price CAGR (%) PAT CAGR (%) Small is beautiful 92 74 of the top 100 wealth creating companies had a 76 base market cap of less than Rs50b in 2004. These 56 companies grew significantly ahead of average, both 49 in terms of earnings and stock price. 32 35 Avg PAT CAGR: 24% 33 33 28 28 Avg Price CAGR: 21% 18 19 21 20 22 17 Key Finding <2 2-5 5-10 10-20 20-50 50-100 100-200 >200 Identifying high-growth companies at an early stage Base Market Cap Range (Rs b) is one of the keys to successful investing. 17 December 2009 12
  • 13. Wealth Creation Study 2004-2009 Findings Wealth Creators WEALTH CREATORS: CLASSIFICATION BY SALES GROWTH SALES GR. NO. OF SHARE PRICE PAT ROE (%) P/E (X) Classification By RANGE COS. OF WC CAGR CAGR (%) (%) (%) (%) 2009 2004 2009 2004 Sales and Earnings Growth 0-10 9 2.8 16.0 10.8 15.0 13.7 15.7 12.4 Growth offers margin of safety 10-20 35 29.0 12.7 15.9 20.3 23.4 11.2 12.9 Clearly, high sales/earnings growth and stock price 20-30 26 35.0 26.7 28.2 17.6 17.8 13.8 14.6 growth are positively correlated. Typically, high 30-40 16 16.5 25.2 40.2 24.7 25.4 14.3 25.2 growth is accompanied by somewhat premium 40-50 9 14.6 34.0 51.9 23.6 19.1 13.8 25.8 market valuations. However, this should not be a >50 5 2.1 43.3 65.8 21.7 13.5 7.9 16.4 deterrent to buying these stocks. Total 100 100.0 20.5 24.3 20.1 21.0 12.6 14.7 As can be seen from the adjacent tables, companies with sales/earnings growth of over 30% have all seen their P/E de-rated in 2009 over 2004. Still, due PRICE CAGR BY 2004-09 PAT GROWTH RANGE CLASSIFICATION BY PAT GROWTH to the sheer high growth, their stocks have delivered Price CAGR significantly higher than average. 61 PAT GR. NO. OF SHARE OF P/E (X) RANGE (%) COS WC (%) 2009 2004 Thus, high growth is a major source of margin of 0-10 12 6.1 18.9 14.1 42 safety. 36 10-20 24 22.2 10.8 12.4 20-30 18 25.1 13.4 15.6 26 20 30-40 17 18.7 14.8 21.3 Key Finding 12 13 40-50 12 8.5 10.7 14.9 During 2004-09, the fastest growing sectors were 50-70 9 17.1 14.8 30.8 mainly cyclicals - metals, engineering and real >70 8 2.3 5.4 11.6 estate. One interesting non-cyclical exception was 0-10 10-20 20-30 30-40 40-50 50-70 >70 Total 100 100.0 12.6 14.7 financial services. Going forward too, select financial PAT Growth Range (%) services stocks should continue their run of high growth, and generate wealth at rapid pace. 17 December 2009 13
  • 14. Wealth Creation Study 2004-2009 Findings Wealth Creators WEALTH CREATORS: CLASSIFICATION BY BASE ROE 2004 ROE NO. OF SHARE OF PRICE PAT ROE (%) P/E (X) Classification By RANGE (%) COS. WC (%) CAGR (%) CAGR (%) 2009 2004 2009 2004 RoE <5 5 1 23 L to L -2.4 -37.5 - - 5-10 13 5 29 36 15 7 15 20 10-15 11 19 33 46 21 12 16 27 Indian markets prefer growth over quality 15-20 17 26 22 23 15 17 13 13 In Indian markets, Price CAGR has a direct 20-25 15 16 15 20 22 22 11 13 correlation between PAT CAGR but a rather inverse 25-30 18 16 17 21 22 26 12 14 correlation with RoE. Consistently, low base year 30-40 14 9 24 37 33 36 11 17 RoE companies have performed better on the >40 7 8 16 15 31 60 13 12 markets than their high RoE counterparts by Total 100 100 21 24 20 21 13 15 delivering superior PAT growth. Thus, during 2004-09, companies with 2004 RoE in the range of 5-15% have delivered PAT CAGR of WEALTH CREATORS: PRICE CAGR BY ROE 36-46%, translating into the highest Price CAGR of 29-33%. Avg Price CAGR: 21% 33 29 23 24 22 15 17 16 Key Finding <5 5-10 10-15 15-20 20-25 25-30 30-40 >40 Bargains are found when markets are blind to change. 2004 ROE Range (%) Anticipating change in profitability ahead of the crowd continues to be rewarded in the markets. 17 December 2009 14
  • 15. Wealth Creation Study 2004-2009 Findings Wealth Creators WEALTH CREATORS: CLASSIFICATION BY VALUATION PARAMETERS (MARCH 2004) NO. OF COS % WEALTH CREATED PRICE CAGR % Classification By P/E (x) Valuation Parameters <5 9 3 30 5-10 22 18 25 10-15 21 32 18 Single-digit PE stocks more likely to 15-20 19 14 18 outperform 20-25 13 13 28 Stocks trading at P/E of less than 5x in 2004 offered >25 16 20 20 a return of 30% compounded for the next five years. Total 100 100 21 This is the highest compared to any other P/E band, indicating that stocks bought at single-digit P/Es are Price/Book (x) more likely to outperform. <1 8 3 36 1-2 21 9 21 Watch out for Price/Book of less than 1x … 2-3 26 47 21 Stocks trading at P/B of less than 1x in 2004 offered 3-4 14 6 18 a return of 36% compounded for the next five years. 4-5 6 8 21 All other Price/Book bands just about managed >5 25 26 19 average returns. Total 100 100 21 Price/Sales (x) … and Price/Sales of up to 1x <0.50 13 3 58 Stocks trading at Price/Sales of up to 1x in 2004 0.50-1.00 12 9 31 offered a return of 31-58% compounded for the next 1.00-1.50 17 24 24 five years. 1.50-2.00 13 14 20 2.00-3.00 18 14 29 3.00-5.00 12 16 12 >5.00 15 21 21 Total 100 100 21 17 December 2009 15
  • 16. Wealth Creation Study 2004-2009 Findings Wealth Creators WEALTH CREATORS: CLASSIFICATION BY VALUATION PARAMETERS (MARCH 2004) NO. OF COS % WEALTH CREATED PRICE CAGR % Classification By Payback Ratio (x) Valuation Parameters (contd.) <0.25 9 3 74 0.25-0.50 13 15 39 Payback ratio of less than 1x guarantees high 0.50-1.00 19 11 25 returns 1-1.5 18 41 19 We define Payback ratio as Market Cap divided by 1.5-2 25 22 21 profits of the next five years. >2 16 9 11 Total 100 100 21 When companies are in high growth phase, it is difficult to value them using conventional measures. Payback ratio is based on empirical wisdom that markets try and seek visibility of five years. Clearly, lower the payback ratio the better. MEDIAN VALUATIONS (X) In hindsight, we find that stocks of companies which 2004 2009 offered a payback ratio of less than 1x in 2004, SENSEX WEALTH CREATORS SENSEX WEALTH CREATORS offered significantly high returns. Median P/E 16.4 14.6 12.2 14.2 Median P/B 3.1 2.8 2.2 2.7 Key Finding Media P/S 2.3 1.8 2.0 1.9 A sure shot formula for multi-baggers is - P/E of less than 10x Price/Book of less than 1x Price/Sales of 1x or less Payback ratio of 1x or less. However, as 2004 median valuations for wealth creators indicate, such stocks are not easily found. 17 December 2009 16
  • 17. Wealth Creation Study 2004-2009 Findings Wealth Destroyers TOP-10 WEALTH DESTROYERS (2004-2009) COMPANY WEALTH DESTROYED PRICE RS B % SHARE CAGR (%) Ranbaxy Labs. 137 8 -19 IOCL 129 8 -5 Wealth destroyed is 17% of wealth created Tata Motors 125 7 -17 During 2004-09, Indian stock markets delivered ICICI Bank 125 7 -21 compounded return of 12%. Still, there was HPCL 81 5 -12 significant wealth destruction of Rs1,782b (17% of Satyam Computer 72 4 -24 wealth created). Oriental Bank 45 3 -18 Tata Steel 44 3 -2 Most of the wealth destruction was due to company- Reliance Infra. 40 2 -8 specific developments - US FDA ban on two units MTNL 37 2 -12 of Ranbaxy, JLR acquisition by Tata Motors, Total of Above 835 49 accounting scam at Satyam Computer and Corus Total Wealth Destroyed 1,704 100 acquisition by Tata Steel. WEALTH DESTRUCTION BY INDUSTRY HPCL has featured in the list of top wealth destroyers for the third successive year. Oil & Gas, 17 Key Finding Banking & During the bull run of 2003-08, wealth destroyed was Finance, 16 only 0.2% of the wealth created. In other words, when Others, 24 the markets are buoyant, most stocks participate Auto, 13 regardless of quality. It is only during market downturns (as in FY09) that Pharma, 12 Metals, 6 IT, 11 the true, sustainable wealth creators are separated from the also-rans. 17 December 2009 17
  • 18. Wealth Creation Study 2004-2009 Findings Wealth Creators and Entry Barriers WEALTH CREATION BY COMPANIES WITH ENTRY BARRIERS In the next section of this report, we discuss COMPANY NO OF WEALTH CREATED % OF businesses and companies with Entry Barriers. COMPANIES RS B TOTAL Companies with Entry Barriers 66 8,314 86 Our study shows that companies with Entry Barriers Others 34 1,323 14 enjoy exponential growth in profits. When bought Total 100 9,637 100 at reasonable valuation, they create significant wealth over the long term. In fact, the list of top Wealth Creators between 2004 and 2009 already proves this point. Of the top 100 Wealth Creators, 66 had strong Entry Barriers. Even more interestingly, they accounted for a disproportionate 86% share of the wealth created. We are convinced this phenomenon will persist in the years to come. 17 December 2009 18
  • 19. Wealth Creation Study 2004-2009 THIS PAGE IS INTENTIONALLY LEFT BLANK 17 December 2009 19
  • 20. Wealth Creation Study 2004-2009 Theme 2009 Wealth Creation 2004-2009 The 14TH Annual Study Theme 2010 17 December 2009 20
  • 21. Wealth Creation Study 2004-2009 Theme 2009 Winner Categories + Category Winners Formula for sustained wealth creation in India's NTD Era Report Outline The outline of the investment theme covered in this report is as follows - 1. Winner Categories = India's NTD opportunity + Scalability 2. Category Winners = Winner Categories + Entry Barriers + Great management 3. Winning investments = Category Winners + Reasonable valuation The following pages develop each of the above ideas. 1. Recap of India's NTD Era 1.1 Introduction After taking 60 years to In 2007, we first wrote about India's NTD i.e. Next Trillion Dollars (of GDP). It took India get to its first US$1 trillion over 60 years since independence to create its first US$1 trillion of GDP in FY08. However, GDP in FY08 … growing nominally @ 12-15% per annum and at current US$/INR rates, India will add the next trillion dollar of GDP in 5-6 years. This journey is currently on. India's FY10E nominal GDP is estimated at US$1.3 trillion. Assuming 12.4% annual growth (7% real and 5% inflation), India's GDP in FY15 works out to US$2.3 trillion i.e. addition of US$1 trillion in the next 5 years. INDIA SHOULD ADD US$1 TRILLION GDP OVER THE NEXT FIVE YEARS (GDP IN US$ TRILLION) 2.5 2.3 2.0 12% CAGR … India is on its way to add 1.5 1.3 16% CAGR its NTD (Next Trillion 1.0 Dollar) in the next 5 years 0.6 5% CAGR 0.5 0.0 FY10E FY11E FY12E FY13E FY14E FY15E FY90 FY91 FY92 FY93 FY94 FY95 FY96 FY97 FY98 FY99 FY00 FY01 FY02 FY03 FY04 FY05 FY06 FY07 FY08 FY09 Source: CMIE/MOSL 1.2 The Chinese experience India's NTD journey is China achieved its first trillion dollar GDP in 1998. It took about six years to add the similar to that of China second trillion in 2005. However, the third trillion took just 3 years, and all of the fourth between 1998 and 2005 came in just one year, 2008, when China's GDP hit US$4 trillion. India is hopefully on its way to mimicking the Chinese experience. Whether we will do it somewhat slower or faster is just a matter of time. 17 December 2009 21
  • 22. Wealth Creation Study 2004-2009 Theme 2009 CHINA (GDP IN US$ TRILLION) 5 4.2 4 Indian GDP may well 3.3 mimic China with a lag 3 of about 10 years 1.9 2 1.0 1 0.6 0 1980 1982 1984 1986 1988 1990 1992 1994 1996 1998 2000 2002 2004 2006 2008 Source: World Bank/MOSL Minimizing the risk of forecasting It is said, "Prediction is very difficult, especially if it's about the future." Knowing this, we have largely relied on hindsight to get a sense of how the NTD Era may play out. Thus, we believe, India's journey from US$1 trillion to US$2 trillion GDP will broadly be an extension of its journey from US$0.5 trillion to US$1 trillion GDP. Further, even US$2 trillion is not a destination, but a milestone in India's ongoing journey towards US$4 trillion GDP in the subsequent 5-7 years, and so on. Thus, forecasting error of a year or two on either side is unlikely to have a major long-term impact. We see a huge consumption and savings/investment boom in India's NTD Era, which will throw up several Winning Categories. (For the purposes of this report, Winner Categories are those which are expected to grow annually @ 18%+ i.e. at least 1.5x faster than our nominal GDP growth rate assumption of ~12%. 1.3 Consumption boom in the NTD Era India will see a sustained In this section, we draw heavily upon McKinsey Global Institute's brilliant report titled boom in consumption The Bird of Gold: The Rise of India's Consumer Market 1 (dated May 2007). The report captures how growth in GDP will shift India's demographics, which in turn, will alter the economy's consumption landscape. The key conclusions of the report are - 1.3.1 India's aggregate consumption to quadruple during 2005-25 Aggregate consumption Household income brackets 4x 70 across income brackets '000 Indian rupees, 2000 By 2025, India is poised to 14 Globals (>1,000) trillion, Indian rupees, 2000 become the world's fifth 16 Strivers (500-1,000) largest consuming country 34 Middle from current position 4 3 Class 25 Seekers (200-500) of twelfth 17 12 10 1 2 7 Aspirers (90-200) 1 3 9 12 12 5 5 4 3 Deprived (<90) 1 - The report can be downloaded 2 from www.mckinsey.com/mgi 1985 1995 2005 2015 2025 Source: McKinsey Global Institute 17 December 2009 22
  • 23. Wealth Creation Study 2004-2009 Theme 2009 YEAR INFLATOR / (DEFLATOR) - X CONVERTING CONSTANT RUPEES TO CURRENT VALUE 2005 1.3 One small challenge in McKinsey Global Institute's report is that all rupee values are expressed in 2015 2.1 constant 2000 rupee terms. The numbers may sometimes be better understood if re-stated in current 2025 3.4 value terms. This can be done by bringing in the inflation factor. Assuming inflation at about 5%, the 2005 numbers needs to be multiplied by an inflation factor of 1.3x, 2015 numbers by 2.1x and 2025 numbers by 3.4x. Thus, for instance, projected 2025 aggregate consumption at then market value works out to Rs237 trillion, compared to Rs26 trillion in FY08, a CAGR of ~14%. 1.3.2 Poverty will fall sharply Deprived class will fall from 93% in 1985 and 54% in 2005 to 22% by 2025. (Deprived class is defined as households with income less than Rs90,000 pa, in constant 2000 rupees). POVERTY WILL DECLINE FROM 93% IN 1985 TO 22% BY 2025 Share of population in each income brackets Household income brackets %, millions of people '000 Indian rupees, 2000 755 928 1,107 1,278 1,429 100% 6 4 Globals (>1,000) 9 18 19 Strivers (500-1,000) 41 32 Seekers (200-500) Poverty will continue to 43 fall sharply … 93 80 36 Aspirers (90-200) 54 35 22 Deprived (<90) 1985 1995 2005 2015 2025 Source: McKinsey Global Institute 1.3.3 Middle class will swell 12x from 50m in 2005 to 583m by 2025 1985 to 2005 saw a wave of 400m Aspirers (i.e. people moving out of poverty); 2005 to 2025 will see a tsunami of over 400m Seekers (i.e. lower middle class) and 120m Strivers (i.e. upper middle class), further fuelling the consumption boom. FIRST ASPIRERS AND THEN SEEKERS WILL BECOME THE LARGEST INCOME BRACKETS Number of households in each income brackets Household income brackets %, millions of people '000 Indian rupees, 2000 140 Actual Forecast 120 Aspirers (90-200) 100 Seekers (200-500) … and India's middle class 80 will swell 60 Deprived (<90) 40 Strivers (500-1,000) 20 0 Globals (>1,000) 1985 1990 1995 2000 2005 2010 2015 2020 2025 Source: McKinsey Global Institute 17 December 2009 23
  • 24. Wealth Creation Study 2004-2009 Theme 2009 1.3.4 Discretionary spend will increase from 52% in 2005 to 70% in 2025 SPENDING PATTERNS WILL EVOLVE MARKEDLY OVER THE NEXT 20 YEARS Share of average households consumption Discretionary spending %, '000 Indian rupees, 2000 Necessities 60 82 140 248 100% 4 3 7 9 1 5 13 Health care 11 2 6 3 9 Education & recreation 4 17 6 Discretionary spend will rise 2 19 Communication 14 8 @ 10% in real terms 3 20 Transporation 5 9 12 3 6 12 11 Personal Products & Services 3 Household Product 5 10 Housing & Utilities 56 5 Apparel 42 34 25 Food, beverages,& Tobacco 1995 2005 2015 2025 Source: McKinsey Global Institute 1.3.5 Several categories will grow exponentially There will be a significant rise in consumption pie for Alcoholic beverages, Transport vehicles, Healthcare services, Education & recreation and Communication. CATEGORY GROWTH TRENDS (RS BILLION, CONSTANT 2000 PRICES) CATEGORY 2005 % SHARE 2015 % SHARE CAGR (%) Food, beverages, tobacco 7,147 21.7 11,547 17.9 4.9 Food 6,565 20.0 10,366 16.1 4.7 Non-alcoholic beverages 346 1.1 750 1.2 8.0 Alcoholic beverages 115 0.3 291 0.5 9.7 Tobacco 121 0.4 139 0.2 1.4 Transportation 2,788 8.5 6,395 9.9 8.7 Fuel 1,008 3.1 3,024 4.7 11.6 Services 1,633 5.0 2,968 4.6 6.2 Food will remain the largest Two-wheelers 99 0.3 250 0.4 9.7 category; Communication Cars, UVs * 49 0.1 153 0.2 12.1 Housing, Utilities, etc 2,019 6.1 4,032 6.3 7.2 and Transportation will Personal Products & Services 1,273 3.9 3,044 4.7 9.1 grow the fastest Personal and household services 987 3.0 2,301 3.6 8.8 Personal non-durables 256 0.8 673 1.0 10.1 Jewelry 30 0.1 70 0.1 8.8 Healthcare 1,148 3.5 3,076 4.8 10.4 Medical services / equipment 364 1.1 1,835 2.8 17.6 Pharmaceuticals 784 2.4 1,241 1.9 4.7 Apparel and footwear 931 2.8 1,847 2.9 7.1 Education and recreation 1,198 3.6 3,195 5.0 10.3 Education 1,148 3.5 3,076 4.8 10.4 Recreation 50 0.2 119 0.2 9.1 Household products 484 1.5 959 1.5 7.1 Communication 344 1.0 1,090 1.7 12.2 Total 32,892 100.0 64,456 100.0 7.0 * Excludes vehicles registered with companies Source: McKinsey Global Institute 1.3.6 Implications for the NTD Era Sustained consumption boom led by the middle class Several potential Winner Categories - Processed foods, Alcoholic beverages, 2- wheelers & cars, Auto finance, Airlines, White goods, Entertainment media, Telecom, Education and Healthcare. 17 December 2009 24