SlideShare a Scribd company logo
1 of 11
Tai-Wei (Andy) Lee May 11, 2009 IB Math SL 1 p.6 Ms. Bessette Internal Assessment II* Mathematical Modeling (Type II) The body mass index (BMI), or Quetelet index, is a statistical measurement which compares a person's weight and height. (http://en.wikipedia.org/wiki/Body_mass_index) Although it does not directly measure a person’s percentage of body fat, it is a useful tool to estimate a healthy weight according to how tall the person is. The BMI is most often used as a diagnostic tool to identify underweight, overweight and obesity. The BMI, according to the metric system and SI units, is defined as one’s weight in kilograms divided by the square of one’s height in meters. The BMI can be illustrated by the following formula: 2028825-2540 Age (yrs)BMI216.40315.70415.30515.20615.21715.40815.80916.301016.801117.501218.181318.701419.361519.881620.401720.851821.221921.602021.65 For this assignment, I was given a table of median BMI for females of different ages in the US in the 2000, the table looks like the following: Table 1:     (Source:   http://cdc.gov) By plotting the data given from Table 1 into LoggerPro, the graph below can be obtained Graph 1: In this graph, the variables are age and BMI; in the x-axis is age by year and in the y-axis is BMI. The parameters in this graph and Table 1 are that this data only takes in account female, in the US, and age between 2 to 20 years old. 4629150234950By observation, I noticed that the sine function best models the behavior of this graph. The reason being that Graph 1 simply looks like a sine function after it had been shifted to the right.  Moreover, the graph contains an amplitude and possibly a period through my observations.  Figure1:  graph of sine function; y=sin(x)First of all, the general sine function is defined as y=AsinBx-C+ D where, A determines the Amplitude,                B determines the Period,                C determines the Horizontal translation, and                D determines the Vertical translation. I then go about finding A,B,C and D to arrive to an equation (model) to fit Graph 1: To find amplitude or A, I take the maximum and minimum of the y value and subtract them, which will give me the distance between the max and min. Then I take that number and divide by 2, which will give me half the distance between the max and min, or better known as, the amplitude. How this was done is demonstrated below: Amplitude= (21.65-15.20)2=3.225 The amplitude or A is therefore  3.225 Next, to find period or B, I take the maximum and minimum of the y value and subtract them, which will give me the distance between the max and min. Then I take that number and divide by 2, which will give me half the distance between the max and min, which in this case, is half the period, so I will multiply that number by two again to get the full period in some number. Then I take that number and multiply by π180 in order to change it into radians. This final number then is my period. How this was done is demonstrated below: Period=yMax-ymin2×2×π180                                   =21.65-15.202×2×π180=.225  The period or B is therefore .225 Next, to find the horizontal translation or C, since I know that the general sine function passes through the point (0,0), I then simply take the x value of the median or midpoint between the peak and the trough and that number will indicate how far horizontally it has moved from the original position. How this was done is demonstrated below: Since the highest y value occurs when the x value is 20, this is the peak and since the lowest y value occurs when the x value is 5, this is the trough Horizontal Translation= 20+52                                        =12.5 The horizontal translation or C is therefore 12.5 Lastly, to find the vertical translation or D,  since we know that the general sine function passes through the point (0,0), I then simply take the y value of the median or midpoint between the peak and the trough and that number will indicate how far vertically it has moved from the origin. How this was done is demonstrated below: Vertical Translation= 21.65+15.22                           =18.425 The vertical translation or D is therefore 18.425 Finally, I arrive at an equation (model) to fit Graph 1: y=3.225 sin .225x-12.5+ 18.425 The equation can be graphically represented along with the data points from Table 1 as below Graph 2: In this graph, the variables still are age and BMI; in the x-axis is age by year and in the y-axis is BMI. The parameters in Graph 1 also hold true with this graph. In this graph, the value of C that is displayed is different from what I found because LoggerPro plots sine functions as   y=AsinBx-C+ D, rather than in the form y=AsinBx-C+ D; so I just basically took .225 and multiply it to -12.5 which then gives me -2.8125 as shown in the graph. From what is displayed in Graph 2, it is justified to say that the sine function best fits with the data given from Table 1. In addition, with the help of the Ti calculator, I am able to find another function that also models the data from Table 1.  Since it is already demonstrated that the sine function best models the data given, it can also be said that the cosine function will also model the data given because the sine function is the cosine function shifted to the right  π2  radians; what this means is demonstrated below: π223526753810190503810 radians                                                                                                                     Figure 2: Graph of cosine function (left) compared with the graph of sine function (right); these graphs are screen-shots from the TI-SmartView program The general cosine function is defined as y=AcosBx-C+ D where, A determines the Amplitude,                B determines the Period,                C determines the Horizontal translation, and                D determines the Vertical translation. In this case, A,B and D of this cosine function will be the same as A,B and D of sine function because they will have the same amplitude, same period and the same vertical translation; however, the horizontal translation will be different due to the reason as mentioned above, the sine function is basically the cosine function shifted to the right  π2  radians. Since A,B and D are the same for the cosine function, they are: The amplitude or A is therefore  3.225 The period or B is therefore .225 The vertical translation or D is therefore 18.425 To find the horizontal translation or C, I first observe that the general cosine function starts x=0 at its y maximum or peak as shown in Figure 2. So I make the conjecture that where of x, that the maximum of y occurs is how much it has moved from x=0. How this was done is demonstrated below: x-Age (yrs)Y-BMI216.40315.70415.30515.20615.21715.40815.80916.301016.801117.501218.181318.701419.361519.881620.401720.851821.221921.602021.65 Original Table 1:  Since the greatest y-value occurs at x=20, so I say that the peak has moved 20 from X=0; therefore, the horizontal translation or C, is 20. Finally, I arrive at another equation (model) to fit Graph 1: y=3.225 cos .225x-20.0+ 18.425 This equation can be graphically represented below Graph 3: In this graph, the variables still are age and BMI; in the x-axis is age by year and in the y-axis is BMI. The parameters in Graph 1 also hold true with this graph. In this graph, the value of C that is displayed is different from what I found because LoggerPro plots cosine functions as   y=AcosBx-C+ D, rather than in the form y=AcosBx-C+ D; so I just basically took .225 and multiply it to -20.0 which then gives me -4.5 as shown in the graph. The sine and cosine function are both graphically represented below: Graph 4: In this graph the best fit model function, the sine function, and the cosine function are both plotted. The two models are slightly different because as said, the sine model function is the best fit model function, any other functions would just rather be a representation of the data but none can better fitted than the sine function.  According to my model function: y=3.225 sin .225x-12.5+ 18.425 A 30-year-old woman in the US would have a BMI of approximately 16.68 kg/m2; how this was done is demonstrated below: Plug 29 for x because when I plug x as 1 I get, 16.7=3.225 sin .2251-12.5+ 18.425 Which is the closest to the BMI for age 2; therefore, (age – 1) = x So (30 -1) = 29 So I plug in 29 for x and I get  16.68=3.225 sin .22529-12.5+ 18.425 So a 30 year old woman in the US would have a BMI of approximately 16.68 kg/m2? That result, to many researchers of BMI, would not sound reasonable and convincing because it is hardly ever the case that a 30 year old woman would be in a better shape (BMI wise) than a 18 year old teenager. Most likely it will be that the 30 year old woman would have a higher BMI number than a 18 year old teenager.  From internet, I found a set of BMI data for females from England age between 0-15 years old. The data is presented below in a form of a simplified table rather than the original gigantic chart that I found: AgeMean BMI of Girls in UK year 2002015.7116.3216.7316.6416.8516.3616.5716.8817.4917.91018.81119.91220.01320.81422.11522.2 Table 2:                            (Source: http://www.erpho.org.uk/viewResource.aspx?id=8993)          I then tried my model onto this new set of data shown below Graph 5: Obviously, my sine model does not fit this new set of BMI data in the UK at all. More or less, the new set of data resembles a quadratic function, so I tried it on another graph below. Graph 6: Unsurprisingly, this quadratic function works much better on the new set of data from England. In this graph, I adjusted the x-axis because in the data I obtained of English girls’ BMI, the age only ranges from 0-15 years rather than 2-20 years.   As a conclusion, although the sine model I found best fits the data given in Table 1, it is not applicable to other sets of data, it is only limited to the set of data given in Table 1. One thing that differentiates the data given in Table 1 from Table 2 is that in Table 1, the numbers are medians; on the other hand, the numbers in Table 2 are means.
Ia 2 Modeling
Ia 2 Modeling
Ia 2 Modeling
Ia 2 Modeling
Ia 2 Modeling
Ia 2 Modeling
Ia 2 Modeling
Ia 2 Modeling
Ia 2 Modeling
Ia 2 Modeling

More Related Content

What's hot (19)

1. vectors
1. vectors1. vectors
1. vectors
 
CS6491Project4
CS6491Project4CS6491Project4
CS6491Project4
 
Introduction to vectors
Introduction to vectorsIntroduction to vectors
Introduction to vectors
 
Measurements, Vector and Equilibrium
Measurements, Vector and EquilibriumMeasurements, Vector and Equilibrium
Measurements, Vector and Equilibrium
 
Geometry unit 9.2
Geometry unit 9.2Geometry unit 9.2
Geometry unit 9.2
 
Physics Presentation
Physics PresentationPhysics Presentation
Physics Presentation
 
Vector algebra
Vector algebra Vector algebra
Vector algebra
 
Components of vector
Components of vectorComponents of vector
Components of vector
 
Vectors
VectorsVectors
Vectors
 
Vector Addition
Vector AdditionVector Addition
Vector Addition
 
Class 12 Maths - Vectors
Class 12 Maths - VectorsClass 12 Maths - Vectors
Class 12 Maths - Vectors
 
Geometry unit 9.1
Geometry unit 9.1Geometry unit 9.1
Geometry unit 9.1
 
Force vectors
Force vectorsForce vectors
Force vectors
 
Scalars and vectors
Scalars and vectorsScalars and vectors
Scalars and vectors
 
vectors
vectorsvectors
vectors
 
4 scalarsvectors-161127184703
4 scalarsvectors-1611271847034 scalarsvectors-161127184703
4 scalarsvectors-161127184703
 
Linear presentation
Linear presentationLinear presentation
Linear presentation
 
004
004004
004
 
004
004004
004
 

Viewers also liked

Ib math studies internal assessment final draft
Ib math studies internal assessment final draftIb math studies internal assessment final draft
Ib math studies internal assessment final draftBilly Egg
 
Math Internal Assessment
Math Internal AssessmentMath Internal Assessment
Math Internal AssessmentJanniie
 
Pre-Cal 40S Slides April 17, 2008
Pre-Cal 40S Slides April 17, 2008Pre-Cal 40S Slides April 17, 2008
Pre-Cal 40S Slides April 17, 2008Darren Kuropatwa
 
Pre-Cal 40S Slides November 12, 2007
Pre-Cal 40S Slides November 12, 2007Pre-Cal 40S Slides November 12, 2007
Pre-Cal 40S Slides November 12, 2007Darren Kuropatwa
 
Logsexponents
LogsexponentsLogsexponents
Logsexponentsr0xee
 
Natural Logs
Natural LogsNatural Logs
Natural Logsswartzje
 
International baccalaureate math sl investigation_the correlation between lu...
International baccalaureate math sl  investigation_the correlation between lu...International baccalaureate math sl  investigation_the correlation between lu...
International baccalaureate math sl investigation_the correlation between lu...Felix Dyrek
 
IB math HL IA modeling a functional building
IB math HL IA   modeling a functional buildingIB math HL IA   modeling a functional building
IB math HL IA modeling a functional buildingheejjung
 
IB Math Studies IA
IB Math Studies IAIB Math Studies IA
IB Math Studies IAabelkoster
 
DNA Barcoding Workshop
DNA Barcoding WorkshopDNA Barcoding Workshop
DNA Barcoding WorkshopStephen Taylor
 
Math Statistics IA December 2010
Math Statistics IA December 2010Math Statistics IA December 2010
Math Statistics IA December 2010david1dave
 

Viewers also liked (15)

SL Math IA
SL Math IASL Math IA
SL Math IA
 
Ib math studies internal assessment final draft
Ib math studies internal assessment final draftIb math studies internal assessment final draft
Ib math studies internal assessment final draft
 
Math Internal Assessment
Math Internal AssessmentMath Internal Assessment
Math Internal Assessment
 
Empirical Model
Empirical ModelEmpirical Model
Empirical Model
 
Pre-Cal 40S Slides April 17, 2008
Pre-Cal 40S Slides April 17, 2008Pre-Cal 40S Slides April 17, 2008
Pre-Cal 40S Slides April 17, 2008
 
Pre-Cal 40S Slides November 12, 2007
Pre-Cal 40S Slides November 12, 2007Pre-Cal 40S Slides November 12, 2007
Pre-Cal 40S Slides November 12, 2007
 
Logsexponents
LogsexponentsLogsexponents
Logsexponents
 
Natural Logs
Natural LogsNatural Logs
Natural Logs
 
Math ia
Math iaMath ia
Math ia
 
Ia final report
Ia final reportIa final report
Ia final report
 
International baccalaureate math sl investigation_the correlation between lu...
International baccalaureate math sl  investigation_the correlation between lu...International baccalaureate math sl  investigation_the correlation between lu...
International baccalaureate math sl investigation_the correlation between lu...
 
IB math HL IA modeling a functional building
IB math HL IA   modeling a functional buildingIB math HL IA   modeling a functional building
IB math HL IA modeling a functional building
 
IB Math Studies IA
IB Math Studies IAIB Math Studies IA
IB Math Studies IA
 
DNA Barcoding Workshop
DNA Barcoding WorkshopDNA Barcoding Workshop
DNA Barcoding Workshop
 
Math Statistics IA December 2010
Math Statistics IA December 2010Math Statistics IA December 2010
Math Statistics IA December 2010
 

Similar to Ia 2 Modeling

105_2_digitalSystem_Chap_3_part_3.ppt
105_2_digitalSystem_Chap_3_part_3.ppt105_2_digitalSystem_Chap_3_part_3.ppt
105_2_digitalSystem_Chap_3_part_3.pptJeanie Delos Arcos
 
6.3 Graphs of Sine and Cosine
6.3 Graphs of Sine and Cosine6.3 Graphs of Sine and Cosine
6.3 Graphs of Sine and Cosinesmiller5
 
Three Solutions of the LLP Limiting Case of the Problem of Apollonius via Geo...
Three Solutions of the LLP Limiting Case of the Problem of Apollonius via Geo...Three Solutions of the LLP Limiting Case of the Problem of Apollonius via Geo...
Three Solutions of the LLP Limiting Case of the Problem of Apollonius via Geo...James Smith
 
Statistics assignment help service
Statistics assignment help serviceStatistics assignment help service
Statistics assignment help serviceMark Austin
 
Simple linear regression
Simple linear regressionSimple linear regression
Simple linear regressionMaria Theresa
 
Annotations 2
Annotations 2Annotations 2
Annotations 2Timmathy
 
Simple linear regression
Simple linear regressionSimple linear regression
Simple linear regressionMaria Theresa
 
Dilations edmodo 2013 14
Dilations edmodo 2013 14Dilations edmodo 2013 14
Dilations edmodo 2013 14shumwayc
 
Introduction to Probability and Statistics 13th Edition Mendenhall Solutions ...
Introduction to Probability and Statistics 13th Edition Mendenhall Solutions ...Introduction to Probability and Statistics 13th Edition Mendenhall Solutions ...
Introduction to Probability and Statistics 13th Edition Mendenhall Solutions ...MaxineBoyd
 
Non linearregression 4+
Non linearregression 4+Non linearregression 4+
Non linearregression 4+Ricardo Solano
 
Computer graphic
Computer graphicComputer graphic
Computer graphicnusratema1
 
Operation research bba15
Operation research bba15Operation research bba15
Operation research bba15sonal CHAUHAN
 
Linear Regression with Gradient Descent.pdf
Linear Regression with Gradient Descent.pdfLinear Regression with Gradient Descent.pdf
Linear Regression with Gradient Descent.pdfHarsimarKaur23
 

Similar to Ia 2 Modeling (20)

Business statistics homework help
Business statistics homework helpBusiness statistics homework help
Business statistics homework help
 
Regression Analysis
Regression AnalysisRegression Analysis
Regression Analysis
 
105_2_digitalSystem_Chap_3_part_3.ppt
105_2_digitalSystem_Chap_3_part_3.ppt105_2_digitalSystem_Chap_3_part_3.ppt
105_2_digitalSystem_Chap_3_part_3.ppt
 
6.3 Graphs of Sine and Cosine
6.3 Graphs of Sine and Cosine6.3 Graphs of Sine and Cosine
6.3 Graphs of Sine and Cosine
 
AoK Math
AoK MathAoK Math
AoK Math
 
AoK Math
AoK MathAoK Math
AoK Math
 
Three Solutions of the LLP Limiting Case of the Problem of Apollonius via Geo...
Three Solutions of the LLP Limiting Case of the Problem of Apollonius via Geo...Three Solutions of the LLP Limiting Case of the Problem of Apollonius via Geo...
Three Solutions of the LLP Limiting Case of the Problem of Apollonius via Geo...
 
Statistics assignment help service
Statistics assignment help serviceStatistics assignment help service
Statistics assignment help service
 
Simple linear regression
Simple linear regressionSimple linear regression
Simple linear regression
 
Lar calc10 ch04_sec4
Lar calc10 ch04_sec4Lar calc10 ch04_sec4
Lar calc10 ch04_sec4
 
Annotations 2
Annotations 2Annotations 2
Annotations 2
 
Simple linear regression
Simple linear regressionSimple linear regression
Simple linear regression
 
Dilations edmodo 2013 14
Dilations edmodo 2013 14Dilations edmodo 2013 14
Dilations edmodo 2013 14
 
Introduction to Probability and Statistics 13th Edition Mendenhall Solutions ...
Introduction to Probability and Statistics 13th Edition Mendenhall Solutions ...Introduction to Probability and Statistics 13th Edition Mendenhall Solutions ...
Introduction to Probability and Statistics 13th Edition Mendenhall Solutions ...
 
Solution kepler chap 1
Solution kepler chap 1Solution kepler chap 1
Solution kepler chap 1
 
Non linearregression 4+
Non linearregression 4+Non linearregression 4+
Non linearregression 4+
 
Computer graphic
Computer graphicComputer graphic
Computer graphic
 
Operation research bba15
Operation research bba15Operation research bba15
Operation research bba15
 
Stats Coursework
Stats CourseworkStats Coursework
Stats Coursework
 
Linear Regression with Gradient Descent.pdf
Linear Regression with Gradient Descent.pdfLinear Regression with Gradient Descent.pdf
Linear Regression with Gradient Descent.pdf
 

Recently uploaded

Moving Beyond Passwords: FIDO Paris Seminar.pdf
Moving Beyond Passwords: FIDO Paris Seminar.pdfMoving Beyond Passwords: FIDO Paris Seminar.pdf
Moving Beyond Passwords: FIDO Paris Seminar.pdfLoriGlavin3
 
Ensuring Technical Readiness For Copilot in Microsoft 365
Ensuring Technical Readiness For Copilot in Microsoft 365Ensuring Technical Readiness For Copilot in Microsoft 365
Ensuring Technical Readiness For Copilot in Microsoft 3652toLead Limited
 
A Deep Dive on Passkeys: FIDO Paris Seminar.pptx
A Deep Dive on Passkeys: FIDO Paris Seminar.pptxA Deep Dive on Passkeys: FIDO Paris Seminar.pptx
A Deep Dive on Passkeys: FIDO Paris Seminar.pptxLoriGlavin3
 
How AI, OpenAI, and ChatGPT impact business and software.
How AI, OpenAI, and ChatGPT impact business and software.How AI, OpenAI, and ChatGPT impact business and software.
How AI, OpenAI, and ChatGPT impact business and software.Curtis Poe
 
From Family Reminiscence to Scholarly Archive .
From Family Reminiscence to Scholarly Archive .From Family Reminiscence to Scholarly Archive .
From Family Reminiscence to Scholarly Archive .Alan Dix
 
What is DBT - The Ultimate Data Build Tool.pdf
What is DBT - The Ultimate Data Build Tool.pdfWhat is DBT - The Ultimate Data Build Tool.pdf
What is DBT - The Ultimate Data Build Tool.pdfMounikaPolabathina
 
New from BookNet Canada for 2024: Loan Stars - Tech Forum 2024
New from BookNet Canada for 2024: Loan Stars - Tech Forum 2024New from BookNet Canada for 2024: Loan Stars - Tech Forum 2024
New from BookNet Canada for 2024: Loan Stars - Tech Forum 2024BookNet Canada
 
"Subclassing and Composition – A Pythonic Tour of Trade-Offs", Hynek Schlawack
"Subclassing and Composition – A Pythonic Tour of Trade-Offs", Hynek Schlawack"Subclassing and Composition – A Pythonic Tour of Trade-Offs", Hynek Schlawack
"Subclassing and Composition – A Pythonic Tour of Trade-Offs", Hynek SchlawackFwdays
 
Tampa BSides - Chef's Tour of Microsoft Security Adoption Framework (SAF)
Tampa BSides - Chef's Tour of Microsoft Security Adoption Framework (SAF)Tampa BSides - Chef's Tour of Microsoft Security Adoption Framework (SAF)
Tampa BSides - Chef's Tour of Microsoft Security Adoption Framework (SAF)Mark Simos
 
"ML in Production",Oleksandr Bagan
"ML in Production",Oleksandr Bagan"ML in Production",Oleksandr Bagan
"ML in Production",Oleksandr BaganFwdays
 
TeamStation AI System Report LATAM IT Salaries 2024
TeamStation AI System Report LATAM IT Salaries 2024TeamStation AI System Report LATAM IT Salaries 2024
TeamStation AI System Report LATAM IT Salaries 2024Lonnie McRorey
 
Passkey Providers and Enabling Portability: FIDO Paris Seminar.pptx
Passkey Providers and Enabling Portability: FIDO Paris Seminar.pptxPasskey Providers and Enabling Portability: FIDO Paris Seminar.pptx
Passkey Providers and Enabling Portability: FIDO Paris Seminar.pptxLoriGlavin3
 
Take control of your SAP testing with UiPath Test Suite
Take control of your SAP testing with UiPath Test SuiteTake control of your SAP testing with UiPath Test Suite
Take control of your SAP testing with UiPath Test SuiteDianaGray10
 
"Debugging python applications inside k8s environment", Andrii Soldatenko
"Debugging python applications inside k8s environment", Andrii Soldatenko"Debugging python applications inside k8s environment", Andrii Soldatenko
"Debugging python applications inside k8s environment", Andrii SoldatenkoFwdays
 
Advanced Computer Architecture – An Introduction
Advanced Computer Architecture – An IntroductionAdvanced Computer Architecture – An Introduction
Advanced Computer Architecture – An IntroductionDilum Bandara
 
Unraveling Multimodality with Large Language Models.pdf
Unraveling Multimodality with Large Language Models.pdfUnraveling Multimodality with Large Language Models.pdf
Unraveling Multimodality with Large Language Models.pdfAlex Barbosa Coqueiro
 
DevoxxFR 2024 Reproducible Builds with Apache Maven
DevoxxFR 2024 Reproducible Builds with Apache MavenDevoxxFR 2024 Reproducible Builds with Apache Maven
DevoxxFR 2024 Reproducible Builds with Apache MavenHervé Boutemy
 
Nell’iperspazio con Rocket: il Framework Web di Rust!
Nell’iperspazio con Rocket: il Framework Web di Rust!Nell’iperspazio con Rocket: il Framework Web di Rust!
Nell’iperspazio con Rocket: il Framework Web di Rust!Commit University
 
unit 4 immunoblotting technique complete.pptx
unit 4 immunoblotting technique complete.pptxunit 4 immunoblotting technique complete.pptx
unit 4 immunoblotting technique complete.pptxBkGupta21
 
Time Series Foundation Models - current state and future directions
Time Series Foundation Models - current state and future directionsTime Series Foundation Models - current state and future directions
Time Series Foundation Models - current state and future directionsNathaniel Shimoni
 

Recently uploaded (20)

Moving Beyond Passwords: FIDO Paris Seminar.pdf
Moving Beyond Passwords: FIDO Paris Seminar.pdfMoving Beyond Passwords: FIDO Paris Seminar.pdf
Moving Beyond Passwords: FIDO Paris Seminar.pdf
 
Ensuring Technical Readiness For Copilot in Microsoft 365
Ensuring Technical Readiness For Copilot in Microsoft 365Ensuring Technical Readiness For Copilot in Microsoft 365
Ensuring Technical Readiness For Copilot in Microsoft 365
 
A Deep Dive on Passkeys: FIDO Paris Seminar.pptx
A Deep Dive on Passkeys: FIDO Paris Seminar.pptxA Deep Dive on Passkeys: FIDO Paris Seminar.pptx
A Deep Dive on Passkeys: FIDO Paris Seminar.pptx
 
How AI, OpenAI, and ChatGPT impact business and software.
How AI, OpenAI, and ChatGPT impact business and software.How AI, OpenAI, and ChatGPT impact business and software.
How AI, OpenAI, and ChatGPT impact business and software.
 
From Family Reminiscence to Scholarly Archive .
From Family Reminiscence to Scholarly Archive .From Family Reminiscence to Scholarly Archive .
From Family Reminiscence to Scholarly Archive .
 
What is DBT - The Ultimate Data Build Tool.pdf
What is DBT - The Ultimate Data Build Tool.pdfWhat is DBT - The Ultimate Data Build Tool.pdf
What is DBT - The Ultimate Data Build Tool.pdf
 
New from BookNet Canada for 2024: Loan Stars - Tech Forum 2024
New from BookNet Canada for 2024: Loan Stars - Tech Forum 2024New from BookNet Canada for 2024: Loan Stars - Tech Forum 2024
New from BookNet Canada for 2024: Loan Stars - Tech Forum 2024
 
"Subclassing and Composition – A Pythonic Tour of Trade-Offs", Hynek Schlawack
"Subclassing and Composition – A Pythonic Tour of Trade-Offs", Hynek Schlawack"Subclassing and Composition – A Pythonic Tour of Trade-Offs", Hynek Schlawack
"Subclassing and Composition – A Pythonic Tour of Trade-Offs", Hynek Schlawack
 
Tampa BSides - Chef's Tour of Microsoft Security Adoption Framework (SAF)
Tampa BSides - Chef's Tour of Microsoft Security Adoption Framework (SAF)Tampa BSides - Chef's Tour of Microsoft Security Adoption Framework (SAF)
Tampa BSides - Chef's Tour of Microsoft Security Adoption Framework (SAF)
 
"ML in Production",Oleksandr Bagan
"ML in Production",Oleksandr Bagan"ML in Production",Oleksandr Bagan
"ML in Production",Oleksandr Bagan
 
TeamStation AI System Report LATAM IT Salaries 2024
TeamStation AI System Report LATAM IT Salaries 2024TeamStation AI System Report LATAM IT Salaries 2024
TeamStation AI System Report LATAM IT Salaries 2024
 
Passkey Providers and Enabling Portability: FIDO Paris Seminar.pptx
Passkey Providers and Enabling Portability: FIDO Paris Seminar.pptxPasskey Providers and Enabling Portability: FIDO Paris Seminar.pptx
Passkey Providers and Enabling Portability: FIDO Paris Seminar.pptx
 
Take control of your SAP testing with UiPath Test Suite
Take control of your SAP testing with UiPath Test SuiteTake control of your SAP testing with UiPath Test Suite
Take control of your SAP testing with UiPath Test Suite
 
"Debugging python applications inside k8s environment", Andrii Soldatenko
"Debugging python applications inside k8s environment", Andrii Soldatenko"Debugging python applications inside k8s environment", Andrii Soldatenko
"Debugging python applications inside k8s environment", Andrii Soldatenko
 
Advanced Computer Architecture – An Introduction
Advanced Computer Architecture – An IntroductionAdvanced Computer Architecture – An Introduction
Advanced Computer Architecture – An Introduction
 
Unraveling Multimodality with Large Language Models.pdf
Unraveling Multimodality with Large Language Models.pdfUnraveling Multimodality with Large Language Models.pdf
Unraveling Multimodality with Large Language Models.pdf
 
DevoxxFR 2024 Reproducible Builds with Apache Maven
DevoxxFR 2024 Reproducible Builds with Apache MavenDevoxxFR 2024 Reproducible Builds with Apache Maven
DevoxxFR 2024 Reproducible Builds with Apache Maven
 
Nell’iperspazio con Rocket: il Framework Web di Rust!
Nell’iperspazio con Rocket: il Framework Web di Rust!Nell’iperspazio con Rocket: il Framework Web di Rust!
Nell’iperspazio con Rocket: il Framework Web di Rust!
 
unit 4 immunoblotting technique complete.pptx
unit 4 immunoblotting technique complete.pptxunit 4 immunoblotting technique complete.pptx
unit 4 immunoblotting technique complete.pptx
 
Time Series Foundation Models - current state and future directions
Time Series Foundation Models - current state and future directionsTime Series Foundation Models - current state and future directions
Time Series Foundation Models - current state and future directions
 

Ia 2 Modeling

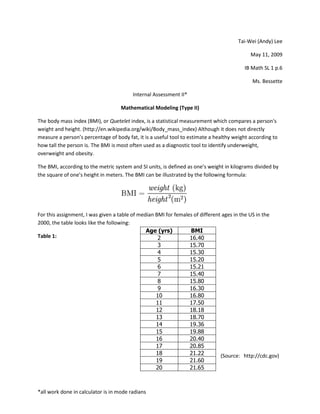
  • 1. Tai-Wei (Andy) Lee May 11, 2009 IB Math SL 1 p.6 Ms. Bessette Internal Assessment II* Mathematical Modeling (Type II) The body mass index (BMI), or Quetelet index, is a statistical measurement which compares a person's weight and height. (http://en.wikipedia.org/wiki/Body_mass_index) Although it does not directly measure a person’s percentage of body fat, it is a useful tool to estimate a healthy weight according to how tall the person is. The BMI is most often used as a diagnostic tool to identify underweight, overweight and obesity. The BMI, according to the metric system and SI units, is defined as one’s weight in kilograms divided by the square of one’s height in meters. The BMI can be illustrated by the following formula: 2028825-2540 Age (yrs)BMI216.40315.70415.30515.20615.21715.40815.80916.301016.801117.501218.181318.701419.361519.881620.401720.851821.221921.602021.65 For this assignment, I was given a table of median BMI for females of different ages in the US in the 2000, the table looks like the following: Table 1: (Source: http://cdc.gov) By plotting the data given from Table 1 into LoggerPro, the graph below can be obtained Graph 1: In this graph, the variables are age and BMI; in the x-axis is age by year and in the y-axis is BMI. The parameters in this graph and Table 1 are that this data only takes in account female, in the US, and age between 2 to 20 years old. 4629150234950By observation, I noticed that the sine function best models the behavior of this graph. The reason being that Graph 1 simply looks like a sine function after it had been shifted to the right. Moreover, the graph contains an amplitude and possibly a period through my observations. Figure1: graph of sine function; y=sin(x)First of all, the general sine function is defined as y=AsinBx-C+ D where, A determines the Amplitude, B determines the Period, C determines the Horizontal translation, and D determines the Vertical translation. I then go about finding A,B,C and D to arrive to an equation (model) to fit Graph 1: To find amplitude or A, I take the maximum and minimum of the y value and subtract them, which will give me the distance between the max and min. Then I take that number and divide by 2, which will give me half the distance between the max and min, or better known as, the amplitude. How this was done is demonstrated below: Amplitude= (21.65-15.20)2=3.225 The amplitude or A is therefore 3.225 Next, to find period or B, I take the maximum and minimum of the y value and subtract them, which will give me the distance between the max and min. Then I take that number and divide by 2, which will give me half the distance between the max and min, which in this case, is half the period, so I will multiply that number by two again to get the full period in some number. Then I take that number and multiply by π180 in order to change it into radians. This final number then is my period. How this was done is demonstrated below: Period=yMax-ymin2×2×π180 =21.65-15.202×2×π180=.225 The period or B is therefore .225 Next, to find the horizontal translation or C, since I know that the general sine function passes through the point (0,0), I then simply take the x value of the median or midpoint between the peak and the trough and that number will indicate how far horizontally it has moved from the original position. How this was done is demonstrated below: Since the highest y value occurs when the x value is 20, this is the peak and since the lowest y value occurs when the x value is 5, this is the trough Horizontal Translation= 20+52 =12.5 The horizontal translation or C is therefore 12.5 Lastly, to find the vertical translation or D, since we know that the general sine function passes through the point (0,0), I then simply take the y value of the median or midpoint between the peak and the trough and that number will indicate how far vertically it has moved from the origin. How this was done is demonstrated below: Vertical Translation= 21.65+15.22 =18.425 The vertical translation or D is therefore 18.425 Finally, I arrive at an equation (model) to fit Graph 1: y=3.225 sin .225x-12.5+ 18.425 The equation can be graphically represented along with the data points from Table 1 as below Graph 2: In this graph, the variables still are age and BMI; in the x-axis is age by year and in the y-axis is BMI. The parameters in Graph 1 also hold true with this graph. In this graph, the value of C that is displayed is different from what I found because LoggerPro plots sine functions as y=AsinBx-C+ D, rather than in the form y=AsinBx-C+ D; so I just basically took .225 and multiply it to -12.5 which then gives me -2.8125 as shown in the graph. From what is displayed in Graph 2, it is justified to say that the sine function best fits with the data given from Table 1. In addition, with the help of the Ti calculator, I am able to find another function that also models the data from Table 1. Since it is already demonstrated that the sine function best models the data given, it can also be said that the cosine function will also model the data given because the sine function is the cosine function shifted to the right π2 radians; what this means is demonstrated below: π223526753810190503810 radians Figure 2: Graph of cosine function (left) compared with the graph of sine function (right); these graphs are screen-shots from the TI-SmartView program The general cosine function is defined as y=AcosBx-C+ D where, A determines the Amplitude, B determines the Period, C determines the Horizontal translation, and D determines the Vertical translation. In this case, A,B and D of this cosine function will be the same as A,B and D of sine function because they will have the same amplitude, same period and the same vertical translation; however, the horizontal translation will be different due to the reason as mentioned above, the sine function is basically the cosine function shifted to the right π2 radians. Since A,B and D are the same for the cosine function, they are: The amplitude or A is therefore 3.225 The period or B is therefore .225 The vertical translation or D is therefore 18.425 To find the horizontal translation or C, I first observe that the general cosine function starts x=0 at its y maximum or peak as shown in Figure 2. So I make the conjecture that where of x, that the maximum of y occurs is how much it has moved from x=0. How this was done is demonstrated below: x-Age (yrs)Y-BMI216.40315.70415.30515.20615.21715.40815.80916.301016.801117.501218.181318.701419.361519.881620.401720.851821.221921.602021.65 Original Table 1: Since the greatest y-value occurs at x=20, so I say that the peak has moved 20 from X=0; therefore, the horizontal translation or C, is 20. Finally, I arrive at another equation (model) to fit Graph 1: y=3.225 cos .225x-20.0+ 18.425 This equation can be graphically represented below Graph 3: In this graph, the variables still are age and BMI; in the x-axis is age by year and in the y-axis is BMI. The parameters in Graph 1 also hold true with this graph. In this graph, the value of C that is displayed is different from what I found because LoggerPro plots cosine functions as y=AcosBx-C+ D, rather than in the form y=AcosBx-C+ D; so I just basically took .225 and multiply it to -20.0 which then gives me -4.5 as shown in the graph. The sine and cosine function are both graphically represented below: Graph 4: In this graph the best fit model function, the sine function, and the cosine function are both plotted. The two models are slightly different because as said, the sine model function is the best fit model function, any other functions would just rather be a representation of the data but none can better fitted than the sine function. According to my model function: y=3.225 sin .225x-12.5+ 18.425 A 30-year-old woman in the US would have a BMI of approximately 16.68 kg/m2; how this was done is demonstrated below: Plug 29 for x because when I plug x as 1 I get, 16.7=3.225 sin .2251-12.5+ 18.425 Which is the closest to the BMI for age 2; therefore, (age – 1) = x So (30 -1) = 29 So I plug in 29 for x and I get 16.68=3.225 sin .22529-12.5+ 18.425 So a 30 year old woman in the US would have a BMI of approximately 16.68 kg/m2? That result, to many researchers of BMI, would not sound reasonable and convincing because it is hardly ever the case that a 30 year old woman would be in a better shape (BMI wise) than a 18 year old teenager. Most likely it will be that the 30 year old woman would have a higher BMI number than a 18 year old teenager. From internet, I found a set of BMI data for females from England age between 0-15 years old. The data is presented below in a form of a simplified table rather than the original gigantic chart that I found: AgeMean BMI of Girls in UK year 2002015.7116.3216.7316.6416.8516.3616.5716.8817.4917.91018.81119.91220.01320.81422.11522.2 Table 2: (Source: http://www.erpho.org.uk/viewResource.aspx?id=8993) I then tried my model onto this new set of data shown below Graph 5: Obviously, my sine model does not fit this new set of BMI data in the UK at all. More or less, the new set of data resembles a quadratic function, so I tried it on another graph below. Graph 6: Unsurprisingly, this quadratic function works much better on the new set of data from England. In this graph, I adjusted the x-axis because in the data I obtained of English girls’ BMI, the age only ranges from 0-15 years rather than 2-20 years. As a conclusion, although the sine model I found best fits the data given in Table 1, it is not applicable to other sets of data, it is only limited to the set of data given in Table 1. One thing that differentiates the data given in Table 1 from Table 2 is that in Table 1, the numbers are medians; on the other hand, the numbers in Table 2 are means.