The Triple Threat | Article on Global Resession | Harsh Kumar
Ahsan z
1. AHSAN ALI SP09-MBA-014
SOME IMPORTANT THINGS
Pakistan Inflation Rate
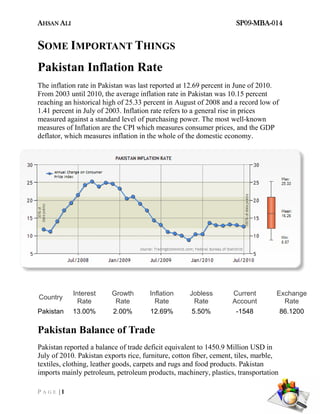
The inflation rate in Pakistan was last reported at 12.69 percent in June of 2010.
From 2003 until 2010, the average inflation rate in Pakistan was 10.15 percent
reaching an historical high of 25.33 percent in August of 2008 and a record low of
1.41 percent in July of 2003. Inflation rate refers to a general rise in prices
measured against a standard level of purchasing power. The most well-known
measures of Inflation are the CPI which measures consumer prices, and the GDP
deflator, which measures inflation in the whole of the domestic economy.
Interest Growth Inflation Jobless Current Exchange
Country
Rate Rate Rate Rate Account Rate
Pakistan 13.00% 2.00% 12.69% 5.50% -1548 86.1200
Pakistan Balance of Trade
Pakistan reported a balance of trade deficit equivalent to 1450.9 Million USD in
July of 2010. Pakistan exports rice, furniture, cotton fiber, cement, tiles, marble,
textiles, clothing, leather goods, carpets and rugs and food products. Pakistan
imports mainly petroleum, petroleum products, machinery, plastics, transportation
P A G E |1
2. AHSAN ALI SP09-MBA-014
equipment, edible oils, paper and paperboard, iron and steel and tea. Its main
trading partners are: European Union, China, The United Arab Emirates and The
United States.
Year Jan Feb Mar Apr May Jun Jul Aug Sep Oct Nov Dec
2010 -1620.7 -964.6 -1479.8 -1278.4 -1609.7 -1404.9 -1450.9
2009 -1168.0 -857.2 -1041.9 -1435.9 -1061.5 -1801.6 -1150.4 -1044.0 -897.9 -1421.0 -986.5 -1326.3
2008 -2053.0 -2104.0 -2037.0 -2291.5 -1937.6 -1971.6 -1644.0 -1877.8 -2027.3 -1948.1 -1196.4 -815.9
Pakistan Current Account
Pakistan reported a current account deficit equivalent to 1548.0 Million USD in
December of 2010. Pakistan exports rice, furniture, cotton fiber, cement, tiles,
marble, textiles, clothing, leather goods, carpets and rugs and food products.
Pakistan imports mainly petroleum, petroleum products, machinery, plastics,
transportation equipment, edible oils, paper and paperboard, iron and steel and tea.
Its main trading partners are: European Union, China, The United Arab Emirates
and The United States.
P A G E |2
3. AHSAN ALI SP09-MBA-014
Year Mar Jun Sep Dec
2010 -740.0 -642.0 -587.0 -1548.0
2009 -545.0 -878.0 -587.0 -1548.0
2008 -3790.0 -4194.0 -4140.0 -3434.0
About Current Account
Current Account is the sum of the balance of trade (exports minus imports of
goods and services), net factor income (such as interest and dividends) and net
transfer payments (such as foreign aid). The balance of trade is typically the most
important part of the current account. This means that changes in the patterns of
trade are key drivers in the current accounts of most of the world's economies.
However, for the few countries with substantial overseas assets or liabilities, net
factor payments may be significant. Positive net sales to abroad generally
contribute to a current account surplus; negative net sales to abroad generally
contribute to a current account deficit. Because exports generate positive net sales,
and because the trade balance is typically the largest component of the current
account, a current account surplus is usually associated with positive net exports.
The net factor income or income account, a sub-account of the current account, is
usually presented under the headings income payments as outflows, and income
receipts as inflows. Income refers not only to the money received from investments
made abroad (note: investments are recorded in the capital account but income
from investments is recorded in the current account) but also to the money sent by
individuals working abroad, known as remittances, to their families back home. If
the income account is negative, the country is paying more than it is taking in
interest, dividends, etc. For example, the United States' net income has been
declining exponentially since it has allowed the dollar's price relative to other
P A G E |3
4. AHSAN ALI SP09-MBA-014
currencies to be determined by the market to a point where income payments and
receipts are roughly equal of trade forms part of the current account, which also
includes other transactions such as income from the international investment
position as well as international aid. If the current account is in surplus, the
country's net international asset position increases correspondingly. Equally, a
deficit decreases the net international asset position.
Pakistan Government Budget
Pakistan had a government budget surplus in 2009 equivalent to 5.30 percent of the
Gross Domestic Product (GDP). Government Budget is an itemized accounting of
the payments received by government (taxes and other fees) and the payments
made by government (purchases and transfer payments). A budget deficit occurs
when a government spends more money than it takes in. The opposite of a budget
deficit is a budget surplus.
Pakistan Government Bond 10 Year Yield
Pakistan's Government Bond Yield for 10 Year Notes rallied 115 basis points
during the last 12 months. From 2002 until 2010 Pakistan's Government Bond
Yield for 10 Year Notes averaged 9.77 percent reaching an historical high of 16.65
percent in December of 2008 and a record low of 4.17 percent in March of 2003.
Generally, a government bond is issued by a national government and is
denominated in the country`s own currency. Bonds issued by national governments
in foreign currencies are normally referred to as sovereign bonds. The yield
required by investors to loan funds to governments reflects inflation expectations
and the likelihood that the debt will be repaid.
P A G E |4
5. AHSAN ALI SP09-MBA-014
Year Jan Feb Mar Apr May Jun Jul Aug Sep Oct Nov Dec
2010 12.52 12.57 12.66 12.57 12.57 12.70 12.97 13.34 13.62
2009 15.82 14.59 12.52 12.63 12.48 12.08 11.62 12.10 12.46 12.70 12.48 12.63
2008 10.63 11.20 11.35 11.47 12.01 12.87 14.13 14.16 14.44 14.56 15.89 16.51
* The table above displays the monthly average.
Pakistan GDP Growth Rate
The Pakistan economy expanded 2.00 percent over the last year, as measured by
the year-over-year change in Gross Domestic Product (GDP YoY). Unlike the
commonly used quarterly GDP growth rate the annual GDP growth rate takes into
account a full year of economic activity, thus avoiding the need to make any type
of seasonal adjustment. The Pakistan Gross Domestic Product is worth 167 billion
dollars or 0.27% of the world economy, according to the World Bank. From 1998
until 2009, Pakistan's average annual GDP Growth was 4.92 percent reaching an
historical high of 9.00 percent in December of 2005 and a record low of 2.00
percent in December of 2001
P A G E |5
6. AHSAN ALI SP09-MBA-014
PAKISTAN - NATIONAL STATISTICAL DATA
Latest Value Scale Units
Pakistan Balance of Trade -1450.90 Million USD
Pakistan Current Account -1548.00 Million USD
USDPKR Exchange Rate 86.20
Pakistan Exports 1787.90 Million USD
Pakistan Gross Domestic Product (GDP) 166.55 Billion USD
Pakistan GDP Growth Rate 2.00 %
Pakistan GDP per capita (Constant Prices Since 2000) 650.00 USD
Pakistan GDP per capita (Purchasing Power Parity PPP) 2538.00 USD
Pakistan Government Bond 10 Year Yield 13.61 PKR
Pakistan Government Budget 5.30 %
Pakistan Imports 3238.80 Million USD
Pakistan Inflation Rate 12.69 %
Pakistan Interest Rate 13.00
Pakistan Stock Market Index 10006.97 PKR
Pakistan Unemployment Rate 5.50 %
PAKISTAN - IMF DATA & FORECASTS
2010 2015 Scale Units
Pakistan GDP at constant prices 5859.58 7477.63 Billions Pakistan Rupee
Pakistan percent change in GDP at
3.00 6.00 Percent change
constant prices
Pakistan GDP at current prices 15039.00 26046.42 Billions Pakistan Rupee
Pakistan GDP at current prices in US
177.90 246.23 Billions U.S. dollars
dollars
Pakistan GDP deflator 256.66 348.33 Index
Pakistan GDP per Capita at constant
35176.13 41419.39 Units Pakistan Rupee
prices
Pakistan GDP per Capita at current
90281.80 144273.87 Units Pakistan Rupee
prices
Pakistan GDP per Capita at current
1067.97 1363.91 Units U.S. dollars
prices in US dollars
Pakistan GDP based on Purchasing
Current international
Power Parity (PPP) valuation of 451.97 630.25 Billions
dollar
country GDP
Pakistan GDP based on Purchasing Current international
2713.27 3491.03 Units
Power Parity (PPP) per capita GDP dollar
P A G E |6
7. AHSAN ALI SP09-MBA-014
Pakistan GDP based on Purchasing
0.63 0.64 Percent
Power Parity (PPP) share of world total
National currency per
Pakistan Implied Purchasing Power
33.27 41.33 current international
Parity (PPP) conversion rate
dollar
Pakistan Consumer Prices Index
221.18 300.18 Index; 2000=100
average
Pakistan Inflation average 11.50 6.00 Percent change
Pakistan Consumer Prices Index end-
226.00 308.14 Index; 2000=100
of-period
Pakistan Inflation end-of-period 12.00 6.00 Percent change
Pakistan Population 166.58 180.54 Millions Persons
Pakistan Current account balance in US
-6.80 -8.41 Billions U.S. dollars
dollars
Pakistan Current account balance in
-3.82 -3.42 Percent of GDP
percent of GDP
PAKISTAN - WORLD BANK DATA
Previous Last
Adjusted net savings; excluding particulate emission damage
13 7
(% of GNI) in Pakistan
Adjusted net savings; excluding particulate emission damage
16003192948 8074260781
(US dollar) in Pakistan
Adjusted net savings; including particulate emission damage
12 6
(% of GNI) in Pakistan
Adjusted net savings; including particulate emission damage
15121129046 7192196879
(US dollar) in Pakistan
Adjusted savings: carbon dioxide damage (% of
1 1
GNI) in Pakistan
Adjusted savings: carbon dioxide damage (US
1067891687 1113155322
dollar) in Pakistan
Adjusted savings: consumption of fixed capital (% of
8 8
GNI) in Pakistan
Adjusted savings: consumption of fixed capital (US
11793866523 13833293506
dollar) in Pakistan
Adjusted savings: education expenditure (% of
2 2
GNI) in Pakistan
Adjusted savings: education expenditure (US
30112088 35962907
dollar) in Pakistan
Adjusted savings: energy depletion (% of GNI) in Pakistan 4 5
P A G E |7
8. AHSAN ALI SP09-MBA-014
Adjusted savings: energy depletion (US dollar) in Pakistan 5502715225 8290359263
Adjusted savings: gross savings (% of GNI) in Pakistan 24 19
Adjusted savings: mineral depletion (% of GNI) in Pakistan 0 0
Adjusted savings: mineral depletion (US dollar) in Pakistan 132919 635823
Adjusted savings: net forest depletion (% of GNI) in Pakistan 1 1
Adjusted savings: net forest depletion (US dollar) in Pakistan 1358972928 1163383734
Adjusted savings: net national savings (% of GNI) in Pakistan 16 11
Adjusted savings: net national savings (US dollar) in Pakistan 23902793617 18605832016
Adjusted savings: particulate emission damage (% of
1 1
GNI) in Pakistan
Adjusted savings: particulate emission damage (US
882063901 882063901
dollar) in Pakistan
Adolescent fertility rate (births per 1;000 women ages 15-
46 45
19) in Pakistan
Age dependency ratio; old (% of working-age
7 7
population) in Pakistan
Age dependency ratio (% of working-age
71 70
population) in Pakistan
Age dependency ratio; young (% of working-age
64 63
population) in Pakistan
Agricultural irrigated land (% of total agricultural
land) in Pakistan
Agricultural land (% of land area) in Pakistan 35
Agricultural land (sq. km) in Pakistan 273000
Agricultural machinery; tractors per 100 sq. km of arable
219
land in Pakistan
Agricultural machinery; tractors in Pakistan 470000
Agricultural methane emissions (% of total) in Pakistan
Agricultural nitrous oxide emissions (% of total) in Pakistan
Agricultural raw materials exports (% of merchandise
1 1
exports) in Pakistan
Agricultural raw materials imports (% of merchandise
5 5
imports) in Pakistan
Agriculture; value added (annual % growth) in Pakistan 4 1
Agriculture; value added (constant 2000 US
21977037932 22213481517
dollar) in Pakistan
Agriculture; value added (constant LCU) in Pakistan 1137037000000 1149270000000
Agriculture; value added (current LCU) in Pakistan 1685240000000 2016553000000
Agriculture value added per worker (constant 2000 US
908 892
dollar) in Pakistan
Agriculture; value added (% of GDP) in Pakistan 20 20
Agriculture; value added (US dollar) in Pakistan 27825576657 32262711009
P A G E |8
9. AHSAN ALI SP09-MBA-014
Air transport; freight (million ton-km) in Pakistan 314 320
Air transport; passengers carried in Pakistan 5439144 5605758
Air transport; registered carrier departures
51029 52165
worldwide in Pakistan
Alternative and nuclear energy (% of total energy
4
use) in Pakistan
Annual freshwater withdrawals; agriculture (% of total
96
freshwater withdrawal) in Pakistan
Annual freshwater withdrawals; domestic (% of total
2
freshwater withdrawal) in Pakistan
Annual freshwater withdrawals; industry (% of total
2
freshwater withdrawal) in Pakistan
Annual freshwater withdrawals; total (billion cubic
meters) in Pakistan
Annual freshwater withdrawals; total (% of internal
308
resources) in Pakistan
Arable land (hectares per person) in Pakistan 0
Arable land (hectares) in Pakistan 21500000
Arable land (% of land area) in Pakistan 28
ARI treatment (% of children under 5 taken to a health
69
provider) in Pakistan
Armed forces personnel (% of total labor force) in Pakistan 2 2
Armed forces personnel; total in Pakistan 921000 921000
Arms exports (constant 1990 US dollar) in Pakistan
Arms imports (constant 1990 US dollar) in Pakistan 605000000 1094000000
Average grace period on new external debt commitments;
8 6
official (years) in Pakistan
Average grace period on new external debt commitments;
9 0
private (years) in Pakistan
Average grace period on new external debt commitments
8 6
(years) in Pakistan
Average grant element on new external debt commitments;
54 54
official (%) in Pakistan
Average grant element on new external debt commitments
46 54
(%) in Pakistan
Average grant element on new external debt commitments;
18 0
private (%) in Pakistan
Average interest on new external debt commitments; official
3 2
(%) in Pakistan
Average interest on new external debt commitments
4 2
(%) in Pakistan
Average interest on new external debt commitments; private 7 0
P A G E |9
10. AHSAN ALI SP09-MBA-014
(%) in Pakistan
Average maturity on new external debt commitments; official
29 23
(years) in Pakistan
Average maturity on new external debt commitments; private
9 0
(years) in Pakistan
Average maturity on new external debt commitments
24 23
(years) in Pakistan
Average number of times firms spent in meetings with tax
2
officials in Pakistan
Average precipitation in depth (mm per year) in Pakistan 494
Average time to clear exports through customs
5
(days) in Pakistan
Bank capital to assets ratio (%) in Pakistan 11 10
Bank liquid reserves to bank assets ratio (%) in Pakistan 9
Bank nonperfoming loans to total gross loans (%) in Pakistan 7 9
Battle-related deaths (number of people) in Pakistan 3714 6665
Binding coverage; all products (%) in Pakistan 99
Binding coverage; manufactured products (%) in Pakistan 99
Binding coverage; primary products (%) in Pakistan 98
Bird species; threatened in Pakistan 27
Birth rate; crude (per 1;000 people) in Pakistan 30 30
Births attended by skilled health staff (% of total) in Pakistan 39
Bound rate; simple mean; all products (%) in Pakistan 60
Bound rate; simple mean; manufactured products
55
(%) in Pakistan
Bound rate; simple mean; primary products (%) in Pakistan 77
Burden of customs procedure; WEF (1=extremely inefficient
3 3
to 7=extremely efficient) in Pakistan
Business extent of disclosure index (0=less disclosure to
6 6
10=more disclosure) in Pakistan
Cash surplus/deficit (current LCU) in Pakistan -361961000000 -761721000000
Cash surplus/deficit (% of GDP) in Pakistan -4 -7
Central government debt; total (current LCU) in Pakistan
Central government debt; total (% of GDP) in Pakistan
Cereal yield (kg per hectare) in Pakistan 2741 2674
Changes in inventories (constant LCU) in Pakistan 87647000000 91850000000
Changes in inventories (current LCU) in Pakistan 138768000000 164550000000
Changes in inventories (US dollar) in Pakistan 2291246126 2632625622
Changes in net reserves (BoP; US dollar) in Pakistan -2516822608 9395664266
Children out of school; primary; female in Pakistan 4183500 4201000
Children out of school; primary; male in Pakistan 2989823 3059509
P A G E | 10
11. AHSAN ALI SP09-MBA-014
Children out of school; primary in Pakistan 7173323 7260509
Children with fever receiving antimalarial drugs (% of
3
children under age 5 with fever) in Pakistan
Claims on governments and other public entities (current
1081797201334
LCU) in Pakistan
Claims on governments; etc. (annual growth as % of
7
M2) in Pakistan
Claims on private sector (annual growth as % of
10
M2) in Pakistan
CO2 emissions (kg per 2000 US dollar of GDP) in Pakistan
CO2 emissions (kg per 2005 PPP dollar of GDP) in Pakistan
CO2 emissions (kg per PPP dollar of GDP) in Pakistan
CO2 emissions (kt) in Pakistan
CO2 emissions (metric tons per capita) in Pakistan
CO2 intensity (kg per kg of oil equivalent energy
use) in Pakistan
Combustible renewables and waste (metric tons of oil
equivalent) in Pakistan
Combustible renewables and waste (% of total
34
energy) in Pakistan
Commercial banks and other lending (PPG + PNG) (NFL; US
-268978000 652227000
dollar) in Pakistan
Commercial service exports (US dollar) in Pakistan 2223700000 2393000000
Commercial service imports (US dollar) in Pakistan 8425700000 9079000000
Commitments; IBRD (COM; US dollar) in Pakistan 100000000 173600000
Commitments; IDA (COM; US dollar) in Pakistan 1109990000 161900000
Commitments; official creditors (COM; US dollar) in Pakistan 2793450000 3534947000
Commitments; private creditors (COM; US dollar) in Pakistan 875000000 0
Commitments; public and publicly guaranteed (COM; US
3668450000 3534947000
dollar) in Pakistan
Communications; computer; etc. (% of service exports;
62 62
BoP) in Pakistan
Communications; computer; etc. (% of service imports;
BoP) in Pakistan
Community health workers (per 1;000 people) in Pakistan
Compensation of employees (current LCU) in Pakistan 60717000000 67920000000
Compensation of employees (% of expense) in Pakistan 4 4
Completeness of infant death reporting (% of reported infant
deaths to estimated infant deaths) in Pakistan
Computer; communications and other services (% of
35 35
commercial service exports) in Pakistan
Computer; communications and other services (% of 39 35
P A G E | 11
12. AHSAN ALI SP09-MBA-014
commercial service imports) in Pakistan
Concessional debt (% of total external debt) in Pakistan 68 61
Consumer price index (2005 = 100) in Pakistan 116 140
Consumption of iodized salt (% of households) in Pakistan
Container port traffic (TEU: 20 foot equivalent
1935882 1938001
units) in Pakistan
Contraceptive prevalence (% of women ages 15-
30
49) in Pakistan
Cost of business start-up procedures (% of GNI per
14 13
capita) in Pakistan
Cost to export (US dollar per container) in Pakistan 515 611
Cost to import (US dollar per container) in Pakistan 648 680
CPIA building human resources rating (1=low to
4 4
6=high) in Pakistan
CPIA business regulatory environment rating (1=low to
4 4
6=high) in Pakistan
CPIA debt policy rating (1=low to 6=high) in Pakistan 5 4
CPIA economic management cluster average (1=low to
4 3
6=high) in Pakistan
CPIA efficiency of revenue mobilization rating (1=low to
4 3
6=high) in Pakistan
CPIA equity of public resource use rating (1=low to
4 4
6=high) in Pakistan
CPIA financial sector rating (1=low to 6=high) in Pakistan 5 4
CPIA fiscal policy rating (1=low to 6=high) in Pakistan 4 3
CPIA gender equality rating (1=low to 6=high) in Pakistan 2 2
CPIA macroeconomic management rating (1=low to
4 3
6=high) in Pakistan
CPIA policies for social inclusion/equity cluster average
3 3
(1=low to 6=high) in Pakistan
CPIA policy and institutions for environmental sustainability
4 3
rating (1=low to 6=high) in Pakistan
CPIA property rights and rule-based governance rating (1=low
3 3
to 6=high) in Pakistan
CPIA public sector management and institutions cluster
3 3
average (1=low to 6=high) in Pakistan
CPIA quality of budgetary and financial management rating
4 4
(1=low to 6=high) in Pakistan
CPIA quality of public administration rating (1=low to
4 4
6=high) in Pakistan
CPIA social protection rating (1=low to 6=high) in Pakistan 3 3
CPIA structural policies cluster average (1=low to 4 4
P A G E | 12
13. AHSAN ALI SP09-MBA-014
6=high) in Pakistan
CPIA trade rating (1=low to 6=high) in Pakistan 4 4
CPIA transparency; accountability; and corruption in the
3 3
public sector rating (1=low to 6=high) in Pakistan
Credit depth of information index (0=low to
4 4
6=high) in Pakistan
Crop production index (1999-2001 = 100) in Pakistan 117
Cross-currency valuation (US dollar) in Pakistan 1667397352 1967777201
Currency composition of PPG debt; all other currencies
2 2
(%) in Pakistan
Currency composition of PPG debt; Deutsche mark
(%) in Pakistan
Currency composition of PPG debt; Euro (%) in Pakistan 11 10
Currency composition of PPG debt; French franc
(%) in Pakistan
Currency composition of PPG debt; Japanese yen
16 18
(%) in Pakistan
Currency composition of PPG debt; Multiple currencies
15 14
(%) in Pakistan
Currency composition of PPG debt; Pound sterling
0 0
(%) in Pakistan
Currency composition of PPG debt; SDR (%) in Pakistan 12 13
Currency composition of PPG debt; Swiss franc
0 0
(%) in Pakistan
Currency composition of PPG debt; U.S. dollars
44 44
(%) in Pakistan
Current account balance (BoP; US dollar) in Pakistan -8286000000 -15401800000
Current account balance (% of GDP) in Pakistan -6 -9
Current transfers; receipts (BoP; US dollar) in Pakistan 11216000000 11146000000
Customs and other import duties (current LCU) in Pakistan
Customs and other import duties (% of tax
revenue) in Pakistan
Daily newspapers (per 1;000 people) in Pakistan
Death rate; crude (per 1;000 people) in Pakistan 7 7
Debt buyback (US dollar) in Pakistan 0 0
Debt forgiveness grants (US dollar) in Pakistan 0 0
Debt forgiveness or reduction (US dollar) in Pakistan -1300000 0
Debt service on external debt; long-term (TDS; US
2327460000 2709493000
dollar) in Pakistan
Debt service on external debt; private nonguaranteed (PNG)
403473000 663971000
(TDS; US dollar) in Pakistan
Debt service on external debt; public and publicly guaranteed 1923987000 2045522000
P A G E | 13
14. AHSAN ALI SP09-MBA-014
(PPG) (TDS; US dollar) in Pakistan
Debt service on external debt; total (TDS; US
2600404000 2940448000
dollar) in Pakistan
Debt service (PPG and IMF only; % of exports; excluding
9 8
workers' remittances) in Pakistan
Debt stock reduction (US dollar) in Pakistan 0 0
Debt stock rescheduled (US dollar) in Pakistan 0 0
DEC alternative conversion factor (LCU per US
61 63
dollar) in Pakistan
Deposit interest rate (%) in Pakistan 5 7
Depth of hunger (kilocalories per person per day) in Pakistan
Diarrhea treatment (% of children under 5 receiving oral
37
rehydration and continued feeding) in Pakistan
Disbursements on external debt; long-term + IMF (DIS; US
3173162000 6878569000
dollar) in Pakistan
Disbursements on external debt; long-term (DIS; US
3173162000 3677958000
dollar) in Pakistan
Disbursements on external debt; private nonguaranteed (PNG)
0 1109810000
(DIS; US dollar) in Pakistan
Disbursements on external debt; public and publicly
3173162000 2568148000
guaranteed (PPG) (DIS; US dollar) in Pakistan
Documents to export (number) in Pakistan 9 9
Documents to import (number) in Pakistan 8 8
Domestic credit provided by banking sector (% of
46
GDP) in Pakistan
Domestic credit to private sector (% of GDP) in Pakistan 30
Ease of doing business index (1=most business-friendly
85
regulations) in Pakistan
EBRD; private nonguaranteed (NFL; US dollar) in Pakistan 0 0
Economically active population in agriculture
24210000 24902000
(number) in Pakistan
Electric power consumption (kWh per capita) in Pakistan 474
Electric power consumption (kWh) in Pakistan 77088000000
Electric power transmission and distribution losses
18603000000
(kWh) in Pakistan
Electric power transmission and distribution losses (% of
19
output) in Pakistan
Electricity production from coal sources (kWh) in Pakistan 136000000
Electricity production from coal sources (% of
0
total) in Pakistan
Electricity production from hydroelectric sources
28707000000
(kWh) in Pakistan
P A G E | 14
15. AHSAN ALI SP09-MBA-014
Electricity production from hydroelectric sources (% of
30
total) in Pakistan
Electricity production from natural gas sources
32923000000
(kWh) in Pakistan
Electricity production from natural gas sources (% of
34
total) in Pakistan
Electricity production from nuclear sources (kWh) in Pakistan 3077000000
Electricity production from nuclear sources (% of
3
total) in Pakistan
Electricity production from oil sources (kWh) in Pakistan 30848000000
Electricity production from oil sources (% of total) in Pakistan 32
Electricity production (kWh) in Pakistan 95691000000
Emigration rate of tertiary educated (% of total tertiary
educated population) in Pakistan
Employees; agriculture; female (% of female
72
employment) in Pakistan
Employees; agriculture; male (% of male
36
employment) in Pakistan
Employees; industry; female (% of female
13
employment) in Pakistan
Employees; industry; male (% of male
23
employment) in Pakistan
Employees; services; female (% of female
15
employment) in Pakistan
Employees; services; male (% of male
41
employment) in Pakistan
Employment in agriculture (% of total
44
employment) in Pakistan
Employment in industry (% of total employment) in Pakistan 21
Employment in services (% of total employment) in Pakistan 35
Employment to population ratio; 15+; female (%) in Pakistan 19 20
Employment to population ratio; 15+; male (%) in Pakistan 81 81
Employment to population ratio; 15+; total (%) in Pakistan 51 52
Employment to population ratio; ages 15-24; female
16 17
(%) in Pakistan
Employment to population ratio; ages 15-24; male
69 69
(%) in Pakistan
Employment to population ratio; ages 15-24; total
43 44
(%) in Pakistan
Energy imports; net (% of energy use) in Pakistan 24
Energy production (kt of oil equivalent) in Pakistan 63643
Energy related methane emissions (% of total) in Pakistan
P A G E | 15
16. AHSAN ALI SP09-MBA-014
Energy related nitrous oxide emissions (% of total) in Pakistan
Energy use (kg of oil equivalent per capita) in Pakistan 512
Energy use (kg of oil equivalent) per dollar1;000 GDP
218
(constant 2005 PPP) in Pakistan
Energy use (kt of oil equivalent) in Pakistan 83271
Exclusive breastfeeding (% of children under 6
37
months) in Pakistan
Expense (current LCU) in Pakistan 1415575000000 1908669000000
Expense (% of GDP) in Pakistan 16 19
Export value index (2000 = 100) in Pakistan 198 225
Export volume index (2000 = 100) in Pakistan 180 182
Exports as a capacity to import (constant LCU) in Pakistan 643583307255 539303181328
Exports of goods and services (annual % growth) in Pakistan 2 -5
Exports of goods and services (BoP; US dollar) in Pakistan 21955100000 25454200000
Exports of goods and services (constant 2000 US
19099569944 18077854554
dollar) in Pakistan
Exports of goods and services (constant LCU) in Pakistan 988164000000 935303000000
Exports of goods and services (current LCU) in Pakistan 1230660000000 1316439000000
Exports of goods and services (% of GDP) in Pakistan 14 13
Exports of goods and services (US dollar) in Pakistan 20319850092 21061628937
Exports of goods; services and income (BoP; US
23312100000 26766200000
dollar) in Pakistan
Exports of goods; services; income and workers' remittances
29304100000 33791200000
(BoP; US dollar) in Pakistan
External balance on goods and services (constant
13767000064 -53271998464
LCU) in Pakistan
External balance on goods and services (current
-620428000000 -1131010000000
LCU) in Pakistan
External balance on goods and services (% of
-7 -11
GDP) in Pakistan
External balance on goods and services (US dollar) in Pakistan -10244099876 -18094961441
External debt stocks; concessional (DOD; US
27844205000 29922433000
dollar) in Pakistan
External debt stocks; long-term (DOD; US dollar) in Pakistan 37127289000 43590598000
External debt stocks; long-term private sector (DOD; US
1167308000 4246442000
dollar) in Pakistan
External debt stocks; long-term public sector (DOD; US
35959981000 39344156000
dollar) in Pakistan
External debt stocks (% of exports of goods; services and
139 146
income) in Pakistan
External debt stocks (% of GNI) in Pakistan 28 29
External debt stocks; private nonguaranteed (PNG) (DOD; US 1153271000 4232073000
P A G E | 16
17. AHSAN ALI SP09-MBA-014
dollar) in Pakistan
External debt stocks; public and publicly guaranteed (PPG)
35974018000 39358525000
(DOD; US dollar) in Pakistan
External debt stocks; short-term (DOD; US dollar) in Pakistan 2228000000 1395000000
External debt stocks; total (DOD; US dollar) in Pakistan 40736615000 49337417000
External debt stocks; variable rate (DOD; US
8746168000 13347721000
dollar) in Pakistan
External resources for health (% of total expenditure on
3
health) in Pakistan
Female adults with HIV (% of population ages 15+ with
29
HIV) in Pakistan
Fertility rate; total (births per woman) in Pakistan 4 4
Fertilizer consumption (kilograms per hectare of arable
1662
land) in Pakistan
Fertilizer consumption (metric tons) in Pakistan
Fertilizer consumption (% of fertilizer production) in Pakistan 131
Final consumption expenditure (constant LCU) in Pakistan 4415038000000 4571174000000
Final consumption expenditure; etc. (annual %
3 4
growth) in Pakistan
Final consumption expenditure; etc. (constant 2000 US
85335436002 88353288541
dollar) in Pakistan
Final consumption expenditure; etc. (constant
4415038000000 4571174000000
LCU) in Pakistan
Final consumption expenditure; etc. (current LCU) in Pakistan 7340047000000 9155647000000
Final consumption expenditure; etc. (% of GDP) in Pakistan 85 89
Final consumption expenditure; etc. (US dollar) in Pakistan 121194037921 146480649536
Financing via international capital markets (gross inflows; %
2 0
of GDP) in Pakistan
Firms offering formal training (% of firms) in Pakistan 7
Firms using banks to finance investment (% of
10
firms) in Pakistan
Firms with female participation in ownership (% of
firms) in Pakistan
Fish species; threatened in Pakistan 22
Fixed broadband Internet access tariff (US dollar per
18
month) in Pakistan
Fixed broadband Internet subscribers (per 100
0 0
people) in Pakistan
Fixed broadband Internet subscribers in Pakistan 45153 168082
Food exports (% of merchandise exports) in Pakistan 12 18
Food imports (% of merchandise imports) in Pakistan 9 12
Food production index (1999-2001 = 100) in Pakistan 124
P A G E | 17
18. AHSAN ALI SP09-MBA-014
Foreign direct investment; net (BoP; US dollar) in Pakistan 5492000000 5389000000
Foreign direct investment; net inflows (BoP; US
5590000000 5438000000
dollar) in Pakistan
Foreign direct investment; net inflows in reporting economy
5590000000 5438000000
(DRS; US dollar) in Pakistan
Foreign direct investment; net inflows (% of GDP) in Pakistan 4 3
Foreign direct investment; net outflows (% of
0 0
GDP) in Pakistan
Forest area (% of land area) in Pakistan 2
Forest area (sq. km) in Pakistan 18164
Fossil fuel energy consumption (% of total) in Pakistan 62
Fuel exports (% of merchandise exports) in Pakistan 6 6
Fuel imports (% of merchandise imports) in Pakistan 26 33
GDP (constant 2000 US dollar) in Pakistan 105879697772 107995282352
GDP (constant LCU) in Pakistan 5477948000000 5587403000000
GDP (current LCU) in Pakistan 8673007000000 10284380000000
GDP deflator (base year varies by country) in Pakistan 158 184
GDP growth (annual %) in Pakistan 6 2
GDP per capita (constant 2000 US dollar) in Pakistan 651 650
GDP per capita (constant LCU) in Pakistan 33692 33636
GDP per capita growth (annual %) in Pakistan 3 0
GDP per capita; PPP (constant 2005 international
2348 2344
dollar) in Pakistan
GDP per capita; PPP (US dollar) in Pakistan 2489 2538
GDP per capita (US dollar) in Pakistan 881 991
GDP per person employed (constant 1990 PPP
8589 8950
dollar) in Pakistan
GDP per unit of energy use (constant 2005 PPP dollar per kg
5
of oil equivalent) in Pakistan
GDP per unit of energy use (PPP dollar per kg of oil
5
equivalent) in Pakistan
GDP; PPP (constant 2005 international dollar) in Pakistan 381813961632 389442994834
GDP; PPP (US dollar) in Pakistan 404692553952 421656979039
GDP (US dollar) in Pakistan 143202998461 164539181389
GEF benefits index for biodiversity (0 = no biodiversity
5
potential to 100 = maximum) in Pakistan
General government final consumption expenditure (annual %
-10 39
growth) in Pakistan
General government final consumption expenditure (constant
10285518241 14294911814
2000 US dollar) in Pakistan
General government final consumption expenditure (constant 532147000000 739583000000
P A G E | 18
19. AHSAN ALI SP09-MBA-014
LCU) in Pakistan
General government final consumption expenditure (current
796204000000 1278431000000
LCU) in Pakistan
General government final consumption expenditure (% of
9 12
GDP) in Pakistan
General government final consumption expenditure (US
13146397805 20453541215
dollar) in Pakistan
GINI index in Pakistan
GNI; Atlas method (US dollar) in Pakistan 140160890192 157341249528
GNI (current LCU) in Pakistan 8830638000000 10494181000000
GNI per capita; Atlas method (US dollar) in Pakistan 860 950
GNI per capita; PPP (US dollar) in Pakistan 2530 2590
GNI; PPP (US dollar) in Pakistan 412047799021 430258766979
GNI (US dollar) in Pakistan 145805698062 167895775058
Goods and services expense (current LCU) in Pakistan 440668000000 397904000000
Goods and services expense (% of expense) in Pakistan 31 21
Goods exports (BoP; US dollar) in Pakistan 18188400000 21328000000
Goods imports (BoP; US dollar) in Pakistan 28775400000 38097000000
Grants and other revenue (current LCU) in Pakistan 427616000000 398487000000
Grants and other revenue (% of revenue) in Pakistan 33 28
Grants; excluding technical cooperation (US
1006310000 987080000
dollar) in Pakistan
Gross capital formation (annual % growth) in Pakistan 13 4
Gross capital formation (constant 2000 US dollar) in Pakistan 20155341870 20943570911
Gross capital formation (constant LCU) in Pakistan 1042787000000 1083568000000
Gross capital formation (current LCU) in Pakistan 1953388000000 2259743000000
Gross capital formation (% of GDP) in Pakistan 23 22
Gross capital formation (US dollar) in Pakistan 32253060416 36153493295
Gross domestic income (constant 2000 US dollar) in Pakistan 99635000000 105200000000
Gross domestic income (constant LCU) in Pakistan 5133367307255 5191403181328
Gross domestic savings (current LCU) in Pakistan 1332960000000 1128733000000
Gross domestic savings (% of GDP) in Pakistan 15 11
Gross domestic savings (US dollar) in Pakistan 22008960540 18058531854
Gross fixed capital formation (annual % growth) in Pakistan 14 4
Gross fixed capital formation (constant 2000 US
18461270838 19168262865
dollar) in Pakistan
Gross fixed capital formation (constant LCU) in Pakistan 955140000000 991718000000
Gross fixed capital formation (current LCU) in Pakistan 1814620000000 2095193000000
Gross fixed capital formation (% of GDP) in Pakistan 21 20
Gross fixed capital formation (US dollar) in Pakistan 29961814290 33520867672
Gross intake rate in grade 1; female (% of relevant age 96 98
P A G E | 19
20. AHSAN ALI SP09-MBA-014
group) in Pakistan
Gross intake rate in grade 1; male (% of relevant age
112 114
group) in Pakistan
Gross intake rate in grade 1; total (% of relevant age
105 106
group) in Pakistan
Gross national expenditure (constant 2000 US
105490777872 109296859451
dollar) in Pakistan
Gross national expenditure (constant LCU) in Pakistan 5481360000000 5875400000000
Gross national expenditure (current LCU) in Pakistan 9293435000000 11415390000000
Gross national expenditure (% of GDP) in Pakistan 107 111
Gross national expenditure (US dollar) in Pakistan 153447098337 182634142830
Gross national income (constant LCU) in Pakistan 5216154307255 5277352181328
Gross savings (current LCU) in Pakistan 2161947630992 2027579637414
Gross savings (% of GDP) in Pakistan 25 20
Gross savings (% of GNI) in Pakistan 24 19
Gross savings (US dollar) in Pakistan 35696660140 32439125523
Gross value added at factor cost (constant 2000 US
100347174004 104459802551
dollar) in Pakistan
Gross value added at factor cost (constant LCU) in Pakistan 5191709000000 5404486000000
Gross value added at factor cost (current LCU) in Pakistan 8235099000000 9906099000000
Gross value added at factor cost (US dollar) in Pakistan 135972549016 158487086263
Health expenditure per capita; PPP (constant 2005
64
international dollar) in Pakistan
Health expenditure per capita (US dollar) in Pakistan 23
Health expenditure; private (% of GDP) in Pakistan 2
Health expenditure; public (% of GDP) in Pakistan 1
Health expenditure; public (% of government
3
expenditure) in Pakistan
Health expenditure; public (% of total health
30
expenditure) in Pakistan
Health expenditure; total (% of GDP) in Pakistan 3
High-technology exports (% of manufactured
1 2
exports) in Pakistan
High-technology exports (US dollar) in Pakistan 187951320 274677945
Highest marginal tax rate; corporate rate (%) in Pakistan 35 35
Highest marginal tax rate; individual (on income exceeding;
119043
US dollar) in Pakistan
Highest marginal tax rate; individual rate (%) in Pakistan 20 20
Hospital beds (per 1;000 people) in Pakistan 1 1
Household final consumption expenditure (annual %
5 -1
growth) in Pakistan
P A G E | 20
21. AHSAN ALI SP09-MBA-014
Household final consumption expenditure (constant 2000 US
75049916038 74058371158
dollar) in Pakistan
Household final consumption expenditure (constant
3882891000000 3831591000000
LCU) in Pakistan
Household final consumption expenditure (current
6549874933760 8346206208000
LCU) in Pakistan
Household final consumption expenditure; etc. (annual %
5 -1
growth) in Pakistan
Household final consumption expenditure; etc. (constant 2000
75049838125 74058294274
US dollar) in Pakistan
Household final consumption expenditure; etc. (constant
3882891000000 3831591000000
LCU) in Pakistan
Household final consumption expenditure; etc. (current
6543843000000 7877216000000
LCU) in Pakistan
Household final consumption expenditure; etc. (% of
75 77
GDP) in Pakistan
Household final consumption expenditure; etc. (US
108047640116 126027108320
dollar) in Pakistan
Household final consumption expenditure per capita (constant
462 446
2000 US dollar) in Pakistan
Household final consumption expenditure per capita growth
3 -3
(annual %) in Pakistan
Household final consumption expenditure; PPP (constant 2005
255435217023 252060456662
international dollar) in Pakistan
Household final consumption expenditure; PPP (US
289137405565 318057601190
dollar) in Pakistan
Household final consumption expenditure (US
108147235447 133530454648
dollar) in Pakistan
Households with television (%) in Pakistan
IBRD loans and IDA credits (DOD; US dollar) in Pakistan 11160761000 10999025000
ICT goods exports (% of total goods exports) in Pakistan 1 0
ICT goods imports (% total goods imports) in Pakistan 7 6
ICT service exports (BoP; US dollar) in Pakistan 254000000 277000000
ICT service exports (% of service exports; BoP) in Pakistan 7 7
IDA grants (US dollar) in Pakistan 2759404 106151
IDA resource allocation index (1=low to 6=high) in Pakistan 4 3
IFC; private nonguaranteed (NFL; US dollar) in Pakistan -16613039 6933261
IMF charges (INT; US dollar) in Pakistan 9464000 7127000
IMF purchases (DIS; US dollar) in Pakistan 0 3200611000
IMF repurchases (AMT; US dollar) in Pakistan 152080000 179828000
IMF repurchases and charges (TDS; US dollar) in Pakistan 161544000 186955000
Immunization; DPT (% of children ages 12-23 83 73
P A G E | 21
22. AHSAN ALI SP09-MBA-014
months) in Pakistan
Immunization; measles (% of children ages 12-23
80 85
months) in Pakistan
Import value index (2000 = 100) in Pakistan 300 390
Import volume index (2000 = 100) in Pakistan 179 182
Imports of goods and services (annual % growth) in Pakistan -3 4
Imports of goods and services (BoP; US dollar) in Pakistan 37586100000 47586000000
Imports of goods and services (constant 2000 US
18710625755 19379405654
dollar) in Pakistan
Imports of goods and services (constant LCU) in Pakistan 968041000000 1002642000000
Imports of goods and services (current LCU) in Pakistan 1851088000000 2447449000000
Imports of goods and services (% of GDP) in Pakistan 21 24
Imports of goods and services (US dollar) in Pakistan 30563949968 39156590378
Imports of goods; services and income (BoP; US
42683100000 53192000000
dollar) in Pakistan
Improved sanitation facilities (% of population with
access) in Pakistan
Improved sanitation facilities; rural (% of rural population
with access) in Pakistan
Improved sanitation facilities; urban (% of urban population
with access) in Pakistan
Improved water source (% of population with
access) in Pakistan
Improved water source; rural (% of rural population with
access) in Pakistan
Improved water source; urban (% of urban population with
access) in Pakistan
Incidence of tuberculosis (per 100;000 people) in Pakistan 231 231
Income payments (BoP; US dollar) in Pakistan 5097000000 5606000000
Income receipts (BoP; US dollar) in Pakistan 1357000000 1312000000
Income share held by fourth 20% in Pakistan
Income share held by highest 10% in Pakistan
Income share held by highest 20% in Pakistan
Income share held by lowest 10% in Pakistan
Income share held by lowest 20% in Pakistan
Income share held by second 20% in Pakistan
Income share held by third 20% in Pakistan
Industry; value added (annual % growth) in Pakistan 9 2
Industry; value added (constant 2000 US dollar) in Pakistan 26432187327 26882113513
Industry; value added (constant LCU) in Pakistan 1367532000000 1390810000000
Industry; value added (current LCU) in Pakistan 2214612000000 2665897000000
P A G E | 22
23. AHSAN ALI SP09-MBA-014
Industry; value added (% of GDP) in Pakistan 27 27
Industry; value added (US dollar) in Pakistan 36566219632 42651526883
Inflation; consumer prices (annual %) in Pakistan 8 20
Inflation; GDP deflator (annual %) in Pakistan 8 16
Informal payments to public officials (% of firms) in Pakistan 27
Information and communication technology expenditure per
38 43
capita (US dollar) in Pakistan
Information and communication technology expenditure (% of
4 4
GDP) in Pakistan
Information and communication technology expenditure (US
6240672980 7184233113
dollar) in Pakistan
Insurance and financial services (% of commercial service
5 5
exports) in Pakistan
Insurance and financial services (% of commercial service
3 4
imports) in Pakistan
Insurance and financial services (% of service exports;
3 3
BoP) in Pakistan
Insurance and financial services (% of service imports;
3 4
BoP) in Pakistan
Intentional homicide rate (per 100;000 people; CTS and
national sources) in Pakistan
Intentional homicide rate (per 100;000 people;
WHO) in Pakistan
Interest arrears; official creditors (US dollar) in Pakistan 0 0
Interest arrears; private creditors (US dollar) in Pakistan 0 0
Interest arrears; public and publicly guaranteed (US
0 0
dollar) in Pakistan
Interest forgiven (US dollar) in Pakistan 0 0
Interest payments (current LCU) in Pakistan 373636000000 489681000000
Interest payments on external debt; long-term (INT; US
973873000 1011854000
dollar) in Pakistan
Interest payments on external debt (% of exports of goods;
4 3
services and income) in Pakistan
Interest payments on external debt (% of GNI) in Pakistan 1 1
Interest payments on external debt; private nonguaranteed
131635000 207571000
(PNG) (INT; US dollar) in Pakistan
Interest payments on external debt; public and publicly
842238000 804283000
guaranteed (PPG) (INT; US dollar) in Pakistan
Interest payments on external debt; short-term (INT; US
111400000 44000000
dollar) in Pakistan
Interest payments on external debt; total (INT; US
1094737000 1062981000
dollar) in Pakistan
P A G E | 23
24. AHSAN ALI SP09-MBA-014
Interest payments (% of expense) in Pakistan 26 26
Interest payments (% of revenue) in Pakistan 29 35
Interest rate spread (lending rate minus deposit rate;
6 6
%) in Pakistan
Interest rescheduled (capitalized) (US dollar) in Pakistan 0 0
Interest rescheduled; official (US dollar) in Pakistan 0 0
Interest rescheduled; private (US dollar) in Pakistan 0 0
Internally displaced persons (number) in Pakistan 155809
International Internet bandwidth (bits per person) in Pakistan 43
International Internet bandwidth (Mbps) in Pakistan 7070
International migrant stock (% of population) in Pakistan
International migrant stock; total in Pakistan
International tourism; expenditures for passenger transport
490000000 525000000
items (US dollar) in Pakistan
International tourism; expenditures for travel items (US
1593000000 1510000000
dollar) in Pakistan
International tourism; expenditures (% of total
6 4
imports) in Pakistan
International tourism; expenditures (US dollar) in Pakistan 2083000000 2035000000
International tourism; number of arrivals in Pakistan 840000 823000
International tourism; receipts for passenger transport items
636000000 671000000
(US dollar) in Pakistan
International tourism; receipts for travel items (US
276000000 244000000
dollar) in Pakistan
International tourism; receipts (% of total exports) in Pakistan 4 4
International tourism; receipts (US dollar) in Pakistan 912000000 915000000
International voice traffic (minutes per person) in Pakistan
International voice traffic (out and in; minutes) in Pakistan
Internet users (per 100 people) in Pakistan 11 11
Internet users in Pakistan 17500000 18500000
Investment in energy with private participation (US
1196700000 1084400000
dollar) in Pakistan
Investment in telecoms with private participation (US
2740500000 2655000000
dollar) in Pakistan
Investment in transport with private participation (US
580700000 303000000
dollar) in Pakistan
ISO certification ownership (% of firms) in Pakistan 10
Labor force; female (% of total labor force) in Pakistan 19 19
Labor force; total in Pakistan 54421952 55836769
Labor force with primary education; female (% of female
9
labor force) in Pakistan
P A G E | 24
25. AHSAN ALI SP09-MBA-014
Labor force with primary education; male (% of male labor
18
force) in Pakistan
Labor force with primary education (% of total) in Pakistan 16
Labor force with secondary education; female (% of female
3
labor force) in Pakistan
Labor force with secondary education; male (% of male labor
13
force) in Pakistan
Labor force with secondary education (% of total) in Pakistan 11
Labor force with tertiary education; female (% of female labor
12
force) in Pakistan
Labor force with tertiary education; male (% of male labor
26
force) in Pakistan
Labor force with tertiary education (% of total) in Pakistan 23
Labor participation rate; female (% of female population ages
21 21
15+) in Pakistan
Labor participation rate; male (% of male population ages
85 85
15+) in Pakistan
Labor participation rate; total (% of total population ages
54 54
15+) in Pakistan
Land area (sq. km) in Pakistan 770880 770880
Land under cereal production (hectares) in Pakistan 13051000 13453700
Lead time to export (days) in Pakistan 22 22
Lead time to export; median case (days) in Pakistan
Lead time to import (days) in Pakistan 19 18
Lead time to import; median case (days) in Pakistan
Lending interest rate (%) in Pakistan 12 13
Life expectancy at birth; female (years) in Pakistan 67 67
Life expectancy at birth; male (years) in Pakistan 66 66
Life expectancy at birth; total (years) in Pakistan 66 67
Lifetime risk of maternal death (1 in: rate varies by
country) in Pakistan
Liner shipping connectivity index (maximum value in 2004 =
25 25
100) in Pakistan
Liquid liabilities (M3) as % of GDP in Pakistan 51
Listed domestic companies; total in Pakistan 654 653
Literacy rate; adult female (% of females ages 15 and
40
above) in Pakistan
Literacy rate; adult male (% of males ages 15 and
67
above) in Pakistan
Literacy rate; adult total (% of people ages 15 and
54
above) in Pakistan
Literacy rate; youth female (% of females ages 15- 59
P A G E | 25
26. AHSAN ALI SP09-MBA-014
24) in Pakistan
Literacy rate; youth male (% of males ages 15-24) in Pakistan 79
Literacy rate; youth total (% of people ages 15-24) in Pakistan 69
Livestock production index (1999-2001 = 100) in Pakistan 126
Logistics performance index: Ability to track and trace
consignments (1=low to 5=high) in Pakistan
Logistics performance index: Competence and quality of
logistics services (1=low to 5=high) in Pakistan
Logistics performance index: Ease of arranging competitively
priced shipments (1=low to 5=high) in Pakistan
Logistics performance index: Efficiency of customs clearance
process (1=low to 5=high) in Pakistan
Logistics performance index: Frequency with which
shipments reach consignee within scheduled or expected time
(1=low to 5=high) in Pakistan
Logistics performance index: Overall (1=low to
5=high) in Pakistan
Logistics performance index: Quality of trade and transport-
related infrastructure (1=low to 5=high) in Pakistan
Losses due to theft; robbery; vandalism; and arson (%
0
sales) in Pakistan
Low-birthweight babies (% of births) in Pakistan 32
Malnutrition prevalence; height for age (% of children under
5) in Pakistan
Malnutrition prevalence; weight for age (% of children under
5) in Pakistan
Mammal species; threatened in Pakistan 23
Management time dealing with officials (% of management
2
time) in Pakistan
Manufactures exports (% of merchandise exports) in Pakistan 80 73
Manufactures imports (% of merchandise imports) in Pakistan 55 47
Manufacturing; value added (annual % growth) in Pakistan 8 5
Manufacturing; value added (constant 2000 US
19102217927 20020236772
dollar) in Pakistan
Manufacturing; value added (constant LCU) in Pakistan 988301000000 1035797000000
Manufacturing; value added (current LCU) in Pakistan 1567313000000 1949904000000
Manufacturing; value added (% of GDP) in Pakistan 19 20
Manufacturing; value added (US dollar) in Pakistan 25878443443 31196397639
Marine protected areas (number) in Pakistan 5
Marine protected areas (% of total surface area) in Pakistan 1
Market capitalization of listed companies (% of
49 14
GDP) in Pakistan
P A G E | 26
27. AHSAN ALI SP09-MBA-014
Market capitalization of listed companies (US
70262230000 23490665415
dollar) in Pakistan
Maternal mortality ratio (modeled estimate; per 100;000 live
births) in Pakistan
Merchandise exports by the reporting economy; residual (% of
1 1
total merchandise exports) in Pakistan
Merchandise exports by the reporting economy (US
19021806000 21623420000
dollar) in Pakistan
Merchandise exports to developing economies in East Asia &
7 6
Pacific (% of total merchandise exports) in Pakistan
Merchandise exports to developing economies in Europe &
4 4
Central Asia (% of total merchandise exports) in Pakistan
Merchandise exports to developing economies in Latin
America & the Caribbean (% of total merchandise 2 2
exports) in Pakistan
Merchandise exports to developing economies in Middle East
2 2
& North Africa (% of total merchandise exports) in Pakistan
Merchandise exports to developing economies in South Asia
12 12
(% of total merchandise exports) in Pakistan
Merchandise exports to developing economies in Sub-Saharan
6 6
Africa (% of total merchandise exports) in Pakistan
Merchandise exports to developing economies outside region
21 21
(% of total merchandise exports) in Pakistan
Merchandise exports to developing economies within region
12 12
(% of total merchandise exports) in Pakistan
Merchandise exports to high-income economies (% of total
66 66
merchandise exports) in Pakistan
Merchandise exports (US dollar) in Pakistan 17837500000 20375000000
Merchandise imports by the reporting economy; residual (%
3 3
of total merchandise imports) in Pakistan
Merchandise imports by the reporting economy (US
40134583000 46143972000
dollar) in Pakistan
Merchandise imports from developing economies in East Asia
24 22
& Pacific (% of total merchandise imports) in Pakistan
Merchandise imports from developing economies in Europe &
2 3
Central Asia (% of total merchandise imports) in Pakistan
Merchandise imports from developing economies in Latin
America & the Caribbean (% of total merchandise 1 1
imports) in Pakistan
Merchandise imports from developing economies in Middle
East & North Africa (% of total merchandise 2 2
imports) in Pakistan
Merchandise imports from developing economies in South 6 4
P A G E | 27
28. AHSAN ALI SP09-MBA-014
Asia (% of total merchandise imports) in Pakistan
Merchandise imports from developing economies in Sub-
2 2
Saharan Africa (% of total merchandise imports) in Pakistan
Merchandise imports from developing economies outside
32 31
region (% of total merchandise imports) in Pakistan
Merchandise imports from developing economies within
6 4
region (% of total merchandise imports) in Pakistan
Merchandise imports from high-income economies (% of total
60 62
merchandise imports) in Pakistan
Merchandise imports (US dollar) in Pakistan 32590000000 42326400000
Merchandise trade (% of GDP) in Pakistan 35 38
Methane emissions (kt of CO2 equivalent) in Pakistan
Military expenditure (current LCU) in Pakistan 309000000000 336000000000
Military expenditure (% of central government
22 18
expenditure) in Pakistan
Military expenditure (% of GDP) in Pakistan 4 3
Mobile and fixed-line telephone subscribers (per 100
42 56
people) in Pakistan
Mobile and fixed-line telephone subscribers per
50
employee in Pakistan
Mobile and fixed-line telephone subscribers in Pakistan 67766960 92436160
Mobile cellular prepaid tariff (US dollar per
2
month) in Pakistan
Mobile cellular subscriptions (per 100 people) in Pakistan 39 53
Mobile cellular subscriptions in Pakistan 62960752 88019744
Money and quasi money growth (annual %) in Pakistan 19
Money and quasi money (M2) as % of GDP in Pakistan 46
Money and quasi money (M2) (current LCU) in Pakistan 4357685000000
Money and quasi money (M2) to total reserves
5
ratio in Pakistan
Money (current LCU) in Pakistan 3229783000000
Mortality rate; adult; female (per 1;000 female
136 133
adults) in Pakistan
Mortality rate; adult; male (per 1;000 male adults) in Pakistan 168 165
Mortality rate; female child (per 1;000 female children age
22
one) in Pakistan
Mortality rate; infant (per 1;000 live births) in Pakistan 73 72
Mortality rate; male child (per 1;000 male children age
14
one) in Pakistan
Mortality rate; under-5 (per 1;000) in Pakistan 91 89
Motor vehicles (per 1;000 people) in Pakistan 11
Multilateral debt (% of total external debt) in Pakistan 49 45
P A G E | 28
29. AHSAN ALI SP09-MBA-014
Multilateral debt service (% of public and publicly guaranteed
54 66
debt service) in Pakistan
Multilateral debt service (TDS; US dollar) in Pakistan 1032765000 1356789000
Net barter terms of trade index (2000 = 100) in Pakistan 66 58
Net bilateral aid flows from DAC donors; Australia (US
9700000 27130000
dollar) in Pakistan
Net bilateral aid flows from DAC donors; Austria (US
2720000 3580000
dollar) in Pakistan
Net bilateral aid flows from DAC donors; Belgium (US
1190000 530000
dollar) in Pakistan
Net bilateral aid flows from DAC donors; Canada (US
44710000 41560000
dollar) in Pakistan
Net bilateral aid flows from DAC donors; Denmark (US
-440000 10000
dollar) in Pakistan
Net bilateral aid flows from DAC donors; European
67860000 62670000
Commission (US dollar) in Pakistan
Net bilateral aid flows from DAC donors; Finland (US
7570000 2360000
dollar) in Pakistan
Net bilateral aid flows from DAC donors; France (US
52440000 9370000
dollar) in Pakistan
Net bilateral aid flows from DAC donors; Germany (US
62430000 89030000
dollar) in Pakistan
Net bilateral aid flows from DAC donors; Greece (US
930000 340000
dollar) in Pakistan
Net bilateral aid flows from DAC donors; Ireland (US
2730000 2700000
dollar) in Pakistan
Net bilateral aid flows from DAC donors; Italy (US
2730000 3870000
dollar) in Pakistan
Net bilateral aid flows from DAC donors; Japan (US
53240000 34240000
dollar) in Pakistan
Net bilateral aid flows from DAC donors; Luxembourg (US
430000 610000
dollar) in Pakistan
Net bilateral aid flows from DAC donors; Netherlands (US
36190000 31140000
dollar) in Pakistan
Net bilateral aid flows from DAC donors; New Zealand (US
590000 210000
dollar) in Pakistan
Net bilateral aid flows from DAC donors; Norway (US
30820000 29840000
dollar) in Pakistan
Net bilateral aid flows from DAC donors; Portugal (US
0 0
dollar) in Pakistan
Net bilateral aid flows from DAC donors; Spain (US
5670000 3280000
dollar) in Pakistan
Net bilateral aid flows from DAC donors; Sweden (US 14180000 8970000
P A G E | 29
30. AHSAN ALI SP09-MBA-014
dollar) in Pakistan
Net bilateral aid flows from DAC donors; Switzerland (US
17160000 17010000
dollar) in Pakistan
Net bilateral aid flows from DAC donors; Total (US
1044260000 979400000
dollar) in Pakistan
Net bilateral aid flows from DAC donors; United Kingdom
197840000 260320000
(US dollar) in Pakistan
Net bilateral aid flows from DAC donors; United States (US
433570000 350630000
dollar) in Pakistan
Net capital account (BoP; US dollar) in Pakistan 173000000 126000000
Net change in interest arrears (US dollar) in Pakistan 0 0
Net current transfers (BoP; US dollar) in Pakistan 11085000000 11024000000
Net current transfers from abroad (constant LCU) in Pakistan 376488563493 355321399309
Net current transfers from abroad (current LCU) in Pakistan 641074419400 717297508614
Net current transfers from abroad (US dollar) in Pakistan 10585000000 11476000000
Net domestic credit (current LCU) in Pakistan 3982308201334
Net errors and omissions; adjusted (BoP; US
-29177392 -401664266
dollar) in Pakistan
Net financial flows; bilateral (NFL; US dollar) in Pakistan -128210000 195520000
Net financial flows; IBRD (NFL; US dollar) in Pakistan -109018000 -243236000
Net financial flows; IDA (NFL; US dollar) in Pakistan 867283000 37863000
Net financial flows; IMF concessional (NFL; US
-122625000 -162707000
dollar) in Pakistan
Net financial flows; IMF nonconcessional (NFL; US
-29455000 3183490000
dollar) in Pakistan
Net financial flows; multilateral (NFL; US dollar) in Pakistan 1466763000 1132572000
Net financial flows; others (NFL; US dollar) in Pakistan 6546000 -163457000
Net financial flows; RDB concessional (NFL; US
279433000 435601000
dollar) in Pakistan
Net financial flows; RDB nonconcessional (NFL; US
422519000 1065801000
dollar) in Pakistan
Net flows on external debt; long-term (NFL; US
1819575000 1980319000
dollar) in Pakistan
Net flows on external debt; private nonguaranteed (PNG)
-271838000 653410000
(NFL; US dollar) in Pakistan
Net flows on external debt; public and publicly guaranteed
2091413000 1326909000
(PPG) (NFL; US dollar) in Pakistan
Net flows on external debt; short-term (NFL; US
906000000 -833000000
dollar) in Pakistan
Net flows on external debt; total (NFL; US dollar) in Pakistan 2573495000 4168102000
Net foreign assets (current LCU) in Pakistan 935261723259
Net income (BoP; US dollar) in Pakistan -3740000000 -4294000000
P A G E | 30
31. AHSAN ALI SP09-MBA-014
Net income from abroad (constant LCU) in Pakistan 82787000000 85949000000
Net income from abroad (current LCU) in Pakistan 157631000000 209801000000
Net income from abroad (US dollar) in Pakistan 2602699600 3356593669
Net intake rate in grade 1; female (% of official school-age
population) in Pakistan
Net intake rate in grade 1; male (% of official school-age
population) in Pakistan
Net intake rate in grade 1 (% of official school-age
population) in Pakistan
Net migration in Pakistan
Net ODA received per capita (US dollar) in Pakistan 14 9
Net ODA received (% of central government
10 6
expense) in Pakistan
Net ODA received (% of GNI) in Pakistan 2 1
Net ODA received (% of gross capital formation) in Pakistan 7 4
Net ODA received (% of imports of goods and
5 3
services) in Pakistan
Net official development assistance and official aid received
2243750000 1493070000
(constant 2007 US dollar) in Pakistan
Net official development assistance and official aid received
2243750000 1539360000
(US dollar) in Pakistan
Net official development assistance received (constant 2007
2243750000 1493070000
US dollar) in Pakistan
Net official development assistance received (US
2243750000 1539360000
dollar) in Pakistan
Net official flows from UN agencies; IFAD (US
8460000 2610000
dollar) in Pakistan
Net official flows from UN agencies; UNAIDS (US
1130000 500000
dollar) in Pakistan
Net official flows from UN agencies; UNDP (US
11090000 9870000
dollar) in Pakistan
Net official flows from UN agencies; UNFPA (US
6980000 6750000
dollar) in Pakistan
Net official flows from UN agencies; UNHCR (US
1100000 1680000
dollar) in Pakistan
Net official flows from UN agencies; UNICEF (US
16970000 20960000
dollar) in Pakistan
Net official flows from UN agencies; UNRWA (US
0 0
dollar) in Pakistan
Net official flows from UN agencies; UNTA (US
5600000 1850000
dollar) in Pakistan
Net official flows from UN agencies; WFP (US 6270000 13020000
P A G E | 31
32. AHSAN ALI SP09-MBA-014
dollar) in Pakistan
Net taxes on products (constant LCU) in Pakistan 286239000000 182917000000
Net taxes on products (current LCU) in Pakistan 437908000000 378281000000
Net taxes on products (US dollar) in Pakistan 7230449445 6052095126
Net trade in goods and services (BoP; US dollar) in Pakistan -15631000000 -22131800000
Net trade in goods (BoP; US dollar) in Pakistan -10587000000 -16769000000
Net transfers on external debt; long-term (NTR; US
845702000 968465000
dollar) in Pakistan
Net transfers on external debt; private nonguaranteed (PNG)
-403473000 445839000
(NTR; US dollar) in Pakistan
Net transfers on external debt; public and publicly guaranteed
1249175000 522626000
(PPG) (NTR; US dollar) in Pakistan
Net transfers on external debt; total (NTR; US
1478758000 3105121000
dollar) in Pakistan
New businesses registered (number) in Pakistan 4840
Nitrous oxide emissions (thousand metric tons of CO2
equivalent) in Pakistan
Nurses and midwives (per 1;000 people) in Pakistan 0
Official exchange rate (LCU per US dollar; period
61 70
average) in Pakistan
Ores and metals exports (% of merchandise
1 1
exports) in Pakistan
Ores and metals imports (% of merchandise
4 3
imports) in Pakistan
Other expense (current LCU) in Pakistan 106334000000 431434000000
Other expense (% of expense) in Pakistan 8 23
Other greenhouse gas emissions; HFC; PFC and SF6
(thousand metric tons of CO2 equivalent) in Pakistan
Other taxes (current LCU) in Pakistan 17830000000 14686000000
Other taxes (% of revenue) in Pakistan 1 1
Out-of-pocket health expenditure (% of private expenditure on
82
health) in Pakistan
Outpatient visits per capita in Pakistan
Passenger cars (per 1;000 people) in Pakistan 9
Patent applications; residents in Pakistan
Permanent cropland (% of land area) in Pakistan 1
Persistence to grade 5; female (% of cohort) in Pakistan
Persistence to grade 5; male (% of cohort) in Pakistan
Persistence to grade 5; total (% of cohort) in Pakistan
Persistence to last grade of primary; female (% of
cohort) in Pakistan
P A G E | 32
33. AHSAN ALI SP09-MBA-014
Persistence to last grade of primary; male (% of
cohort) in Pakistan
Persistence to last grade of primary; total (% of
cohort) in Pakistan
Personal computers (per 100 people) in Pakistan
Personal computers in Pakistan
Physicians (per 1;000 people) in Pakistan 1
Plant species (higher); threatened in Pakistan 2 2
PM10; country level (micrograms per cubic meter) in Pakistan
PNG; bonds (AMT; US dollar) in Pakistan 0 0
PNG; bonds (DIS; US dollar) in Pakistan 0 0
PNG; bonds (DOD; US dollar) in Pakistan 850000000 850000000
PNG; bonds (INT; US dollar) in Pakistan 67046000 60161000
PNG; bonds (NFL; US dollar) in Pakistan 0 0
PNG; bonds (NTR; US dollar) in Pakistan -67046000 -60161000
PNG; bonds (TDS; US dollar) in Pakistan 67046000 60161000
PNG; commercial banks and other creditors (AMT; US
271838000 456400000
dollar) in Pakistan
PNG; commercial banks and other creditors (DIS; US
0 1109810000
dollar) in Pakistan
PNG; commercial banks and other creditors (DOD; US
303271000 3382073000
dollar) in Pakistan
PNG; commercial banks and other creditors (INT; US
64589000 147410000
dollar) in Pakistan
PNG; commercial banks and other creditors (NFL; US
-271838000 653410000
dollar) in Pakistan
PNG; commercial banks and other creditors (NTR; US
-336427000 506000000
dollar) in Pakistan
PNG; commercial banks and other creditors (TDS; US
336427000 603810000
dollar) in Pakistan
Population ages 0-14 (% of total) in Pakistan 38 37
Population ages 15-64 (% of total) in Pakistan 58 59
Population ages 65 and above (% of total) in Pakistan 4 4
Population covered by mobile cellular network
90
(%) in Pakistan
Population density (people per sq. km) in Pakistan 211 215
Population; female (% of total) in Pakistan 48 49
Population growth (annual %) in Pakistan 2 2
Population in largest city in Pakistan 12018411
Population in the largest city (% of urban
21
population) in Pakistan
P A G E | 33