MULTIDISCIPLINRY NATURE OF THE ENVIRONMENTAL STUDIES.pptx
Elasticity of demand and supply
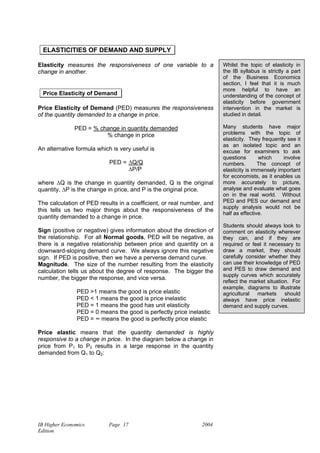
1. ELASTICITIES OF DEMAND AND SUPPLY
Elasticity measures the responsiveness of one variable to a Whilst the topic of elasticity in
change in another. the IB syllabus is strictly a part
of the Business Economics
section, I feel that it is much
more helpful to have an
Price Elasticity of Demand understanding of the concept of
elasticity before government
Price Elasticity of Demand (PED) measures the responsiveness intervention in the market is
of the quantity demanded to a change in price. studied in detail.
PED = % change in quantity demanded Many students have major
% change in price problems with the topic of
elasticity. They frequently see it
as an isolated topic and an
An alternative formula which is very useful is excuse for examiners to ask
questions which involve
PED = ∆Q/Q numbers. The concept of
∆P/P elasticity is immensely important
for economists, as it enables us
where ∆Q is the change in quantity demanded, Q is the original more accurately to picture,
quantity, ∆P is the change in price, and P is the original price. analyse and evaluate what goes
on in the real world. Without
The calculation of PED results in a coefficient, or real number, and PED and PES our demand and
supply analysis would not be
this tells us two major things about the responsiveness of the
half as effective.
quantity demanded to a change in price.
Students should always look to
Sign (positive or negative) gives information about the direction of comment on elasticity wherever
the relationship. For all Normal goods, PED will be negative, as they can, and if they are
there is a negative relationship between price and quantity on a required or feel it necessary to
downward-sloping demand curve. We always ignore this negative draw a market, they should
sign. If PED is positive, then we have a perverse demand curve. carefully consider whether they
Magnitude. The size of the number resulting from the elasticity can use their knowledge of PED
calculation tells us about the degree of response. The bigger the and PES to draw demand and
supply curves which accurately
number, the bigger the response, and vice versa.
reflect the market situation. For
example, diagrams to illustrate
PED >1 means the good is price elastic agricultural markets should
PED < 1 means the good is price inelastic always have price inelastic
PED = 1 means the good has unit elasticity demand and supply curves.
PED = 0 means the good is perfectly price inelastic
PED = ∞ means the good is perfectly price elastic
Price elastic means that the quantity demanded is highly
responsive to a change in price. In the diagram below a change in
price from P1 to P2 results in a large response in the quantity
demanded from Q1 to Q2:
IB Higher Economics Page 17 2004
Edition
2. P
P1
P2 D
0 Q1 Q2 Q
Price inelastic means that the quantity demanded is highly
unresponsive to a change in price. In the diagram below a change
in price from P1 to P2 results in a small response in the quantity
demanded from Q1 to Q2:
P
P1
P2
D
0 Q1 Q2 Q
PED varies at every point along a straight line demand curve.
PED is not the same as the gradient.
At high prices, PED tends towards infinity.
At low prices, PED tends towards zero.
At the mid-point PED = 1:
P
12
10
4
2 D
0 3 4 7 8 Q
As price increases from 10 to 12:
-1/4 = (-) 1.25
+2/10
IB Higher Economics Page 18 2004
Edition
3. As price increases from 2 to 4:
-1/8 = (-) 0.125
+2/2
• Determinants of PED
Closeness of substitutes. PED will be more price elastic if there
are close substitutes available.
Luxury or necessity. Luxury goods tend to be price elastic, and
necessities tend to be price inelastic.
Percentage of income spent on the good. The smaller the
percentage of income spent on a good, the more price inelastic
demand will be.
Time period. In the long run, demand tends to be more price
elastic, as it takes time for consumers to react to price changes.
• PED and Total Revenue (TR) PED will appear again when we
look at price discrimination, and
the effects of a depreciation in
TR = P x Q. the exchange rate on the balance
of payments.
Total revenue is a useful way to check the PED of a demand
curve. If a rise in price causes total revenue to increase, then PED
is inelastic. If an increase in price causes total revenue to
decrease, then the demand curve is price elastic. If an increase in
price causes total revenue to increase then the demand curve is
price inelastic. If a change in price does not change total revenue,
the PED is unitary (= 1).
In the diagrams on the previous page TR at P2 = 0P2 x 0Q2. After
an increase in price, TR at P1 = 0P1 x 0Q1 (shaded area).
Cross Elasticity of Demand
Cross Elasticity of Demand (XED) measures the responsiveness
of the quantity demanded of one good to a change in price of You should see the link between
another. XED and the price of other
goods, which was compliments
and substitutes as determinants
XED = % change in quantity demanded good A
of demand (see p. 8). A fall in
% change in price good B the price of a complement will
cause an increase in demand (a
An alternative formula which is very useful is shift of the demand curve to the
right) for the good that is in joint
XED = ∆QA/QA demand. A fall in the price of a
∆PB/PB substitute will cause a decrease
in demand (a shift of the demand
where ∆QA is the change in quantity demanded of good A, QA is curve to the left) for the good that
the original quantity of good A, ∆PB is the change in price of good is in competitive demand.
B, and PB is the original price of good B.
Sign (positive or negative). Substitutes (goods in
competitive demand) will have a positive XED.
IB Higher Economics Page 19 2004
Edition