SlideShare a Scribd company logo
1 of 8
Download to read offline
investorSCOREcard
Mining                                                                                                                                 Stock Report as of Nov 30, 2010

    Plato Gold Corporation (PGC-V)
   Toronto, ON, Canada (416) 968-0608 www.platogold.com


   Share Price                                                                      $0.05                  Market Cap (Mil)                                                $5.16
   52 Week High                                                                     $0.09                  Cash (Mil)                                                      $0.01
   52 Week Low                                                                      $0.03                  Debt and Preferreds (Mil)                                       $0.00
   Avg Vol Last 3 mos. (000's)                                                    144.57                   Enterprise Value (Mil)                                          $5.15
   Basic Shares Outstanding (Mil)                                                 103.18                   Dividend Yield                                                  0.0%
   Diluted Shares Outstanding (Mil)                                               101.91                   P/E (TTM)                                                           NA


   Stock Price and Volume                                                                                  Business Description                                 Source: Morningstar


                                                                                                           Plato Gold Corp is a Canada-based company engaged in gold
          10,000,000                                                                $0.08                  exploration. It focuses on the properties of gold mining
                                                                                                           districts globally, including Northern Ontario, Northern
           9,000,000
                                                                                    $0.07                  Quebec and Santa Cruz, Argentina. The Company operates
           8,000,000                                                                                       in three regionally-based projects: Timmins Gold Project, Val
                                                                                    $0.06                  d’Or Project and Lolita Project. Timmins Gold Project is
           7,000,000
                                                                                                           located in Northern Ontario including five properties,
                                                                                             Stock Price

                                                                                    $0.05                  Guibord, Harker, Harker-Garrison, Holloway and Marriot. It
           6,000,000
 Volume


                                                                                                           consists of four leases and 117 claims for a total of 2,416
           5,000,000                                                                $0.04
                                                                                                           hectares in the region. Val d’Or Project is located in Northern
           4,000,000                                                                                       Quebec, holding seven properties in the region with 4,390
                                                                                    $0.03
                                                                                                           hectares comprised of 253 claims. The properties include
           3,000,000                                                                                       Nordeau Bateman, Vauquelin, Pershing Denain and others in
                                                                                    $0.02
           2,000,000
                                                                                                           townships of the project. Lolita Project is located in Santa
                                                                                                           Cruz, Argentina, including three adjoining concessions in
                                                                                    $0.01
           1,000,000                                                                                       Southern Argentina where active exploration activities are
                                                                                                           underway by other international exploration companies.
                 -                                                                  $-
                       N D J F M A M J J A S O N D J F M A M J J A S O N

                        2008                  2009                   2010

                                                                                                                                                       Comparables
   Scorecard Highlights                                                                                                                                        CO-V
   Ratings Out of Possible 5 Stars                                                                                                                             ATV-V
                                                                                                                                                               UBR-V
                                                                        Quarter Ending Sep 10                  Quarter Ending Jun 10


   Stock Market Performance
                                                                                   1.3                                    1.4                                   2.1


   Insider Ownership
                                                                                   4.3                             Not Provided                          Not Provided


   Resource Assessment
                                                                                   3.4                             Not Provided                          Not Provided


   Balance Sheet Analysis
                                                                                   1.0                                    1.0                                   3.6


   Valuation
                                                                                   4.5                                    4.7                                   4.3
© 2010 The Equicom Group Inc.  All rights reserved. The Investor Scorecard is exclusively distributed by TMX Equicom. To learn more visit www.tmxmoney.com/scorecard
For a full description of the methodology used, refer to www.fsavaluation.com/scorecardinformation.aspx
Please see the final page(s) of this Investor Scorecard for important disclosure and disclaimer information.
investorSCOREcard
Plato Gold Corp. (PGC-V)

Business of the Company
Plato Gold Corp. is a junior Canadian gold exploration company that is focused on prospective properties in
recognized gold mining districts around the world. Plato was incorporated in 1996 and was listed on the TSX Venture
Exchange in 2005.


Overview of Projects
The Company currently holds a portfolio of properties in significant gold mining areas in Northern Ontario, Northern
Quebec, and Santa Cruz, Argentina.

Val d’Or Project
The Val d’Or Project in Northern Quebec is the Company’s most advanced exploration project and has a reported NI
43-101 compliant gold resource. The project includes six properties (Nordeau Bateman, Vauquelin, Pershing Denain,
Vauquelin Pershing, Vauquelin Horseshoe and Hop O’My Thumb) in townships near Val d’Or, Quebec that total 3,796
hectares comprised of 235 claims. The Nordeau West mineral resource includes indicated resources of 30,212 oz Au
on average grade of 4.17 g/t and 225,342 tonnes; and inferred resources of 146,315 oz Au on average grade of 4.09
g/t and 1,112,321 tonnes. The Nordeau West property has a market implied In Situ valuation per resource unit of
$0.20 per share.

Timmins Gold Project
The Timmins Gold Project in Northern Ontario is an early-stage project that includes five properties (Guibord,
Harker, Harker-Garrison, Holloway and Marriott) in what is sometimes referred to as the Harker/Holloway gold camp
located east of Timmins. The project consists of four leases and 117 claims for a total of 2,416 hectares in the
region.

Lolita Project
The Lolita Project in Santa Cruz, Argentina, is an early-stage project that includes three adjoining concessions in
Southern Argentina where active exploration activities are underway by other international exploration companies.
The Lolita Project is currently in its third phase of prospecting. The Company is considering geophysical exploration
to define specific targets within the corridors of hydrothermal structures for eventual drilling.

A total of 9 drill programs are scheduled over the next few years between the St. Andrew option (4), Threegold
option (2), Nordeau East and West (2) and Lolita (1).


Progress and Milestones

    •   Announced a proposed non-brokered private placement whereby the Company will offer flow-through units
        for a total offering of up to $945,000. The proceeds from the sale of the Flow-Through Units will be used by
        the Company for exploration work on its properties in the Val d’Or region in Québec.
    •   Reached an agreement granting Threegold Resources the option to earn 75% interest in two of Plato’s
        properties in the Val D’Or Project. Plato received an initial payment of $50,000 with payments of cash or
        shares of up $200,000 expected before the fourth anniversary date.
    •   Reached an agreement granting St Andrew Goldfields the option to earn 75% interest in Plato’s Timmins
        Gold Project consisting of four properties. Plato received an initial payment of $100,000 with payments of up
        to $340,000 expected before the third anniversary date. Additional financial obligations of up to $6.25 million
        are possible as part of milestone payments.
investorSCOREcard
Plato Gold Corp. (PGC-V)


Investment Highlights
    •   Diverse property portfolio with both early-stage and advanced exploration projects
    •   A reported NI 43-101 compliant gold resource associated with Val d’Or, the Company’s most advanced
        exploration Project
    •   Option holders Threegold Resources and St. Andrew Goldfields have agreed to fund significant exploration
        activities in order to reach a NI 43-101 compliant resource on each of their respective options
    •   High insider ownership conducive to generating long-term shareholder value


Management

Anthony Cohen
President and Chief Executive Officer
Greg Wong
Chief Financial Officer
Paul Andersen
Treasurer
R.E. Van Tassell
Secretary


Comparables
Canadian Orebodies (CO-V)

Alto Ventures (ATV-V)

Uragold Bay Ventures (UBR-V)
investorSCOREcard
Plato Gold Corporation (PGC-V)

Stock Market Performance Rating                                                                                                                                                                                                                                                     1.3


Stock Market Returns
                                                                                                                            2,000,000                                                                                                                        $0.20
                                  Return                 Percentile         Rating                                          1,800,000                                                                                                                        $0.18
                  Three Months  11%                       54%               2.7
                                                                                                                            1,600,000                                                                                                                        $0.16
                    Six Months  11%                       51%               2.5
                         1 Year  (9.1%)                   13%               0.7                                            1,400,000                                                                                                                        $0.14


                                                                                                                                                                                                                                                                      Stock Price
                3 Years (CAGR)  (23.1%)                    7%               0.3                                            1,200,000                                                                                                                        $0.12


                                                                                                                   Volume
                5 Years (CAGR)  (14.6%)                    9%               0.5
                                                                                                                            1,000,000                                                                                                                        $0.10


Market Data
                                                                                                                                 800,000                                                                                                                     $0.08

                                                                                                                                 600,000                                                                                                                     $0.06
                                       Price             $0.05
                               Mkt Cap (Mil)             $5.16                                                                   400,000                                                                                                                     $0.04
                      Shs Outstanding (Mil)              103.18                                                                  200,000                                                                                                                     $0.02
                           Dividend Yield %              0.0%
                                                                                                                                     -                                                                                                                       $-
                 Avg Vol Last 3mos. (000's)              144.57
                                                                                                                                           2006                       2007                       2008                2009              2010
                                  P/E (TTM)               NA


Insider Ownership Rating                                                                                                                                                                                                                                                            4.3

Value of Shares and Options                                                                                                                                                                                                  Percent of Ownership

                                                 Shares                                      Options                             Total Value Rating                     Percent Rating                                                             27.8%
                                                                                                                                                                                                                                                            27.8% Insiders
                                                                                                            * Adjusted                                                                                                                                       0.0% > 10% Holders
                                                                             # of            $ Value if                           Adjusted $
                                         # of Shares      $ Value                                           $ Value if                                   Rating         Percent of              Rating                                                      72.2% Other
                                                                            Options          Exercised                              Value
                                                                                                            Exercised                                   (Add all)       Mkt. Value             (Add all)
              Anthony J. Cohen                                                                                                                                                                                                                           0.0%
                                           15,035,392        $751,770         8,157,123          $407,856        $203,928                  $955,698        0.4                18.8%               3.8          72.2%
                   President and CEO
              Greg K. W. Wong                                                                                                                                                                               Dec-10
                                            1,716,667         $85,833         2,110,000          $105,500         $52,750                  $138,583        0.1                  2.7%              0.5
                                 CFO
                                                                                                                                                                                                            Oct-10
                  Other Officers
                                              22,000              $1,100       875,000            $43,750         $21,875                   $22,975        0.0                  0.5%              0.1       Aug-10

  Board of Directors & Other                                                                                                                                                                                Jun-10
     Executives (excl. CEO)
                                            4,126,845        $206,342         3,735,000          $186,750         $93,375                  $299,717        0.1                  5.9%              1.2
                                                                                                                                                                                                            Apr-10
              > 10% Holders                                                                                                                                                                                 Feb-10
                                                  -                  $0             -                  $0                   $0                    $0                            0.0%              0.0
                (For info only)
                                                                                                                                                                                                            Dec-09
 Total (excl. >10% Holders)                                 $1,045,045                           $743,856        $371,928                $1,416,973        0.6                27.8%               4.0
                                                                                                                                                                                                                 0%          20%        40%        60%          80%                 100%
                                                                                                                                                       (Max of 4)                             (Max of 4)
                                                                                                                                                                                                                                  CEO                      CFO
                                                                                                                                                                                                                                  Other Officers           Directors
                                                                                                                                                                                                                                  > 10% Holders            Public Float
* Adjusted $ Value of Options is 50% of their full value if exercised to account for volatility. Furthermore, our view is that shareholders would rather management owned shares vs. options


Add: Compensation Type
                                                                           Category                                                                            Rating Addition                                              Percent of Compensation
                                                                                                                                      Total             Perform- Share and
                                           Salary         Perform-   Share and                Option        All Other                Comp.                ance      Unit       Option
                                                         ance Bonus Unit Awards               Awards         Comp.                                       Bonus     Awards     Awards
              Anthony J. Cohen                                                                                                                                                                                                                                        Salary
                                             $141,750                                             $13,520           $5,400                 $160,670                                              0.25         34.0%
                   President and CEO                                                                                                                                                                                                                                  Bonus
              Greg K. W. Wong                                                                                                                                                                                                                                         Shares & Units
                                                                                                  $13,520         $81,648                   $95,168                                              0.25
                                 CFO                                                                                                                                                                                                                                  Options
                                                                                                                                                                                                                                                         55.4%
                                                                                                                                                                                                                                                                      All Other

                                                                                                                                                                                                                     10.6% 0.0%


                              Total          $141,750                $0                 $0        $27,040         $87,048                  $255,838       0.00                   0.00            0.25
                                                                                                                                                        (Max Score)
Bonus: Net Buying/Selling Last Six Months
                                                                                                                                                                                               Insider Holdings Beginning and Ending Value
                                                         Transactions
                                                                                                                                                                         Adjusted Share and


                                                                                                                                                                                               $1,600,000
                                                                                              Rating                                                                                           $1,400,000
                                                                                                                                                                            Option Value


                                           Buying          Selling            Net             Bonus                                                                                            $1,200,000
                                                                                                                                                                                               $1,000,000
                                                                                                                                                                                                 $800,000
  Anthony J. Cohen, President and CEO               $0               $0             $0         0.00
                                                                                                                                                                                                 $600,000
               Greg K. W. Wong, CFO                 $0               $0             $0         0.00
                                                                                                                                                                                                 $400,000
                        Other Officers              $0               $0             $0         0.00
                                                                                                                                                                                                 $200,000
        Board of Directors (excl. CEO)              $0               $0             $0         0.00
                                                                                                                                                                                                     $-
            > 10% Holders (info only)               $0               $0             $0
 Total (excl. >10% Holders)                         $0               $0             $0         0.00          (Total Score)                                                                                                  Beg       Trans-    Ending
                                                                                                                                                                                                                            Value     actions    Value
investorSCOREcard
Plato Gold Corporation (PGC-V)

Resource Assessment Rating                                                                                                                                                                                                             3.4

Assessment Phase
                    Nordeau West Main                           Nordeau West B
               200                                      200


               180                                      180


               160                                      160


               140                                      140


               120                                      120
                                                                    -

               100                                      100


                80                                       80
                                          145

                60                                       60


                40                                       40
                              -
                              -
                20                                       20
 Legend                       30
                                                                    108                2
 Proven         -                                       -
 Probable                 Other        Inferred                    Other            Inferred
 Measured
 Indicated                '000 Ounces of Gold                           '000 Ounces of Gold
 Inferred

Assessment Phase Rating                                                                                                        1.2

Size Assessment                                                                                                                                              Resource Classification of Primary Project:
                                                                                                                                                                        Nordeau West Main

                                                                                                          Primary Mineral
                                                              Resource       Primary        Mine
 Mine Name                                                                                            Equivalent Resource Size                                                            Proven 
                                                              Location       Mineral        Type                                                                        Probable            0%
                                                                                                       Including Byproducts                                                0%                        Indicated 
                                                                                                                                                                                                        17%                Proven
 Nordeau West Main                                     Quebec                Gold          Open Pit       175    '000 Ounces                                 Measured                                                      Probable
 Nordeau West B                                        Quebec                Gold          Open Pit       110    '000 Ounces                                   0%
                                                                                                                                                                                                                           Measured
                                                                                                                                                                                                                           Indicated
                                                                                                                                                                                                                           Inferred

 Total Gold equivalent size                                                                               285    '000 Ounces                                                Inferred
                                                                                                                                                                              83%

 Note: Resource size is inclusive of inferred resources. Please see Assessment Phase above for categorical breakdown by project.

Size Assessment Rating                                                                                                         2.7

Ore Grade Assessment
                                                              Resource       Primary        Mine                  Primary Mineral Grade                          Primary Mineral Grade Equiv. incl. Byproducts             Average
 Mine Name                                                                                                                                                                                                                  Equiv.     Rating
                                                              Location       Mineral        Type
                                                                                                      Inferred   Indicated   Measured    Probable   Proven      Inferred   Indicated      Measured   Probable     Proven    Grade
 Nordeau West Main                                     Quebec                   Gold       Open Pit     4.10       4.18                                           4.10       4.18                                            4.11       5.0
 Nordeau West B                                        Quebec                   Gold       Open Pit     3.59       3.07                                           3.59       3.07                                            3.08       5.0


 Note: Grades for primary and byproduct minerals are scored pro forma as described in the NI 43-101 technical report without accounting for recovery rates which in some cases could be significantly below 100%.

Ore Grade Assessment Rating                                                                                                    5.0


Regional Policy and Mineral Potential

                                                      Fraser Institute Survey Scores Out of 100
                                                                                                      Policy Potential
 Mine Name                                            Resource Location                               Survey
                                                                                                      Results    Rating
 Nordeau West Main                                     Quebec                                           92.0        4.6
 Nordeau West B                                        Quebec                                           92.0        4.6
                                                                                                                                                                           Add map here


 Weighted Average                                                                                       92.0        4.6


 Source: Fraser Institute; www.fraserinstitute.org
 Since 1997, The Fraser Institute has conducted an annual survey of metal mining and exploration companies to
 assess how mineral endowments and public policy factors such as taxation and regulation affect exploration
 investment. Survey results represent the opinions of executives and exploration managers in mining and mining
 consulting companies operating around the world. The survey now includes data on 51 jurisdictions around the
 world, on every continent except Antarctica, including sub-national jurisdictions in Canada, Australia, and the
 United States.


                                                                                                                                        Source: Company Documents


Regional Policy and Mineral Potential Rating                                                                                   4.6
investorSCOREcard

Plato Gold Corporation (PGC-V)

Balance Sheet Analysis Rating                                                                                                                                                                                                                                  1.0

Short-Term Liquidity                                                                                                                                                      Quadrant 3:                                                                 Quadrant 1:
                                                                                                                                                                          "RECOVERING"                                                                "OPTIMAL"
This Company's cash flow is considered NOT SEASONAL, therefore this report uses the last


                                                                                                                      + VE
quarter's cash flow multiplied by 4 as a proxy for annual cash flow.                                                                                   $ 0.3


                                                                                                                                                       $ 0.1
Quadrant Rating                              Sep-09         Dec-09         Mar-10         Jun-10          Sep-10


                                                                                                                     Cash Flow (mil)
Working Capital                               $ 0.0          ($0.4)         ($0.4)         ($0.3)          ($0.4)                                     ($0.1)
Cash Flow Ops (Q in mil)                      ($0.1)         ($0.2)         ($0.1)         ($0.1)          ($0.1)
Cash Flow Ops (Ann Q's in mil)                ($0.4)         ($0.7)         ($0.4)         ($0.6)          ($0.3)                                     ($0.3)                               10-Sep
                                                                                                                                                                                           10-Mar                                             9-Sep
Quadrant Rating                               3.0            1.0            1.0            1.0             1.0
                                                                                                                                                      ($0.5)
                                                                                                                                                                                                        10-Jun
Addition to Quadrant Rating
                                                                                                                                                      ($0.7)                                 9-Dec
Our methodology accounts for the 'nearness' to improving or worsening a Company's quadrant
ranking based on current cash generation/burn rate and working capital position. The
                                                                                                                                                      ($0.9)


                                                                                                                      - VE
Company's working capital situtation is URGENT, and they are generating negative cash flow. At
                                                                                                                                                                          ($1)      ($1)        ($0)      ($0)         ($0)    ($0)      $-             $0        $0
the current cash burn rate the Company will double their working capital deficit in 19 month(s).                                                                                                                                             Quadrant 2:
                                                                                                                                                                            Quadrant 4:
                                                                                                                                                                            "URGENT"                                                    "DRAWING DOWN"
                                                                                               Add:        0.0                                                           - VE                          Working Capital (mil)                          + VE


Short-Term Liquidity Rating                                                                               1.0

Debt to Equity
                                             Sep-09         Dec-09         Mar-10         Jun-10          Sep-10
Equity                                                                                                                                                                                                                                    Utilities
                                                                                                                                                                                                                                          Telecom
Common Stock Equity
                                                                                                                                                   Number of Companies


                                              $ 3.8          $ 4.1          $ 4.2          $ 4.3           $ 4.2
                                                                                                                                                                                                                                          Materials
Total Equity                                  $ 3.8          $ 4.1          $ 4.2          $ 4.3           $ 4.2
                                                                                                                                                                                                                                          Info Tech
                                                                                                                                                                                                                                          Industrials
Debt and Equivalents                                                                                                                                                                                                                      Health Care
Pref. Securities of Sub Trust                 -              -              -              -               -                                                                                                                              Energy
                                                                                                                                                                                                                                          Cons Staples
Pref. Equity Outside Stock Equity             -              -              -              -               -
                                                                                                                                                                                                                                          Cons Disc
Preferred Stock Equity                        -              -              -              -               -
                                                                                                                                                                                                                                          PGC-V
Minority Interest (Bal. Sheet)                -              -              -              -               -
Short-Term Debt                               -              -              -              -               -
Long-Term Debt                                -              -              -              -               -
Capital Lease Obligations                     -              -              -              -               -
Total Debt and Equivalents               $          -   $          -   $          -   $          -    $          -
                                                                                                                                                                          0.00   0.50           1.00     1.50       2.00      2.50      3.00          3.50      4.00
Debt to Equity                                0.00           0.00           0.00           0.00            0.00
Debt to Equity Rating                                                                                      NA                                                            Low Risk                                Debt to Equity                              High Risk


Debt to Equity Rating                                                                                      NA


Interest Coverage
                                             Sep-09         Dec-09         Mar-10         Jun-10          Sep-10                                                 1.0 x

EBIT                                                                                                                                                             0.9 x

Quarterly                                     ($0.1)         ($0.3)         ($0.1)         ($0.2)          ($0.1)                                                0.8 x
TTM
                                                                                                                                       Interest Coverage


                                              ($0.6)         ($0.7)         ($0.7)         ($0.8)          ($0.8)                                                0.7 x

                                                                                                                                                                 0.6 x


                                                                                                                                                                                                                 N/A
Interest Expense
                                                                                                                                                                 0.5 x
Quarterly                                     $ 0.0          $ 0.0          $ 0.0          $ 0.0           $ 0.0
TTM                                           $ 0.0          $ 0.0          $ 0.0          $ 0.0           $ 0.0                                                 0.4 x

                                                                                                                                                                 0.3 x
Interest Coverage                                                                                                                                                0.2 x
Quarterly                                     #N/A           #N/A           #N/A           #N/A            #N/A
                                                                                                                                                                 0.1 x
TTM                                           #N/A           #N/A           #N/A           #N/A            #N/A
                                                                                                                                                                 0.0 x
                                                                                                                                                                                             Sep 09     Dec 09      Mar 10     Jun 10     Sep 10
Interest Coverage Rating
Qtrly Interest Coverage Rating                                                                                                                                                                                   Quarterly
TTM Interest Coverage Rating                                                                                                                                                                                     TTM


Interest Coverage Rating                                                                                  N/A
investorSCOREcard

Plato Gold Corporation (PGC-V)

Valuation Rating                                                                                                                                                                                                                                                4.5

Premium to Invested Capital
(Lower numbers receive higher rankings)


                                                                                                                                               Premium to Invested Capital on Rolling
                                                                                                                                                                                         350%
Quarterly (TTM)                                       Sep-09           Dec-09           Mar-10            Jun-10              Sep-10
Working Capital (Excl S.T. Debt)                       $ 0.0            ($0.4)           ($0.4)            ($0.3)              ($0.4)
                                                                                                                                                                                         300%
Long-Term Net Fixed Capital                            $ 3.7            $ 4.7            $ 4.8             $ 4.6               $ 4.6
                                                                                                                                                                                         250%
Net Invested Capital                                   $ 3.8            $ 4.3            $ 4.3             $ 4.3               $ 4.2
                                                                                                                                                                                         200%
Market Value of Equity                                 $ 5.6            $ 4.8             $ 4.0            $ 3.6                $ 5.2
                                                                                                                                                                                         150%
Debt and Equivalents


                                                                                                                                                              Basis
                                                  $            -   $            -   $             -   $            -      $             -


                                                                                                                                                               TTM
Enterprise Value                                       $ 5.6            $ 4.8            $ 4.0             $ 3.6               $ 5.2                                                     100%

                                                                                                                                                                                          50%
Premium to Invested Capital                           38.2%             9.2%             -8.3%            -17.7%               23.0%
Premium to Invested Capital Rating                     4.3              4.9              5.0               5.0                 4.6                                                         0%

                                                                                                                                                                                        (50%)

                                                                                                                                                                                        (100%)
                                                                                                                                                                                                 Mar Mar Mar Mar Mar Mar Mar Mar Mar Mar Mar
                                                                                                                                                                                                  00  01  02  03  04  05  06  07  08  09  10


Premium to Invested Capital Rating                                                                                             4.6


Price to Book (P/Book)
(Lower numbers receive higher rankings)                                                                                                                                                  6.0 x
Annual (Fiscal Year)                                    Dec-05           Dec-06           Dec-07            Dec-08              Dec-09
* Price                                                 $ 0.07           $ 0.05            $ 0.04           $ 0.04               $ 0.05
                                                                                                                                                                                         5.0 x
Book Equity Per Share                                   $ 0.05           $ 0.08            $ 0.08           $ 0.06               $ 0.04
                                                                                                                                               P/Book on Quarterly


Annual P/Book                                                                                                                                                                            4.0 x
Annual P/Book Rating                                   4.8              4.8              4.8               4.8                 4.8
                                                                                                                                                      Basis


                                                                                                                                                                                         3.0 x
Quarterly                                             Sep-09           Dec-09           Mar-10            Jun-10              Sep-10
* Price                                               $ 0.07           $ 0.05            $ 0.04           $ 0.04               $ 0.05
                                                                                                                                                                                         2.0 x
Book Equity Per Share                                 $ 0.05           $ 0.04           $ 0.04            $ 0.04              $ 0.04


Quarterly P/Book                                      1.5 x            1.2 x             0.9 x            0.8 x                1.2 x                                                     1.0 x
Quarterly P/Book Rating                                3.9              4.2              4.3               4.4                 4.1
                                                                                                                                                                                         0.0 x
                                                                                                                                                                                                 Mar    Mar   Mar   Mar    Mar   Mar   Mar   Mar   Mar   Mar    Mar
                                                                                                                                                                                                  00     01    02    03     04    05    06    07    08    09     10


Price to Book (P/Book) Rating                                                                                                  4.4

Market Implied In Situ Valuation
                                                                                                                                            Market Implied In Situ Valuation


                                                                                                                                                                                         $0.20
                                                                                                          Market Implied In                                                              $0.18
                                         Resource Size at Certainty Levels of                             Situ Valuation per
                                                                                                                                                                                         $0.16
Property (Primary Mineral)                    Equivalent '000 Ounces                                      resource unit (C$)
                                                                                                                                                                                         $0.14
                                                                                                                                                                                         $0.12
 Nordeau West Main (Gold)           Proven + Probable                                                                   NA
                                                                                                                                                       per Unit


                                                                                                                                                                                         $0.10
                                    Including Measured & Indicated                      30,024                         $0.17
                                                                                                                                                                                         $0.08
                                    Including Inferred                                  174,743                        $0.03
                                                                                                                                                                                         $0.06
                                                                                                                                                                                         $0.04
                                                                                                                                                                                         $0.02
                                                                                                                                                                                         $0.00
                                                                                                                                                                                                       Proven + Probable   Including Measured      Including Inferred
                                                                                                                                                                                                                                & Indicated


                                                                                                                               NA
* Price - Delayed 60 days to reflect the fact the financial statements are publicly approximately 60 days after the last day of the reporting period. For the last period the most recent price is used.
investorSCOREcard
Disclosure and Disclaimer
The issuer (“Issuer”) covered under this investor scorecard (“Investor Scorecard”) has paid a fee to or has been charged a fee to produce and distribute this
Investor Scorecard. The fee paid or charged for the production and distribution of this Investor Scorecard was not subject to the rankings or information provided
herein, nor was any securities of the Issuer accepted as payment for such fee. FSA Financial Science & Art Ltd. (“FSA”), The Equicom Group Inc. (“Equicom”) and
their respective employees and directors may have had or from time to time acquire, hold or sell an interest in the listed securities of the Issuer.
Unless specified otherwise, all forward looking statements in this Investor Scorecard have been approved by the Issuer, and the Issuer has advised FSA and
Equicom, without independent verification by FSA or Equicom that a reasonable basis exists for such forward looking statements. Other information contained in
this Investor Scorecard has been compiled by FSA or Equicom from sources believed to be reliable, which may include but not limited to, public information,
research reports and discussions with management of the Issuer. Prior to its publication, this Investor Scorecard had been submitted to the management of the
Issuer for review for factual accuracy.
No representation or warranty, express or implied, is made by FSA, Equicom, its affiliates, any other person that provided information or data for this Investor
Scorecard or any person that distributes this Investor Scorecard with respect to the adequacy, accuracy, completeness or timeliness of any information, estimates
or opinions provided in this Investor Scorecard. All estimates, opinions and other information in this Investor Scorecard are provided by FSA, Equicom or another
party as of the date of this Investor Scorecard. Such estimates, opinions and other information are subject to change without notice, and are provided in good
faith but without any legal responsibility. Past performance is no guarantee of future results.
This Investor Scorecard is provided for informational purposes only and does not constitute an offer or solicitation to buy or sell any securities discussed herein in
any jurisdiction. As a result, the securities discussed in this Investor Scorecard may not be eligible for sale in some jurisdictions. This Investor Scorecard is not,
and under no circumstances should be construed as, a solicitation to act as a securities broker, dealer or advisor in any jurisdiction by any person or company
that is not legally permitted to carry on the business of a securities broker, dealer or advisor in that jurisdiction. Neither FSA nor Equicom is a registered
investment dealer, broker or advisor, has investment banking operations or makes markets in any securities.
This Investor Scorecard is prepared for general circulation and to provide an overview of Issuer’s business. This Investor Scorecard does not consider the
investment objectives, financial situation or particular needs of any particular person, and is not tailored to the needs of any person receiving this Investor
Scorecard. Readers of this Investor Scorecard should obtain professional advice based on their own individual circumstances before making an investment
decision. Nothing in this Investor Scorecard constitutes individual investment, legal or tax advice. To the fullest extent permitted by law, FSA, Equicom,
Morningstar Inc., its content providers, any other person that has provided information or data for this Investor Scorecard nor any authorized person that
distributes this Investor Scorecard accepts any liability whatsoever for any direct, indirect, special or consequential loss (whether in contract or tort even if FSA,
Equicom or the other party has been advised of the possibility of such loss) arising from any use of, or reliance on the estimates, opinions or other information
contained in this Investor Scorecard.
Without limiting the generality of the foregoing, you are prohibited from using or disclosing any personal information contained in the Investor Scorecard for
purposes unrelated to the purposes for which the information is made available to you and/or the public under Canadian securities laws, including, without
limitation, for secondary marketing purposes, unless you have obtained any and all consents as required under applicable Canadian privacy laws.
The information contained in this Investor Scorecard is copyrighted, and it may not be sold or licensed for commercial value or altered, in whole or in part,
without prior express written consent of Equicom. Furthermore, Investor Scorecard can only be distributed in its entirety. Information or data herein, including
any trade mark, service mark or logo is the intellectual property of FSA, Equicom, Morningstar Inc. and/or its content providers, Issuer or other persons that have
provided such information or data, including but not limited to the organizations listed below and their respective content providers.


                        This report was produced in part with information from the following organizations:

More Related Content

What's hot

Fortune Minerals July 2012 Corporate Presentation
Fortune Minerals July 2012 Corporate PresentationFortune Minerals July 2012 Corporate Presentation
Fortune Minerals July 2012 Corporate PresentationCompany Spotlight
 
Fortune mineralsfeb13presentation
Fortune mineralsfeb13presentationFortune mineralsfeb13presentation
Fortune mineralsfeb13presentationCompany Spotlight
 
Llc Business Model 2011 Sr20 B Cv1
Llc Business Model   2011 Sr20 B Cv1Llc Business Model   2011 Sr20 B Cv1
Llc Business Model 2011 Sr20 B Cv1Bill Cattley
 
HSBC 2006 Interim Results Presentation to Investors and Analysts
HSBC 	2006 Interim Results Presentation to Investors and AnalystsHSBC 	2006 Interim Results Presentation to Investors and Analysts
HSBC 2006 Interim Results Presentation to Investors and AnalystsQuarterlyEarningsReports2
 
Fortune mineralsjan2013cp
Fortune mineralsjan2013cpFortune mineralsjan2013cp
Fortune mineralsjan2013cpnabarnes
 
June 2011-2-investor-presentation-06222011
June 2011-2-investor-presentation-06222011June 2011-2-investor-presentation-06222011
June 2011-2-investor-presentation-06222011Teranga Gold
 
Church Christian Ministry Financial Management
Church Christian Ministry Financial ManagementChurch Christian Ministry Financial Management
Church Christian Ministry Financial Managementministrycpa
 
Kas Moving From 1 To 5 Drill Rigs At Achmmach
Kas   Moving From 1 To 5 Drill Rigs At AchmmachKas   Moving From 1 To 5 Drill Rigs At Achmmach
Kas Moving From 1 To 5 Drill Rigs At AchmmachKasbah Resources Limited
 
hollycorp.annualreport.2001
hollycorp.annualreport.2001hollycorp.annualreport.2001
hollycorp.annualreport.2001finance49
 
williams 2006 Annual Report
williams 2006 Annual Reportwilliams 2006 Annual Report
williams 2006 Annual Reportfinance21
 
March presentation final v2
March presentation final v2March presentation final v2
March presentation final v2primero_mining
 
06 18-12-agm
06 18-12-agm06 18-12-agm
06 18-12-agmJennieg
 
Chapter 12analisis dec sensibilidad
Chapter 12analisis dec sensibilidadChapter 12analisis dec sensibilidad
Chapter 12analisis dec sensibilidadfedericoblanco
 
newmont mining oct_30_Q32008EarningsReleasePresentationFinal
newmont mining oct_30_Q32008EarningsReleasePresentationFinalnewmont mining oct_30_Q32008EarningsReleasePresentationFinal
newmont mining oct_30_Q32008EarningsReleasePresentationFinalfinance37
 

What's hot (18)

Fortune Minerals July 2012 Corporate Presentation
Fortune Minerals July 2012 Corporate PresentationFortune Minerals July 2012 Corporate Presentation
Fortune Minerals July 2012 Corporate Presentation
 
Fortune mineralsfeb13presentation
Fortune mineralsfeb13presentationFortune mineralsfeb13presentation
Fortune mineralsfeb13presentation
 
Llc Business Model 2011 Sr20 B Cv1
Llc Business Model   2011 Sr20 B Cv1Llc Business Model   2011 Sr20 B Cv1
Llc Business Model 2011 Sr20 B Cv1
 
HSBC 2006 Interim Results Presentation to Investors and Analysts
HSBC 	2006 Interim Results Presentation to Investors and AnalystsHSBC 	2006 Interim Results Presentation to Investors and Analysts
HSBC 2006 Interim Results Presentation to Investors and Analysts
 
Fortune mineralsjan2013cp
Fortune mineralsjan2013cpFortune mineralsjan2013cp
Fortune mineralsjan2013cp
 
Red Crescent Resources Limited
Red Crescent Resources LimitedRed Crescent Resources Limited
Red Crescent Resources Limited
 
June 2011-2-investor-presentation-06222011
June 2011-2-investor-presentation-06222011June 2011-2-investor-presentation-06222011
June 2011-2-investor-presentation-06222011
 
Church Christian Ministry Financial Management
Church Christian Ministry Financial ManagementChurch Christian Ministry Financial Management
Church Christian Ministry Financial Management
 
Kas Moving From 1 To 5 Drill Rigs At Achmmach
Kas   Moving From 1 To 5 Drill Rigs At AchmmachKas   Moving From 1 To 5 Drill Rigs At Achmmach
Kas Moving From 1 To 5 Drill Rigs At Achmmach
 
hollycorp.annualreport.2001
hollycorp.annualreport.2001hollycorp.annualreport.2001
hollycorp.annualreport.2001
 
williams 2006 Annual Report
williams 2006 Annual Reportwilliams 2006 Annual Report
williams 2006 Annual Report
 
March presentation final v2
March presentation final v2March presentation final v2
March presentation final v2
 
06 18-12-agm
06 18-12-agm06 18-12-agm
06 18-12-agm
 
Grow Your Business with Government Contracts: 4 Essential Steps
Grow Your Business with Government Contracts: 4 Essential StepsGrow Your Business with Government Contracts: 4 Essential Steps
Grow Your Business with Government Contracts: 4 Essential Steps
 
Chapter 12analisis dec sensibilidad
Chapter 12analisis dec sensibilidadChapter 12analisis dec sensibilidad
Chapter 12analisis dec sensibilidad
 
TOL_2007_AR
TOL_2007_ARTOL_2007_AR
TOL_2007_AR
 
Financings Mar 20 09
Financings  Mar 20 09Financings  Mar 20 09
Financings Mar 20 09
 
newmont mining oct_30_Q32008EarningsReleasePresentationFinal
newmont mining oct_30_Q32008EarningsReleasePresentationFinalnewmont mining oct_30_Q32008EarningsReleasePresentationFinal
newmont mining oct_30_Q32008EarningsReleasePresentationFinal
 

Viewers also liked (7)

Canlan Ice Sports Corp.
Canlan Ice Sports Corp.Canlan Ice Sports Corp.
Canlan Ice Sports Corp.
 
Grand Power Logistics
Grand Power LogisticsGrand Power Logistics
Grand Power Logistics
 
Trabajo gbi
Trabajo gbiTrabajo gbi
Trabajo gbi
 
Peak Energy Services v1
Peak Energy Services v1Peak Energy Services v1
Peak Energy Services v1
 
Radiant Communications
Radiant CommunicationsRadiant Communications
Radiant Communications
 
Gran Tierra Energy
Gran Tierra EnergyGran Tierra Energy
Gran Tierra Energy
 
Cipher Pharmaceuticals (DND) Presentation 2011
Cipher Pharmaceuticals (DND) Presentation 2011Cipher Pharmaceuticals (DND) Presentation 2011
Cipher Pharmaceuticals (DND) Presentation 2011
 

Recently uploaded

Osisko Gold Royalties Ltd - Corporate Presentation, April 10, 2024
Osisko Gold Royalties Ltd - Corporate Presentation, April 10, 2024Osisko Gold Royalties Ltd - Corporate Presentation, April 10, 2024
Osisko Gold Royalties Ltd - Corporate Presentation, April 10, 2024Osisko Gold Royalties Ltd
 
slideshare_2404_presentation materials_en.pdf
slideshare_2404_presentation materials_en.pdfslideshare_2404_presentation materials_en.pdf
slideshare_2404_presentation materials_en.pdfsansanir
 
Corporate Presentation Probe April 2024.pdf
Corporate Presentation Probe April 2024.pdfCorporate Presentation Probe April 2024.pdf
Corporate Presentation Probe April 2024.pdfProbe Gold
 
Q1 Quarterly Update - April 16, 2024.pdf
Q1 Quarterly Update - April 16, 2024.pdfQ1 Quarterly Update - April 16, 2024.pdf
Q1 Quarterly Update - April 16, 2024.pdfProbe Gold
 
Leveraging USDA Rural Development Grants for Community Growth and Sustainabil...
Leveraging USDA Rural Development Grants for Community Growth and Sustainabil...Leveraging USDA Rural Development Grants for Community Growth and Sustainabil...
Leveraging USDA Rural Development Grants for Community Growth and Sustainabil...USDAReapgrants.com
 
Corporate Presentation Probe April 2024.pdf
Corporate Presentation Probe April 2024.pdfCorporate Presentation Probe April 2024.pdf
Corporate Presentation Probe April 2024.pdfProbe Gold
 
the 25 most beautiful words for a loving and lasting relationship.pdf
the 25 most beautiful words for a loving and lasting relationship.pdfthe 25 most beautiful words for a loving and lasting relationship.pdf
the 25 most beautiful words for a loving and lasting relationship.pdfFrancenel
 
Collective Mining | Corporate Presentation | April 2024
Collective Mining | Corporate Presentation | April 2024Collective Mining | Corporate Presentation | April 2024
Collective Mining | Corporate Presentation | April 2024CollectiveMining1
 
Q1 Probe Gold Quarterly Update- April 2024
Q1 Probe Gold Quarterly Update- April 2024Q1 Probe Gold Quarterly Update- April 2024
Q1 Probe Gold Quarterly Update- April 2024Probe Gold
 
Collective Mining | Corporate Presentation - April 2024
Collective Mining | Corporate Presentation - April 2024Collective Mining | Corporate Presentation - April 2024
Collective Mining | Corporate Presentation - April 2024CollectiveMining1
 
Mandalay Resources 2024 April IR Presentation
Mandalay Resources 2024 April IR PresentationMandalay Resources 2024 April IR Presentation
Mandalay Resources 2024 April IR PresentationMandalayResources
 

Recently uploaded (12)

Osisko Gold Royalties Ltd - Corporate Presentation, April 10, 2024
Osisko Gold Royalties Ltd - Corporate Presentation, April 10, 2024Osisko Gold Royalties Ltd - Corporate Presentation, April 10, 2024
Osisko Gold Royalties Ltd - Corporate Presentation, April 10, 2024
 
slideshare_2404_presentation materials_en.pdf
slideshare_2404_presentation materials_en.pdfslideshare_2404_presentation materials_en.pdf
slideshare_2404_presentation materials_en.pdf
 
Corporate Presentation Probe April 2024.pdf
Corporate Presentation Probe April 2024.pdfCorporate Presentation Probe April 2024.pdf
Corporate Presentation Probe April 2024.pdf
 
Q1 Quarterly Update - April 16, 2024.pdf
Q1 Quarterly Update - April 16, 2024.pdfQ1 Quarterly Update - April 16, 2024.pdf
Q1 Quarterly Update - April 16, 2024.pdf
 
Leveraging USDA Rural Development Grants for Community Growth and Sustainabil...
Leveraging USDA Rural Development Grants for Community Growth and Sustainabil...Leveraging USDA Rural Development Grants for Community Growth and Sustainabil...
Leveraging USDA Rural Development Grants for Community Growth and Sustainabil...
 
Corporate Presentation Probe April 2024.pdf
Corporate Presentation Probe April 2024.pdfCorporate Presentation Probe April 2024.pdf
Corporate Presentation Probe April 2024.pdf
 
Korea District Heating Corporation 071320 Algorithm Investment Report
Korea District Heating Corporation 071320 Algorithm Investment ReportKorea District Heating Corporation 071320 Algorithm Investment Report
Korea District Heating Corporation 071320 Algorithm Investment Report
 
the 25 most beautiful words for a loving and lasting relationship.pdf
the 25 most beautiful words for a loving and lasting relationship.pdfthe 25 most beautiful words for a loving and lasting relationship.pdf
the 25 most beautiful words for a loving and lasting relationship.pdf
 
Collective Mining | Corporate Presentation | April 2024
Collective Mining | Corporate Presentation | April 2024Collective Mining | Corporate Presentation | April 2024
Collective Mining | Corporate Presentation | April 2024
 
Q1 Probe Gold Quarterly Update- April 2024
Q1 Probe Gold Quarterly Update- April 2024Q1 Probe Gold Quarterly Update- April 2024
Q1 Probe Gold Quarterly Update- April 2024
 
Collective Mining | Corporate Presentation - April 2024
Collective Mining | Corporate Presentation - April 2024Collective Mining | Corporate Presentation - April 2024
Collective Mining | Corporate Presentation - April 2024
 
Mandalay Resources 2024 April IR Presentation
Mandalay Resources 2024 April IR PresentationMandalay Resources 2024 April IR Presentation
Mandalay Resources 2024 April IR Presentation
 

Plato Gold Corporation

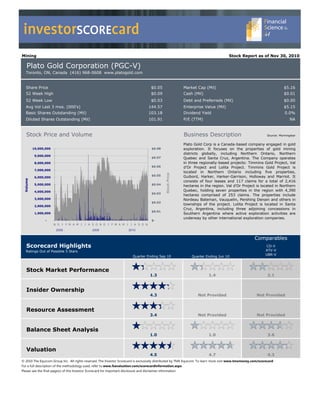
  • 1. investorSCOREcard Mining Stock Report as of Nov 30, 2010 Plato Gold Corporation (PGC-V) Toronto, ON, Canada (416) 968-0608 www.platogold.com Share Price $0.05 Market Cap (Mil) $5.16 52 Week High $0.09 Cash (Mil) $0.01 52 Week Low $0.03 Debt and Preferreds (Mil) $0.00 Avg Vol Last 3 mos. (000's) 144.57 Enterprise Value (Mil) $5.15 Basic Shares Outstanding (Mil) 103.18 Dividend Yield 0.0% Diluted Shares Outstanding (Mil) 101.91 P/E (TTM) NA Stock Price and Volume Business Description Source: Morningstar Plato Gold Corp is a Canada-based company engaged in gold 10,000,000 $0.08 exploration. It focuses on the properties of gold mining districts globally, including Northern Ontario, Northern 9,000,000 $0.07 Quebec and Santa Cruz, Argentina. The Company operates 8,000,000 in three regionally-based projects: Timmins Gold Project, Val $0.06 d’Or Project and Lolita Project. Timmins Gold Project is 7,000,000 located in Northern Ontario including five properties, Stock Price $0.05 Guibord, Harker, Harker-Garrison, Holloway and Marriot. It 6,000,000 Volume consists of four leases and 117 claims for a total of 2,416 5,000,000 $0.04 hectares in the region. Val d’Or Project is located in Northern 4,000,000 Quebec, holding seven properties in the region with 4,390 $0.03 hectares comprised of 253 claims. The properties include 3,000,000 Nordeau Bateman, Vauquelin, Pershing Denain and others in $0.02 2,000,000 townships of the project. Lolita Project is located in Santa Cruz, Argentina, including three adjoining concessions in $0.01 1,000,000 Southern Argentina where active exploration activities are underway by other international exploration companies. - $- N D J F M A M J J A S O N D J F M A M J J A S O N 2008 2009 2010 Comparables Scorecard Highlights CO-V Ratings Out of Possible 5 Stars ATV-V UBR-V Quarter Ending Sep 10 Quarter Ending Jun 10 Stock Market Performance 1.3 1.4 2.1 Insider Ownership 4.3 Not Provided Not Provided Resource Assessment 3.4 Not Provided Not Provided Balance Sheet Analysis 1.0 1.0 3.6 Valuation 4.5 4.7 4.3 © 2010 The Equicom Group Inc.  All rights reserved. The Investor Scorecard is exclusively distributed by TMX Equicom. To learn more visit www.tmxmoney.com/scorecard For a full description of the methodology used, refer to www.fsavaluation.com/scorecardinformation.aspx Please see the final page(s) of this Investor Scorecard for important disclosure and disclaimer information.
  • 2. investorSCOREcard Plato Gold Corp. (PGC-V) Business of the Company Plato Gold Corp. is a junior Canadian gold exploration company that is focused on prospective properties in recognized gold mining districts around the world. Plato was incorporated in 1996 and was listed on the TSX Venture Exchange in 2005. Overview of Projects The Company currently holds a portfolio of properties in significant gold mining areas in Northern Ontario, Northern Quebec, and Santa Cruz, Argentina. Val d’Or Project The Val d’Or Project in Northern Quebec is the Company’s most advanced exploration project and has a reported NI 43-101 compliant gold resource. The project includes six properties (Nordeau Bateman, Vauquelin, Pershing Denain, Vauquelin Pershing, Vauquelin Horseshoe and Hop O’My Thumb) in townships near Val d’Or, Quebec that total 3,796 hectares comprised of 235 claims. The Nordeau West mineral resource includes indicated resources of 30,212 oz Au on average grade of 4.17 g/t and 225,342 tonnes; and inferred resources of 146,315 oz Au on average grade of 4.09 g/t and 1,112,321 tonnes. The Nordeau West property has a market implied In Situ valuation per resource unit of $0.20 per share. Timmins Gold Project The Timmins Gold Project in Northern Ontario is an early-stage project that includes five properties (Guibord, Harker, Harker-Garrison, Holloway and Marriott) in what is sometimes referred to as the Harker/Holloway gold camp located east of Timmins. The project consists of four leases and 117 claims for a total of 2,416 hectares in the region. Lolita Project The Lolita Project in Santa Cruz, Argentina, is an early-stage project that includes three adjoining concessions in Southern Argentina where active exploration activities are underway by other international exploration companies. The Lolita Project is currently in its third phase of prospecting. The Company is considering geophysical exploration to define specific targets within the corridors of hydrothermal structures for eventual drilling. A total of 9 drill programs are scheduled over the next few years between the St. Andrew option (4), Threegold option (2), Nordeau East and West (2) and Lolita (1). Progress and Milestones • Announced a proposed non-brokered private placement whereby the Company will offer flow-through units for a total offering of up to $945,000. The proceeds from the sale of the Flow-Through Units will be used by the Company for exploration work on its properties in the Val d’Or region in Québec. • Reached an agreement granting Threegold Resources the option to earn 75% interest in two of Plato’s properties in the Val D’Or Project. Plato received an initial payment of $50,000 with payments of cash or shares of up $200,000 expected before the fourth anniversary date. • Reached an agreement granting St Andrew Goldfields the option to earn 75% interest in Plato’s Timmins Gold Project consisting of four properties. Plato received an initial payment of $100,000 with payments of up to $340,000 expected before the third anniversary date. Additional financial obligations of up to $6.25 million are possible as part of milestone payments.
  • 3. investorSCOREcard Plato Gold Corp. (PGC-V) Investment Highlights • Diverse property portfolio with both early-stage and advanced exploration projects • A reported NI 43-101 compliant gold resource associated with Val d’Or, the Company’s most advanced exploration Project • Option holders Threegold Resources and St. Andrew Goldfields have agreed to fund significant exploration activities in order to reach a NI 43-101 compliant resource on each of their respective options • High insider ownership conducive to generating long-term shareholder value Management Anthony Cohen President and Chief Executive Officer Greg Wong Chief Financial Officer Paul Andersen Treasurer R.E. Van Tassell Secretary Comparables Canadian Orebodies (CO-V) Alto Ventures (ATV-V) Uragold Bay Ventures (UBR-V)
  • 4. investorSCOREcard Plato Gold Corporation (PGC-V) Stock Market Performance Rating 1.3 Stock Market Returns 2,000,000 $0.20 Return Percentile Rating 1,800,000 $0.18 Three Months  11% 54% 2.7 1,600,000 $0.16 Six Months  11% 51% 2.5 1 Year  (9.1%) 13% 0.7 1,400,000 $0.14 Stock Price 3 Years (CAGR)  (23.1%) 7% 0.3 1,200,000 $0.12 Volume 5 Years (CAGR)  (14.6%) 9% 0.5 1,000,000 $0.10 Market Data 800,000 $0.08 600,000 $0.06 Price $0.05 Mkt Cap (Mil) $5.16 400,000 $0.04 Shs Outstanding (Mil) 103.18 200,000 $0.02 Dividend Yield % 0.0% - $- Avg Vol Last 3mos. (000's) 144.57 2006 2007 2008 2009 2010 P/E (TTM) NA Insider Ownership Rating 4.3 Value of Shares and Options Percent of Ownership Shares Options Total Value Rating Percent Rating 27.8% 27.8% Insiders * Adjusted 0.0% > 10% Holders # of $ Value if Adjusted $ # of Shares $ Value $ Value if Rating Percent of Rating 72.2% Other Options Exercised Value Exercised (Add all) Mkt. Value (Add all) Anthony J. Cohen 0.0% 15,035,392 $751,770 8,157,123 $407,856 $203,928 $955,698 0.4 18.8% 3.8 72.2% President and CEO Greg K. W. Wong Dec-10 1,716,667 $85,833 2,110,000 $105,500 $52,750 $138,583 0.1 2.7% 0.5 CFO Oct-10 Other Officers 22,000 $1,100 875,000 $43,750 $21,875 $22,975 0.0 0.5% 0.1 Aug-10 Board of Directors & Other Jun-10 Executives (excl. CEO) 4,126,845 $206,342 3,735,000 $186,750 $93,375 $299,717 0.1 5.9% 1.2 Apr-10 > 10% Holders Feb-10 - $0 - $0 $0 $0 0.0% 0.0 (For info only) Dec-09 Total (excl. >10% Holders) $1,045,045 $743,856 $371,928 $1,416,973 0.6 27.8% 4.0 0% 20% 40% 60% 80% 100% (Max of 4) (Max of 4) CEO CFO Other Officers Directors > 10% Holders Public Float * Adjusted $ Value of Options is 50% of their full value if exercised to account for volatility. Furthermore, our view is that shareholders would rather management owned shares vs. options Add: Compensation Type Category Rating Addition Percent of Compensation Total Perform- Share and Salary Perform- Share and Option All Other Comp. ance Unit Option ance Bonus Unit Awards Awards Comp. Bonus Awards Awards Anthony J. Cohen Salary $141,750 $13,520 $5,400 $160,670 0.25 34.0% President and CEO Bonus Greg K. W. Wong Shares & Units $13,520 $81,648 $95,168 0.25 CFO Options 55.4% All Other 10.6% 0.0% Total $141,750 $0 $0 $27,040 $87,048 $255,838 0.00 0.00 0.25 (Max Score) Bonus: Net Buying/Selling Last Six Months Insider Holdings Beginning and Ending Value Transactions Adjusted Share and $1,600,000 Rating $1,400,000 Option Value Buying Selling Net Bonus $1,200,000 $1,000,000 $800,000 Anthony J. Cohen, President and CEO $0 $0 $0 0.00 $600,000 Greg K. W. Wong, CFO $0 $0 $0 0.00 $400,000 Other Officers $0 $0 $0 0.00 $200,000 Board of Directors (excl. CEO) $0 $0 $0 0.00 $- > 10% Holders (info only) $0 $0 $0 Total (excl. >10% Holders) $0 $0 $0 0.00 (Total Score) Beg Trans- Ending Value actions Value
  • 5. investorSCOREcard Plato Gold Corporation (PGC-V) Resource Assessment Rating 3.4 Assessment Phase Nordeau West Main Nordeau West B 200 200 180 180 160 160 140 140 120 120 - 100 100 80 80 145 60 60 40 40 - - 20 20 Legend 30 108 2 Proven - - Probable Other Inferred Other Inferred Measured Indicated '000 Ounces of Gold '000 Ounces of Gold Inferred Assessment Phase Rating 1.2 Size Assessment Resource Classification of Primary Project: Nordeau West Main Primary Mineral Resource Primary Mine Mine Name Equivalent Resource Size Proven  Location Mineral Type Probable 0% Including Byproducts 0% Indicated  17% Proven Nordeau West Main Quebec Gold Open Pit 175 '000 Ounces Measured Probable Nordeau West B Quebec Gold Open Pit 110 '000 Ounces 0% Measured Indicated Inferred Total Gold equivalent size 285 '000 Ounces Inferred 83% Note: Resource size is inclusive of inferred resources. Please see Assessment Phase above for categorical breakdown by project. Size Assessment Rating 2.7 Ore Grade Assessment Resource Primary Mine Primary Mineral Grade Primary Mineral Grade Equiv. incl. Byproducts Average Mine Name Equiv. Rating Location Mineral Type Inferred Indicated Measured Probable Proven Inferred Indicated Measured Probable Proven Grade Nordeau West Main Quebec Gold Open Pit 4.10 4.18 4.10 4.18 4.11 5.0 Nordeau West B Quebec Gold Open Pit 3.59 3.07 3.59 3.07 3.08 5.0 Note: Grades for primary and byproduct minerals are scored pro forma as described in the NI 43-101 technical report without accounting for recovery rates which in some cases could be significantly below 100%. Ore Grade Assessment Rating 5.0 Regional Policy and Mineral Potential Fraser Institute Survey Scores Out of 100 Policy Potential Mine Name Resource Location Survey Results Rating Nordeau West Main Quebec 92.0 4.6 Nordeau West B Quebec 92.0 4.6 Add map here Weighted Average 92.0 4.6 Source: Fraser Institute; www.fraserinstitute.org Since 1997, The Fraser Institute has conducted an annual survey of metal mining and exploration companies to assess how mineral endowments and public policy factors such as taxation and regulation affect exploration investment. Survey results represent the opinions of executives and exploration managers in mining and mining consulting companies operating around the world. The survey now includes data on 51 jurisdictions around the world, on every continent except Antarctica, including sub-national jurisdictions in Canada, Australia, and the United States. Source: Company Documents Regional Policy and Mineral Potential Rating 4.6
  • 6. investorSCOREcard Plato Gold Corporation (PGC-V) Balance Sheet Analysis Rating 1.0 Short-Term Liquidity Quadrant 3: Quadrant 1: "RECOVERING" "OPTIMAL" This Company's cash flow is considered NOT SEASONAL, therefore this report uses the last + VE quarter's cash flow multiplied by 4 as a proxy for annual cash flow. $ 0.3 $ 0.1 Quadrant Rating Sep-09 Dec-09 Mar-10 Jun-10 Sep-10 Cash Flow (mil) Working Capital $ 0.0 ($0.4) ($0.4) ($0.3) ($0.4) ($0.1) Cash Flow Ops (Q in mil) ($0.1) ($0.2) ($0.1) ($0.1) ($0.1) Cash Flow Ops (Ann Q's in mil) ($0.4) ($0.7) ($0.4) ($0.6) ($0.3) ($0.3) 10-Sep 10-Mar 9-Sep Quadrant Rating 3.0 1.0 1.0 1.0 1.0 ($0.5) 10-Jun Addition to Quadrant Rating ($0.7) 9-Dec Our methodology accounts for the 'nearness' to improving or worsening a Company's quadrant ranking based on current cash generation/burn rate and working capital position. The ($0.9) - VE Company's working capital situtation is URGENT, and they are generating negative cash flow. At ($1) ($1) ($0) ($0) ($0) ($0) $- $0 $0 the current cash burn rate the Company will double their working capital deficit in 19 month(s). Quadrant 2: Quadrant 4: "URGENT" "DRAWING DOWN" Add: 0.0 - VE Working Capital (mil) + VE Short-Term Liquidity Rating 1.0 Debt to Equity Sep-09 Dec-09 Mar-10 Jun-10 Sep-10 Equity Utilities Telecom Common Stock Equity Number of Companies $ 3.8 $ 4.1 $ 4.2 $ 4.3 $ 4.2 Materials Total Equity $ 3.8 $ 4.1 $ 4.2 $ 4.3 $ 4.2 Info Tech Industrials Debt and Equivalents Health Care Pref. Securities of Sub Trust - - - - - Energy Cons Staples Pref. Equity Outside Stock Equity - - - - - Cons Disc Preferred Stock Equity - - - - - PGC-V Minority Interest (Bal. Sheet) - - - - - Short-Term Debt - - - - - Long-Term Debt - - - - - Capital Lease Obligations - - - - - Total Debt and Equivalents $ - $ - $ - $ - $ - 0.00 0.50 1.00 1.50 2.00 2.50 3.00 3.50 4.00 Debt to Equity 0.00 0.00 0.00 0.00 0.00 Debt to Equity Rating NA Low Risk Debt to Equity High Risk Debt to Equity Rating NA Interest Coverage Sep-09 Dec-09 Mar-10 Jun-10 Sep-10 1.0 x EBIT 0.9 x Quarterly ($0.1) ($0.3) ($0.1) ($0.2) ($0.1) 0.8 x TTM Interest Coverage ($0.6) ($0.7) ($0.7) ($0.8) ($0.8) 0.7 x 0.6 x N/A Interest Expense 0.5 x Quarterly $ 0.0 $ 0.0 $ 0.0 $ 0.0 $ 0.0 TTM $ 0.0 $ 0.0 $ 0.0 $ 0.0 $ 0.0 0.4 x 0.3 x Interest Coverage 0.2 x Quarterly #N/A #N/A #N/A #N/A #N/A 0.1 x TTM #N/A #N/A #N/A #N/A #N/A 0.0 x Sep 09 Dec 09 Mar 10 Jun 10 Sep 10 Interest Coverage Rating Qtrly Interest Coverage Rating Quarterly TTM Interest Coverage Rating TTM Interest Coverage Rating N/A
  • 7. investorSCOREcard Plato Gold Corporation (PGC-V) Valuation Rating 4.5 Premium to Invested Capital (Lower numbers receive higher rankings) Premium to Invested Capital on Rolling 350% Quarterly (TTM) Sep-09 Dec-09 Mar-10 Jun-10 Sep-10 Working Capital (Excl S.T. Debt) $ 0.0 ($0.4) ($0.4) ($0.3) ($0.4) 300% Long-Term Net Fixed Capital $ 3.7 $ 4.7 $ 4.8 $ 4.6 $ 4.6 250% Net Invested Capital $ 3.8 $ 4.3 $ 4.3 $ 4.3 $ 4.2 200% Market Value of Equity $ 5.6 $ 4.8 $ 4.0 $ 3.6 $ 5.2 150% Debt and Equivalents Basis $ - $ - $ - $ - $ - TTM Enterprise Value $ 5.6 $ 4.8 $ 4.0 $ 3.6 $ 5.2 100% 50% Premium to Invested Capital 38.2% 9.2% -8.3% -17.7% 23.0% Premium to Invested Capital Rating 4.3 4.9 5.0 5.0 4.6 0% (50%) (100%) Mar Mar Mar Mar Mar Mar Mar Mar Mar Mar Mar 00 01 02 03 04 05 06 07 08 09 10 Premium to Invested Capital Rating 4.6 Price to Book (P/Book) (Lower numbers receive higher rankings) 6.0 x Annual (Fiscal Year) Dec-05 Dec-06 Dec-07 Dec-08 Dec-09 * Price $ 0.07 $ 0.05 $ 0.04 $ 0.04 $ 0.05 5.0 x Book Equity Per Share $ 0.05 $ 0.08 $ 0.08 $ 0.06 $ 0.04 P/Book on Quarterly Annual P/Book 4.0 x Annual P/Book Rating 4.8 4.8 4.8 4.8 4.8 Basis 3.0 x Quarterly Sep-09 Dec-09 Mar-10 Jun-10 Sep-10 * Price $ 0.07 $ 0.05 $ 0.04 $ 0.04 $ 0.05 2.0 x Book Equity Per Share $ 0.05 $ 0.04 $ 0.04 $ 0.04 $ 0.04 Quarterly P/Book 1.5 x 1.2 x 0.9 x 0.8 x 1.2 x 1.0 x Quarterly P/Book Rating 3.9 4.2 4.3 4.4 4.1 0.0 x Mar Mar Mar Mar Mar Mar Mar Mar Mar Mar Mar 00 01 02 03 04 05 06 07 08 09 10 Price to Book (P/Book) Rating 4.4 Market Implied In Situ Valuation Market Implied In Situ Valuation $0.20 Market Implied In $0.18 Resource Size at Certainty Levels of Situ Valuation per $0.16 Property (Primary Mineral) Equivalent '000 Ounces resource unit (C$) $0.14 $0.12 Nordeau West Main (Gold) Proven + Probable NA per Unit $0.10 Including Measured & Indicated 30,024 $0.17 $0.08 Including Inferred 174,743 $0.03 $0.06 $0.04 $0.02 $0.00 Proven + Probable Including Measured Including Inferred & Indicated NA * Price - Delayed 60 days to reflect the fact the financial statements are publicly approximately 60 days after the last day of the reporting period. For the last period the most recent price is used.
  • 8. investorSCOREcard Disclosure and Disclaimer The issuer (“Issuer”) covered under this investor scorecard (“Investor Scorecard”) has paid a fee to or has been charged a fee to produce and distribute this Investor Scorecard. The fee paid or charged for the production and distribution of this Investor Scorecard was not subject to the rankings or information provided herein, nor was any securities of the Issuer accepted as payment for such fee. FSA Financial Science & Art Ltd. (“FSA”), The Equicom Group Inc. (“Equicom”) and their respective employees and directors may have had or from time to time acquire, hold or sell an interest in the listed securities of the Issuer. Unless specified otherwise, all forward looking statements in this Investor Scorecard have been approved by the Issuer, and the Issuer has advised FSA and Equicom, without independent verification by FSA or Equicom that a reasonable basis exists for such forward looking statements. Other information contained in this Investor Scorecard has been compiled by FSA or Equicom from sources believed to be reliable, which may include but not limited to, public information, research reports and discussions with management of the Issuer. Prior to its publication, this Investor Scorecard had been submitted to the management of the Issuer for review for factual accuracy. No representation or warranty, express or implied, is made by FSA, Equicom, its affiliates, any other person that provided information or data for this Investor Scorecard or any person that distributes this Investor Scorecard with respect to the adequacy, accuracy, completeness or timeliness of any information, estimates or opinions provided in this Investor Scorecard. All estimates, opinions and other information in this Investor Scorecard are provided by FSA, Equicom or another party as of the date of this Investor Scorecard. Such estimates, opinions and other information are subject to change without notice, and are provided in good faith but without any legal responsibility. Past performance is no guarantee of future results. This Investor Scorecard is provided for informational purposes only and does not constitute an offer or solicitation to buy or sell any securities discussed herein in any jurisdiction. As a result, the securities discussed in this Investor Scorecard may not be eligible for sale in some jurisdictions. This Investor Scorecard is not, and under no circumstances should be construed as, a solicitation to act as a securities broker, dealer or advisor in any jurisdiction by any person or company that is not legally permitted to carry on the business of a securities broker, dealer or advisor in that jurisdiction. Neither FSA nor Equicom is a registered investment dealer, broker or advisor, has investment banking operations or makes markets in any securities. This Investor Scorecard is prepared for general circulation and to provide an overview of Issuer’s business. This Investor Scorecard does not consider the investment objectives, financial situation or particular needs of any particular person, and is not tailored to the needs of any person receiving this Investor Scorecard. Readers of this Investor Scorecard should obtain professional advice based on their own individual circumstances before making an investment decision. Nothing in this Investor Scorecard constitutes individual investment, legal or tax advice. To the fullest extent permitted by law, FSA, Equicom, Morningstar Inc., its content providers, any other person that has provided information or data for this Investor Scorecard nor any authorized person that distributes this Investor Scorecard accepts any liability whatsoever for any direct, indirect, special or consequential loss (whether in contract or tort even if FSA, Equicom or the other party has been advised of the possibility of such loss) arising from any use of, or reliance on the estimates, opinions or other information contained in this Investor Scorecard. Without limiting the generality of the foregoing, you are prohibited from using or disclosing any personal information contained in the Investor Scorecard for purposes unrelated to the purposes for which the information is made available to you and/or the public under Canadian securities laws, including, without limitation, for secondary marketing purposes, unless you have obtained any and all consents as required under applicable Canadian privacy laws. The information contained in this Investor Scorecard is copyrighted, and it may not be sold or licensed for commercial value or altered, in whole or in part, without prior express written consent of Equicom. Furthermore, Investor Scorecard can only be distributed in its entirety. Information or data herein, including any trade mark, service mark or logo is the intellectual property of FSA, Equicom, Morningstar Inc. and/or its content providers, Issuer or other persons that have provided such information or data, including but not limited to the organizations listed below and their respective content providers. This report was produced in part with information from the following organizations: