1. Introduction
PXRF is a geochemical technique capable of rapid, non-destructive
analysis in the lab and the field. However, it is relatively low-
powered, and therefore susceptible to sample matrix
heterogeneity (Forster et al. 2011).
Some (e.g., Speakman et al. 2011) have
questioned the viability of this technology
for ceramic provenance studies, given that
ceramics represent a synthetic blend (or
recipe) of ingredients.
Central to this is the issue of variability in
measurement. I present here the
preliminary results of an assessment of
PXRF, aimed at exploring the level of
variability within and between ceramic
artifacts.
Questions and answers
1. To what degree does variability within a ceramic sherd result in
misrepresentation of its overall geochemistry?
To answer this question, I undertook a program of repeated PXRF
measurements on ceramic sherds from several different sites. I
conducted repeat analyses at different locations both on the
exterior surfaces and the interior cores of the artifacts.
2. Can variability between artifacts be attributed to aspects
of technological organization?
To assess whether ceramic PXRF data carries enough structure to
make meaningful conclusions about behaviour in the past, I
conducted a small-scale, geochemical “inventory”-style analysis of
ceramic bodysherds from the Sigatoka Sand Dunes, on the Coral
Coast of Fiji.
Poorly-sorted, coarse-grained temper inclusions can result in substantial
variability in measurement.
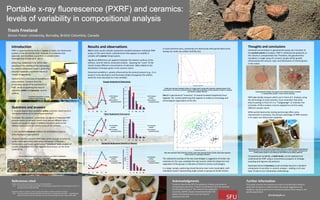
Results and observations
Part 1: Early results indicate substantial variability between individual PXRF
assays on the same sherd, a phenomenon that appears to amplify in
samples with coarser temper grains.
Significant differences are apparent between the exterior surfaces of the
artifacts, and the interior sectioned surfaces. Exposing the “cores” of the
sherds reveals different concentrations of elements, likely related to the
distribution of temper grains in the ceramic matrix.
Elemental variability is greatly influenced by the amount present (e.g., Cu is
present in low abundance and fluctuates widely throughout the artifact,
while the more abundant Si is less variable).
Tongan Bodysherd (Nukuleka)
Fijian Bodysherd (Vorovoro)
Jamaican Bodysherd (Sevilla La Nueva)
In some extreme cases, comparing non-destructive with partial-destructive
testing can make one artifact look like two.
Purple dots represent repeated assays of a single sherd; orange dots represent repeated assays of the
same sherd on an interior, sectioned surface. Differential weathering, and the presence of slips or coatings
can result in a pattern like this.
Part 2: A geochemical “inventory” of several hundred bodysherds from
Sigatoka, Fiji, reveals patterning that appears to relate to chronology and
technological organization at the site.
Blue dots represent Fijian Plainware sherds; green dots represent Navatu sherds; black dots represent
repeat assays of a geological standard.
The substantial overlap of the two assemblages is suggestive of similar raw
materials (in this case, probably the clay source), while the dispersion and
separation of the groups is indicative of distinct ceramic technologies.
In a larger sample, patterning should become even more meaningful, with
individual clusters representing single vessels or groups of similar vessels.
Acknowledgments
Thanks to Dave Burley (SFU) for guidance, critique, and access to
archaeological specimens; thanks to Rudy Reimer (SFU) for technical
and theoretical support. This research was supported
in part by a SSHRC Joseph Armand-Bombardier CGS
Masters Scholarship, and in part by financial
assistance from SFU.
Thoughts and conclusions
Elemental concentration in geochemical assays are a function of
the excited volume of analysis. PXRF is relatively low-powered, so
this volume is comparatively low. Therefore, the geochemistry
revealed in a single assay of a ceramic sample will be greatly
influenced by the amount, type, and distribution of mineral grains
in the matrix.
Coarse-grained samples may require more repeated assays to achieve
a “representative sample” of their overall chemistry.
PXRF can reliably measure what’s put in front of it. Analysts using
this technology to study ceramics must remember that what
they’re putting in front of it is a “hodgepodge” of minerals; the
principles of lithic analysis must be adapted to suit this vastly
different sample matrix.
While partial-destructive testing (sectioning) offers some
improvement in precision, the primary advantage of PXRF remains
in its rapid, non-destructive capability.
Wondering what to do with all those bodysherds? Each one contains important geochemical
data pertaining to the intentional selection and preparation of raw materials. The search for
ceramic paste recipes is one endeavour that PXRF may be ideally suited for.
Compositional variability, at both levels, can be explored and
understood by PXRF using a conscientious program of strategic
sampling and rigorous lab protocol.
Rapid geochemical inventory could someday become a standard
component of any lithic or ceramic analysis – adding a rich new
layer of data to our interpretive undertakings.
Travis Freeland
Simon Fraser University, Burnaby, British Columbia, Canada
References cited
Forster, Nicola, Peter Grave, Nancy Vickery, and Lisa Kealhofer
2011 Non-destructive analysis using PXRF: methodology and application to archaeological ceramics. X-
Ray Spectrometry 40(5):389-398.
Speakman, Robert J., Nicole C. Little, Darrell Creel, Myles R. Miller, and Javier G. Iñañez
2011 Sourcing ceramics with portable XRF spectrometers? A comparison with INAA using Mimbres
pottery from the American Southwest. Journal of Archaeological Science 38(12):3483-3496.
Further information
This poster presents the preliminary results of my MA thesis research,
which will culminate in a defense later this spring. Suggestions and
feedback, regarding technical or theoretical aspects of this research, are
greatly appreciated.
tfreelan@sfu.ca
0
5
10
15
20
25
Si Sr Mn Cu Rb
Coefficientofvariation
V-9 Exterior
surfaces
V-9 Interior
sectioned surface
0
2000
4000
6000
8000
10000
12000
14000
16000
Si Sr Mn Cu Rb
Meanconcentration(rawphotons)
V-9 Exterior
surfaces
V-9 Interior
sectioned surface
0
2000
4000
6000
8000
10000
12000
Si Sr Mn Cu Rb
Meanconcentration(rawphotons)
N-2 Exterior
surfaces
N-2 Interior
sectioned surface
0
5
10
15
20
25
30
35
40
45
50
Si Sr Mn Cu Rb
Coefficientofvariation
N-2 Exterior
surfaces
N-2 Interior
sectioned surface
0
2000
4000
6000
8000
10000
12000
14000
16000
18000
20000
Si Sr Mn Cu Rb
Meanconcentration(rawphoton
count)
J-3 Exterior
surfaces
J-3 Interior
sectioned surface
0
10
20
30
40
50
60
Si Sr Mn Cu Rb
Coefficientofvariation
J-3 Exterior
surfaces
J-3 Interior
sectioned surface
The Bruker Tracer III-V+ in action
at Simon Fraser University