Submit Search
Upload
Copy Of Monthly Denver Mls Stats 2009
•
Download as XLS, PDF
•
0 likes
•
177 views
Tom Cryer
Follow
This is our Monthly Denver MLS Residential Housing Statistical Report.
Read less
Read more
Technology
Business
Report
Share
Report
Share
1 of 2
Download now
Recommended
Residential Price Trends Feeding into Cherry Creek High School 2010
Tom Cryer
MyTownCryer Mid Year 2010 Analysis
Tom Cryer
MyTownCryer July, 2010
Tom Cryer
MyTownCryer June, 2010
Tom Cryer
A Three Year Sales History for Foxfield, Colorado 80016
Tom Cryer
AVERAGE PRICE AND TRANSACTION COUNT FOR HIGHLANDS RANCH COLORADO 2010
Tom Cryer
The Social Benefits Of Stable Housing
Tom Cryer
Mother\'s Day Denver 2010
Tom Cryer
AVERAGE PRICE HISTORY LAST THREE YEARS IN GREENWOOD VILLAGE, COLORADO
Tom Cryer
Denver, Colorado Monthly Mls Stats 2010
Tom Cryer
Weekly Economic Financial Commentary March 26, 2010
Tom Cryer
It Pays to Buy Now!
It Pays to Buy Now!
Tom Cryer
Cherry Hills Village March 2010
Tom Cryer
DENVER MARKET WATCH YEAR END 2009
Tom Cryer
February Foreclosure List for Denver, Colorado
Tom Cryer
Wells Fargo 2010 Annual Outlook
Tom Cryer
A COMPREHENSIVE ANALYSIS OF $1M+ TRANSACTIONS IN THE DENVER METRO AREA AS OF ...
Tom Cryer
University Hills Denver, CO Real Estate Report
Tom Cryer
2009 Us Corporate Relocation Benchmarking Survey
Tom Cryer
University of Denver Community Residential Real Estate Trends
Tom Cryer
Mortgage Brokers Association Data
Tom Cryer
Defeating Procrastination
Tom Cryer
Economic Summary September, 2009
Tom Cryer
Internet Security
Internet Security
Tom Cryer
Unglaublich
Unglaublich
Tom Cryer
Price To Income Ratio
Tom Cryer
The Moral Sources Of Capitalism
Tom Cryer
Saving For Peace Of Mind
Tom Cryer
A Year of the Servo Reboot: Where Are We Now?
Igalia
TrustArc Webinar - Stay Ahead of US State Data Privacy Law Developments
TrustArc
More Related Content
More from Tom Cryer
AVERAGE PRICE HISTORY LAST THREE YEARS IN GREENWOOD VILLAGE, COLORADO
Tom Cryer
Denver, Colorado Monthly Mls Stats 2010
Tom Cryer
Weekly Economic Financial Commentary March 26, 2010
Tom Cryer
It Pays to Buy Now!
It Pays to Buy Now!
Tom Cryer
Cherry Hills Village March 2010
Tom Cryer
DENVER MARKET WATCH YEAR END 2009
Tom Cryer
February Foreclosure List for Denver, Colorado
Tom Cryer
Wells Fargo 2010 Annual Outlook
Tom Cryer
A COMPREHENSIVE ANALYSIS OF $1M+ TRANSACTIONS IN THE DENVER METRO AREA AS OF ...
Tom Cryer
University Hills Denver, CO Real Estate Report
Tom Cryer
2009 Us Corporate Relocation Benchmarking Survey
Tom Cryer
University of Denver Community Residential Real Estate Trends
Tom Cryer
Mortgage Brokers Association Data
Tom Cryer
Defeating Procrastination
Tom Cryer
Economic Summary September, 2009
Tom Cryer
Internet Security
Internet Security
Tom Cryer
Unglaublich
Unglaublich
Tom Cryer
Price To Income Ratio
Tom Cryer
The Moral Sources Of Capitalism
Tom Cryer
Saving For Peace Of Mind
Tom Cryer
More from Tom Cryer
(20)
AVERAGE PRICE HISTORY LAST THREE YEARS IN GREENWOOD VILLAGE, COLORADO
Denver, Colorado Monthly Mls Stats 2010
Weekly Economic Financial Commentary March 26, 2010
It Pays to Buy Now!
It Pays to Buy Now!
Cherry Hills Village March 2010
DENVER MARKET WATCH YEAR END 2009
February Foreclosure List for Denver, Colorado
Wells Fargo 2010 Annual Outlook
A COMPREHENSIVE ANALYSIS OF $1M+ TRANSACTIONS IN THE DENVER METRO AREA AS OF ...
University Hills Denver, CO Real Estate Report
2009 Us Corporate Relocation Benchmarking Survey
University of Denver Community Residential Real Estate Trends
Mortgage Brokers Association Data
Defeating Procrastination
Economic Summary September, 2009
Internet Security
Internet Security
Unglaublich
Unglaublich
Price To Income Ratio
The Moral Sources Of Capitalism
Saving For Peace Of Mind
Recently uploaded
A Year of the Servo Reboot: Where Are We Now?
Igalia
TrustArc Webinar - Stay Ahead of US State Data Privacy Law Developments
TrustArc
Mastering MySQL Database Architecture: Deep Dive into MySQL Shell and MySQL R...
Miguel Araújo
Ransomware_Q4_2023. The report. [EN].pdf
Overkill Security
Navi Mumbai Call Girls 🥰 8617370543 Service Offer VIP Hot Model
Deepika Singh
+971581248768>> SAFE AND ORIGINAL ABORTION PILLS FOR SALE IN DUBAI AND ABUDHA...
?#DUbAI#??##{{(☎️+971_581248768%)**%*]'#abortion pills for sale in dubai@
Automating Google Workspace (GWS) & more with Apps Script
wesley chun
Real Time Object Detection Using Open CV
Khem
Exploring the Future Potential of AI-Enabled Smartphone Processors
debabhi2
AWS Community Day CPH - Three problems of Terraform
Andrey Devyatkin
Architecting Cloud Native Applications
WSO2
DBX First Quarter 2024 Investor Presentation
Dropbox
Apidays New York 2024 - The Good, the Bad and the Governed by David O'Neill, ...
apidays
Apidays New York 2024 - The value of a flexible API Management solution for O...
apidays
presentation ICT roal in 21st century education
jfdjdjcjdnsjd
MINDCTI Revenue Release Quarter One 2024
MIND CTI
Polkadot JAM Slides - Token2049 - By Dr. Gavin Wood
Juan lago vázquez
Artificial Intelligence Chap.5 : Uncertainty
Khushali Kathiriya
Apidays Singapore 2024 - Scalable LLM APIs for AI and Generative AI Applicati...
apidays
Apidays Singapore 2024 - Building Digital Trust in a Digital Economy by Veron...
apidays
Recently uploaded
(20)
A Year of the Servo Reboot: Where Are We Now?
TrustArc Webinar - Stay Ahead of US State Data Privacy Law Developments
Mastering MySQL Database Architecture: Deep Dive into MySQL Shell and MySQL R...
Ransomware_Q4_2023. The report. [EN].pdf
Navi Mumbai Call Girls 🥰 8617370543 Service Offer VIP Hot Model
+971581248768>> SAFE AND ORIGINAL ABORTION PILLS FOR SALE IN DUBAI AND ABUDHA...
Automating Google Workspace (GWS) & more with Apps Script
Real Time Object Detection Using Open CV
Exploring the Future Potential of AI-Enabled Smartphone Processors
AWS Community Day CPH - Three problems of Terraform
Architecting Cloud Native Applications
DBX First Quarter 2024 Investor Presentation
Apidays New York 2024 - The Good, the Bad and the Governed by David O'Neill, ...
Apidays New York 2024 - The value of a flexible API Management solution for O...
presentation ICT roal in 21st century education
MINDCTI Revenue Release Quarter One 2024
Polkadot JAM Slides - Token2049 - By Dr. Gavin Wood
Artificial Intelligence Chap.5 : Uncertainty
Apidays Singapore 2024 - Scalable LLM APIs for AI and Generative AI Applicati...
Apidays Singapore 2024 - Building Digital Trust in a Digital Economy by Veron...
Copy Of Monthly Denver Mls Stats 2009
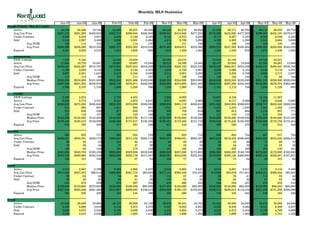
1.
Monthly MLS Statistics
Jan07 Jan08 Jan09 Feb07 Feb08 Feb09 Mar07 Mar08 Mar09 Apr07 Apr08 Apr09 May07 May08 May09 Single Family (Res & Condo) Active 24,350 24,489 19,748 24,838 25,037 20,059 26,430 25,516 20,628 27,858 26,171 20,705 29,110 26,333 20,734 Avg List Price $361,372 $391,288 $462,033 $362,718 $398,840 $466,562 $369,051 $410,380 $477,255 $376,899 $422,620 $477,255 $399,060 $435,107 $479,817 Under Contract 4,292 4,550 3,831 4,929 5,126 4,183 6,122 5,874 4,826 6,173 6,287 5,183 6,353 6,338 5,343 Sold 3,540 2,987 2,469 3,090 3,001 2,484 4,274 3,709 3,206 4,399 4,265 3,390 5,081 4,664 3,628 Avg DOM 120 114 101 125 114 107 119 111 106 110 106 104 102 100 105 Avg Price $266,066 $256,569 $213,330 $265,272 $255,363 $218,010 $275,465 $254,011 $232,395 $293,016 $247,583 $233,482 $288,905 $255,944 $243,022 Expired 3,281 2,932 2,279 1,483 1,609 992 1,945 1,409 1,054 1,561 1,438 979 1,670 1,436 1,053 Residential NEW Listings 7,325 8,195 14,520 16,084 24,095 24,512 33,634 33,785 44,536 43,027 Active 17,985 18,716 15,047 18,297 19,067 15,228 19,513 19,509 15,584 20,477 20,054 15,639 21,505 20,287 15,669 Avg List Price $409,061 $424,067 $510,797 $412,893 $437,033 $516,359 $419,428 $450,183 $525,549 $429,265 $464,917 $532,509 $456,457 $480,337 $538,182 Under Contract 3,380 3,658 3,134 3,888 4,144 3,352 4,809 4,750 3,907 4,898 5,068 4,153 5,045 5,116 4,301 Sold 2,667 2,351 1,943 2,413 2,342 2,008 3,315 2,951 2,590 3,472 3,353 2,706 3,952 3,717 2,857 Avg DOM 117 113 99 125 111 107 117 109 106 108 103 102 98 99 104 Median Price $236,000 $216,950 $181,500 $235,000 $221,486 $192,000 $240,000 $224,900 $203,950 $248,000 $222,550 $210,000 $251,155 $226,500 $220,000 Avg Price $297,368 $281,203 $230,878 $292,143 $278,871 $236,920 $302,084 $274,693 $251,583 $322,510 $267,259 $254,442 $318,904 $276,374 $262,066 Expired 2,362 2,137 1,720 1,066 1,248 766 1,334 1,093 820 1,181 1,112 709 1,242 1,124 805 Condo NEW Listings 2,462 2,273 4,756 4,453 7,880 6,665 10,931 9,156 14,182 11,567 Active 6,365 5,773 4,701 6,541 5,970 4,831 6,917 6,007 5,066 7,381 6,117 5,066 7,605 6,046 5,065 Avg List Price $226,620 $275,292 $305,948 $222,363 $276,859 $309,593 $226,938 $281,113 $306,823 $231,620 $283,953 $306,685 $236,757 $283,342 $299,258 Under Contract 912 892 697 1,041 982 831 1,313 1,124 919 1,275 1,219 1,030 1,308 1,222 1,042 Sold 873 636 526 677 659 476 959 758 616 927 912 684 1,129 947 771 Avg DOM 131 116 107 126 123 109 127 118 106 117 119 110 118 104 110 Median Price $154,900 $134,000 $113,000 $144,950 $133,750 $117,725 $153,000 $132,000 $128,500 $148,900 $134,500 $130,000 $155,000 $148,000 $137,000 Avg Price $170,440 $165,510 $148,509 $169,498 $171,817 $138,239 $183,451 $173,493 $151,716 $182,549 $175,245 $150,560 $183,896 $175,758 $172,454 Expired 919 795 559 417 361 226 611 316 234 380 326 270 428 312 248 Income Active 860 853 717 905 823 732 966 822 713 982 822 724 987 817 704 Avg List Price $498,071 $505,761 $549,775 $495,652 $511,152 $560,774 $463,937 $506,031 $565,327 $457,610 $519,335 $590,995 $464,865 $535,245 $592,812 Under Contract 65 84 53 103 84 61 93 83 59 86 85 68 75 68 70 Sold 53 38 34 37 47 26 48 42 34 39 44 32 54 53 32 Avg DOM 149 93 104 156 175 144 147 108 163 124 225 169 100 130 161 Median Price $301,950 $240,750 $165,100 $280,000 $205,000 $232,500 $280,000 $257,000 $175,625 $294,900 $292,250 $148,700 $278,000 $170,000 $165,000 Avg Price $374,520 $290,990 $232,540 $359,636 $305,176 $317,047 $505,801 $344,630 $252,042 $379,808 $393,148 $268,663 $365,444 $329,591 $197,851 Expired 142 151 129 68 87 54 104 77 82 86 73 64 99 101 62 Land Active 2,318 2,947 3,199 2,394 2,968 3,337 2,520 2,903 3,441 2,614 3,007 3,511 2,773 3,118 3,408 Avg List Price $371,363 $357,273 366,014 $369,600 $361,773 365,680 $371,121 $384,439 375,370 374,009 380,076 371,201 $364,001 $389,252 385,867 Under Contract 96 64 34 84 63 31 112 87 43 96 76 41 113 83 44 Sold 92 45 25 63 41 26 100 53 23 84 64 32 61 52 36 Avg DOM 213 274 239 270 297 302 216 260 223 240 344 327 274 233 318 Median Price $139,000 $150,000 $275,000 $129,996 $168,000 $95,000 $107,000 $125,000 $85,000 $108,500 $148,000 $92,500 $135,000 $96,250 $80,950 Avg Price $227,848 $305,346 $491,460 $310,967 $209,083 $136,013 $164,089 $190,132 $120,505 $186,412 $239,014 $114,416 $251,096 $131,258 $250,096 Expired 303 330 428 150 144 166 161 206 158 116 155 342 143 164 220 Total Active 27,528 28,289 23,664 28,137 28,828 24,128 29,916 29,241 24,782 31,454 30,000 24,940 32,870 30,268 24,856 Under Contract 4,453 4,698 3,918 5,116 5,273 4,275 6,327 6,044 4,927 6,355 6,448 5,292 6,541 6,489 5,457 Sold 3,685 3,070 2,528 3,190 3,089 2,536 4,422 3,804 3,273 4,522 4,373 3,454 5,196 4,769 3,696 Expired 3,726 3,413 2,836 1,701 1,840 1,212 2,210 1,692 1,294 1,763 1,666 1,385 1,912 1,701 1,335
2.
Monthly MLS Statistics
Jun07 Jun08 Jun09 Jul07 Jul08 9Jul Aug07 Aug08 9Aug Sep07 Sep08 9Sep Oct07 Oct08 Oct09 Single Family (Res & Condo) Active 30,256 26,104 20853 30,272 25,673 20890 30,827 24,648 20225 30,335 23,923 19834 28,928 23,120 18945 Avg List Price $381,918 $444,399 482482 $384,204 $452,557 $479,500 $384,143 $460,415 $477,477 $390,165 $465,574 $476,407 $393,176 $464,634 $467,924 Under Contract 6,136 6,308 5664 5,951 5,878 5,286 5,325 5,590 5,248 4,329 5,269 5,228 4,645 4,504 4,910 Sold 5,129 4,845 4186 4,980 5,123 4440 5,010 4,542 3905 3,737 4,265 3846 3,848 4,282 3958 Avg DOM 97 97 100 95 98 100 94 98 95 101 96 96 97 95 93 Avg Price $304,055 $267,005 258434 $289,294 $262,224 727 $298,467 $261,107 251008 $278,615 $239,428 251112 $236,000 $232,084 238807 Expired 1,554 1,381 897 1,930 1,726 1246 1,956 1,552 1077 1,950 1,455 1052 2,356 1,853 1109 Residential NEW Listings YTD 55,360 51,857 65,495 60,514 76,152 68,322 84,845 75,831 Active 22,514 20,105 15790 22,643 19,788 15830 23,229 19,050 15302 23,027 18,496 15046 21,947 17,842 14376 Avg List Price $430,213 $490,076 540432 $431,165 $497,935 $538,974 $428,098 $503,573 $537,499 $434,080 $510,402 $532,757 $436,268 $510,747 $521,686 Under Contract 4,867 5,091 4468 4,698 4,764 4198 4,185 4,443 4106 3,453 4,243 4029 3,677 3,649 3800 Sold 4,066 3,847 3328 3,899 4,154 3484 3,943 3,581 3066 2,928 3,366 3001 3,017 3,386 3052 Avg DOM 94 94 101 90 97 98 92 97 94 100 95 96 95 93 92 Median Price $263,000 $230,000 237500 $255,000 $229,200 229900 $257,500 $225,000 227000 $245,000 $216,150 225000 $234,200 $206,000 222000 Avg Price $334,833 $286,887 283312 $316,024 $283,860 276664 $329,783 $284,531 273972 $305,459 $260,118 274433 $289,754 $250,172 261771 Expired 1,129 1,086 679 1,429 1,337 931 1,463 1,204 804 1,418 1,123 817 1,786 1,456 843 Condo NEW Listings YTD 17,271 13,936 20,192 16,139 23,125 18,189 25,517 20,152 Active 7,742 5,999 5063 7,629 5,885 5060 7,598 5,598 4923 73,008 5,427 4788 6,981 5,278 4569 Avg List Price $241,476 $291,319 301754 $244,822 $299,974 $293,440 $249,763 $313,550 $290,912 $251,792 $312,795 $299,330 $257,702 $308,752 $298,766 Under Contract 1,269 1,217 1196 1,253 1,114 1088 1,140 1,147 1142 876 1,026 1199 968 855 1110 Sold 1,063 998 858 1,081 969 956 1,067 961 839 809 899 845 831 896 906 Avg DOM 108 108 97 112 100 109 102 104 98 105 102 97 102 102 98 Median Price $157,950 $148,345 198500 $158,000 $149,000 145500 $152,500 $140,000 144500 $148,000 $139,900 145000 $140,000 $130,300 135000 Avg Price $186,328 $190,367 161939 $192,885 $169,474 165530 $182,741 $173,823 167090 $181,458 $161,960 168288 $176,222 $164,686 161451 Expired 425 295 218 501 389 315 493 348 273 532 332 235 570 397 266 Income Active 1023 855 712 1070 838 704 1066 871 701 1062 898 711 1050 878 737 Avg List Price $453,517 $522,383 572916 $442,230 $528,530 $563,426 $461,965 $517,694 $578,832 $451,268 $527,515 $584,923 $443,322 $547,668 $546,946 Under Contract 78 74 47 80 77 72 80 71 65 65 61 65 73 74 73 Sold 48 43 42 40 52 41 35 39 33 40 52 30 39 39 40 Avg DOM 113 147 119 103 97 151 171 117 172 114 138 120 122 151 142 Median Price $289,950 $225,000 198500 $302,500 $233,500 217500 $330,000 $229,000 155000 $249,950 $174,950 175500 $260,000 $251,000 189750 Avg Price $492,957 $325,750 252861 $461,079 $390,910 365950 $461,254 $368,453 207631 $371,924 $273,879 185768 $386,583 $471,864 265999 Expired 87 67 54 92 90 72 117 101 75 87 54 53 110 85 75 Land Active 2,895 3,214 3479 2,901 3,295 3482 2,969 3,365 3468 3,050 3,411 3634 3,134 3,285 3511 Avg List Price $362,903 $392,922 388985 $372,532 $398,415 $371,538 $355,916 $405,236 $361,167 $364,085 $407,476 $344,892 $358,772 $412,115 $351,671 Under Contract 129 71 54 118 57 50 125 62 62 98 53 56 79 36 47 Sold 94 57 32 84 59 45 103 37 55 54 50 49 100 45 48 Avg DOM 196 221 365 252 142 300 271 140 277 258 321 277 213 186 237 Median Price $154,775 $100,000 76000 $122,500 $93,000 48500 $115,380 $150,000 61000 $87,000 $74,000 79000 $84,450 $135,000 80500 Avg Price $224,071 $212,260 117222 $237,370 $169,086 156843 $269,088 $185,200 211978 $212,168 $121,544 111748 $201,447 $276,163 157305 Expired 162 202 207 273 253 242 154 186 220 173 179 164 210 320 265 Total Active 34,174 30,173 25044 34,243 29,806 25076 34,862 28,884 24394 34,447 28,232 24179 33,112 27,283 23193 Under Contract 6,343 6,453 5765 6,149 6,012 5408 5,530 5,723 5375 4,492 5,383 5349 4,797 4,614 5030 Sold 5,271 4,945 4260 5,104 5,234 4526 5,148 4,618 3993 3,831 4,367 3925 3,987 4,366 4046 Expired 1,803 1,650 1158 2,295 2,069 1560 2,227 1,839 1372 2,210 1,688 1269 2,676 2,258 1449
Download now