Downloaded 211 times
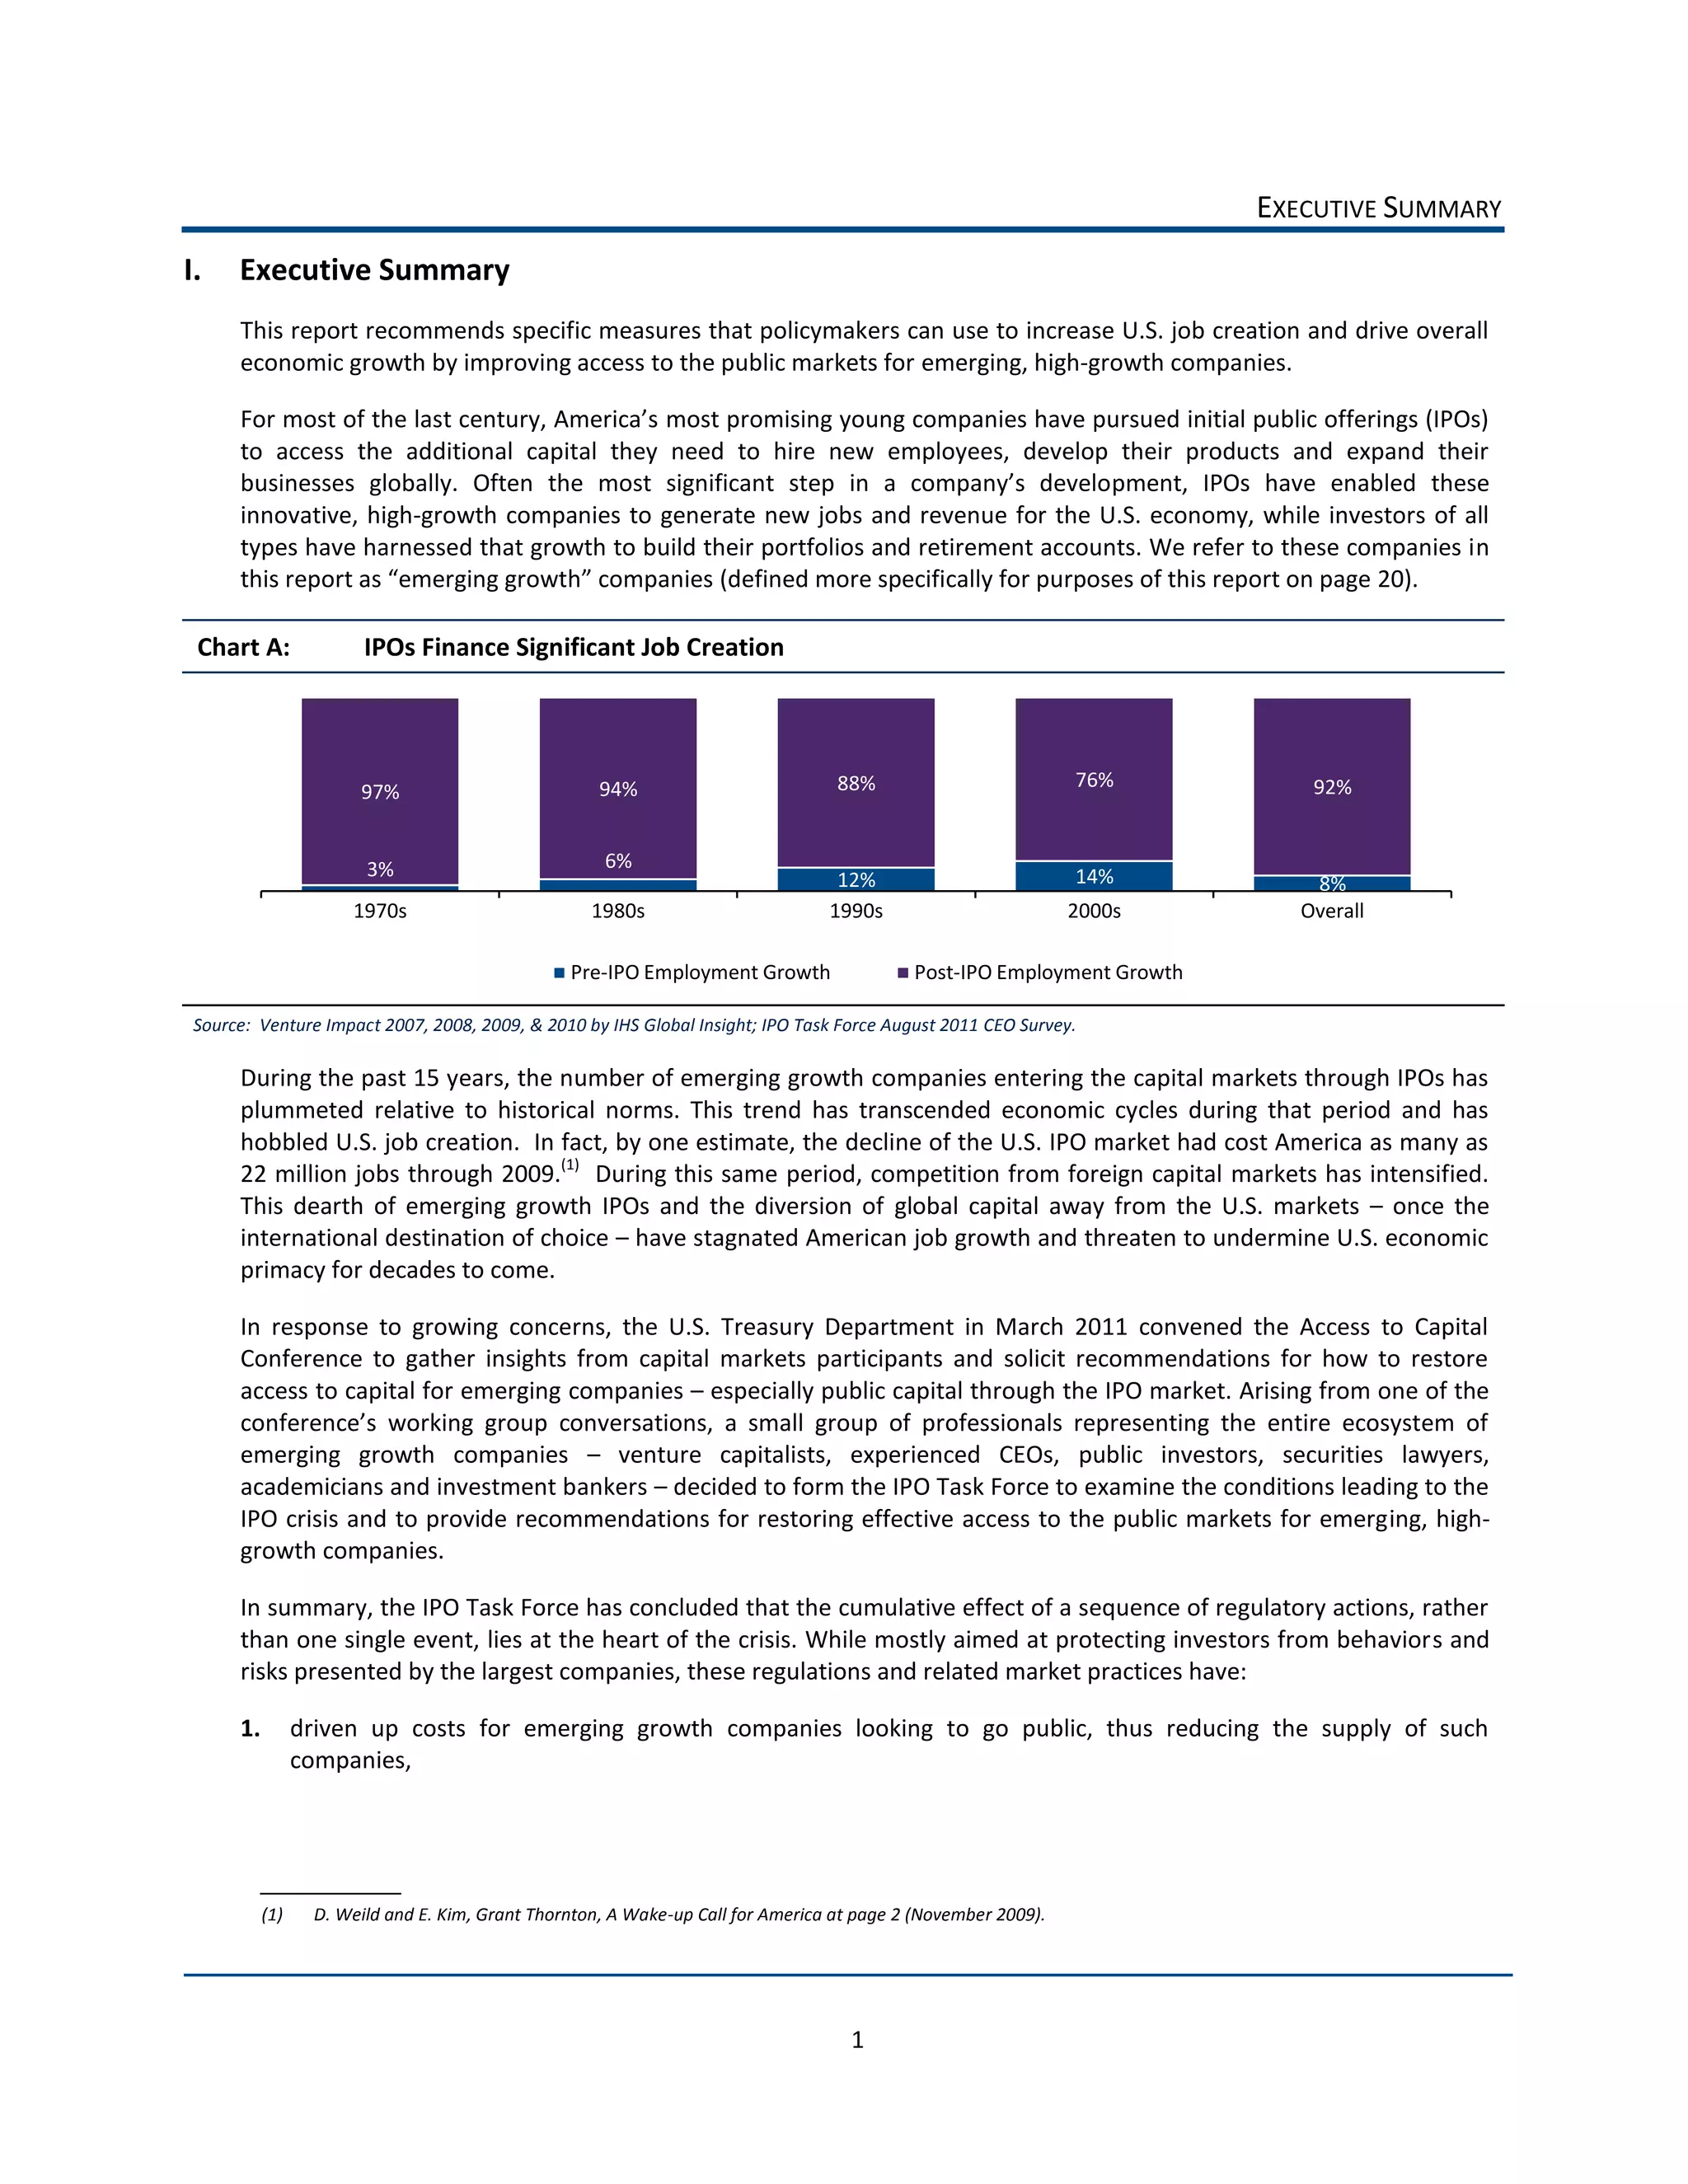
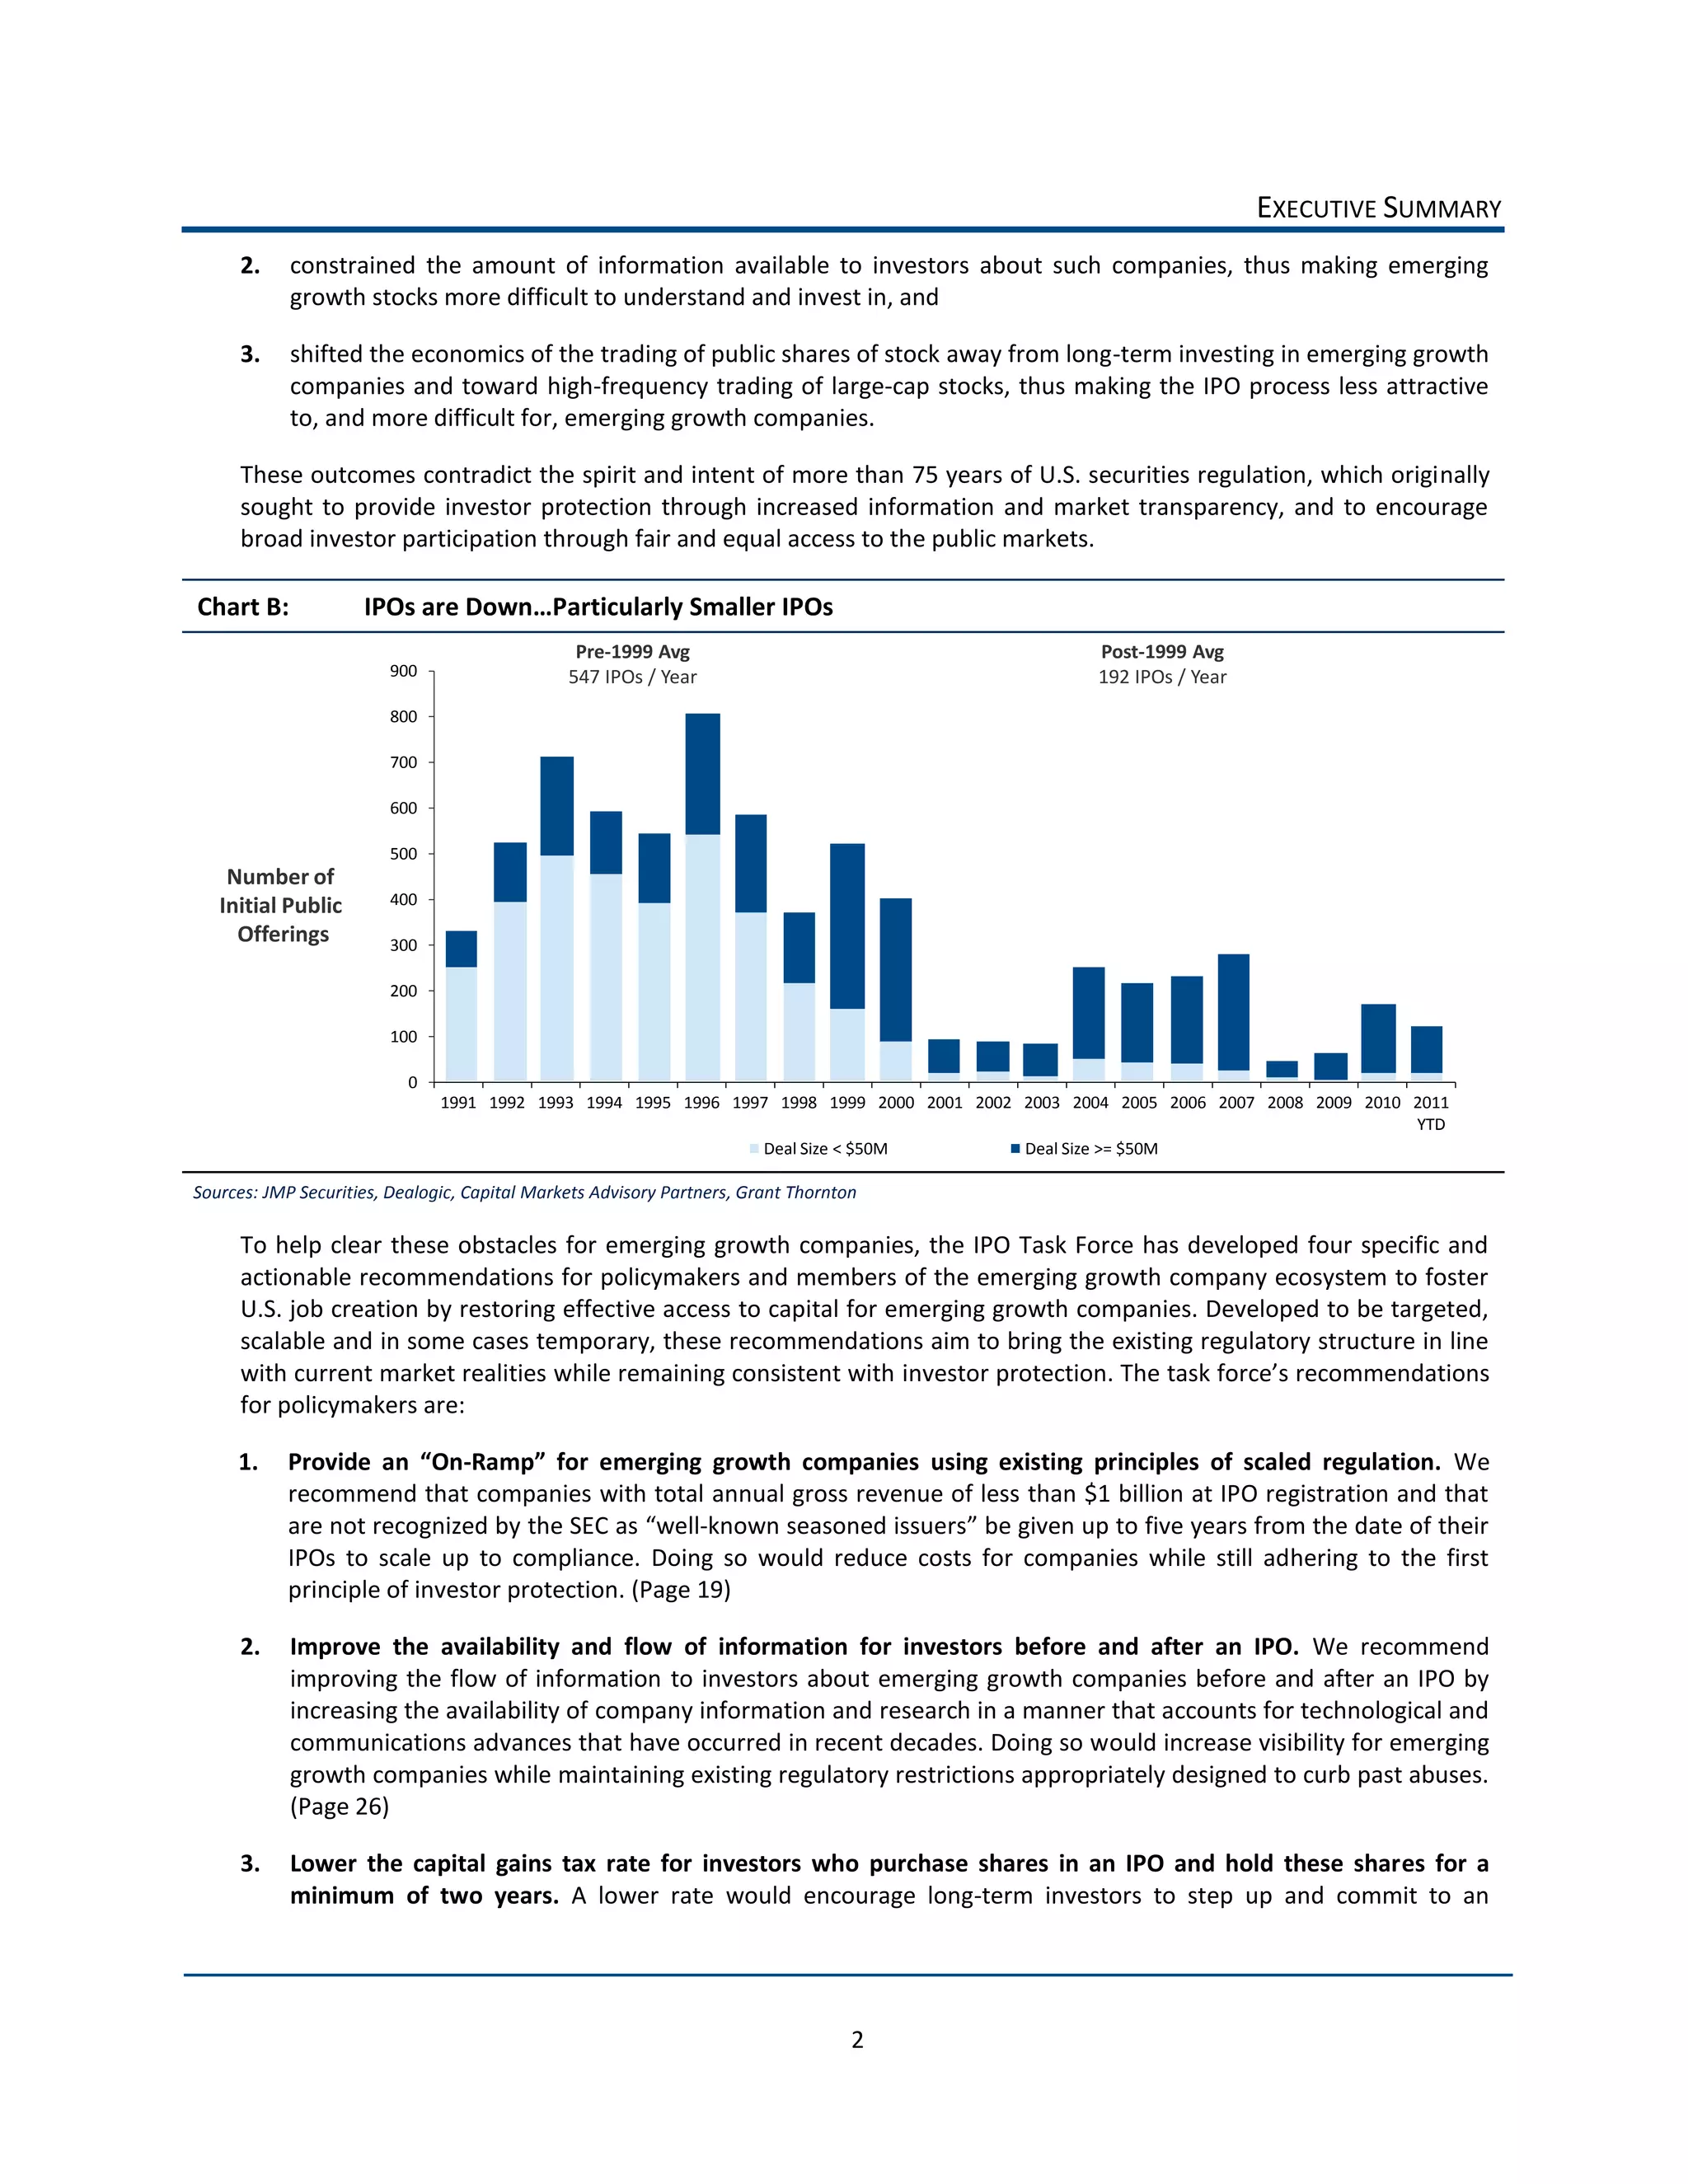
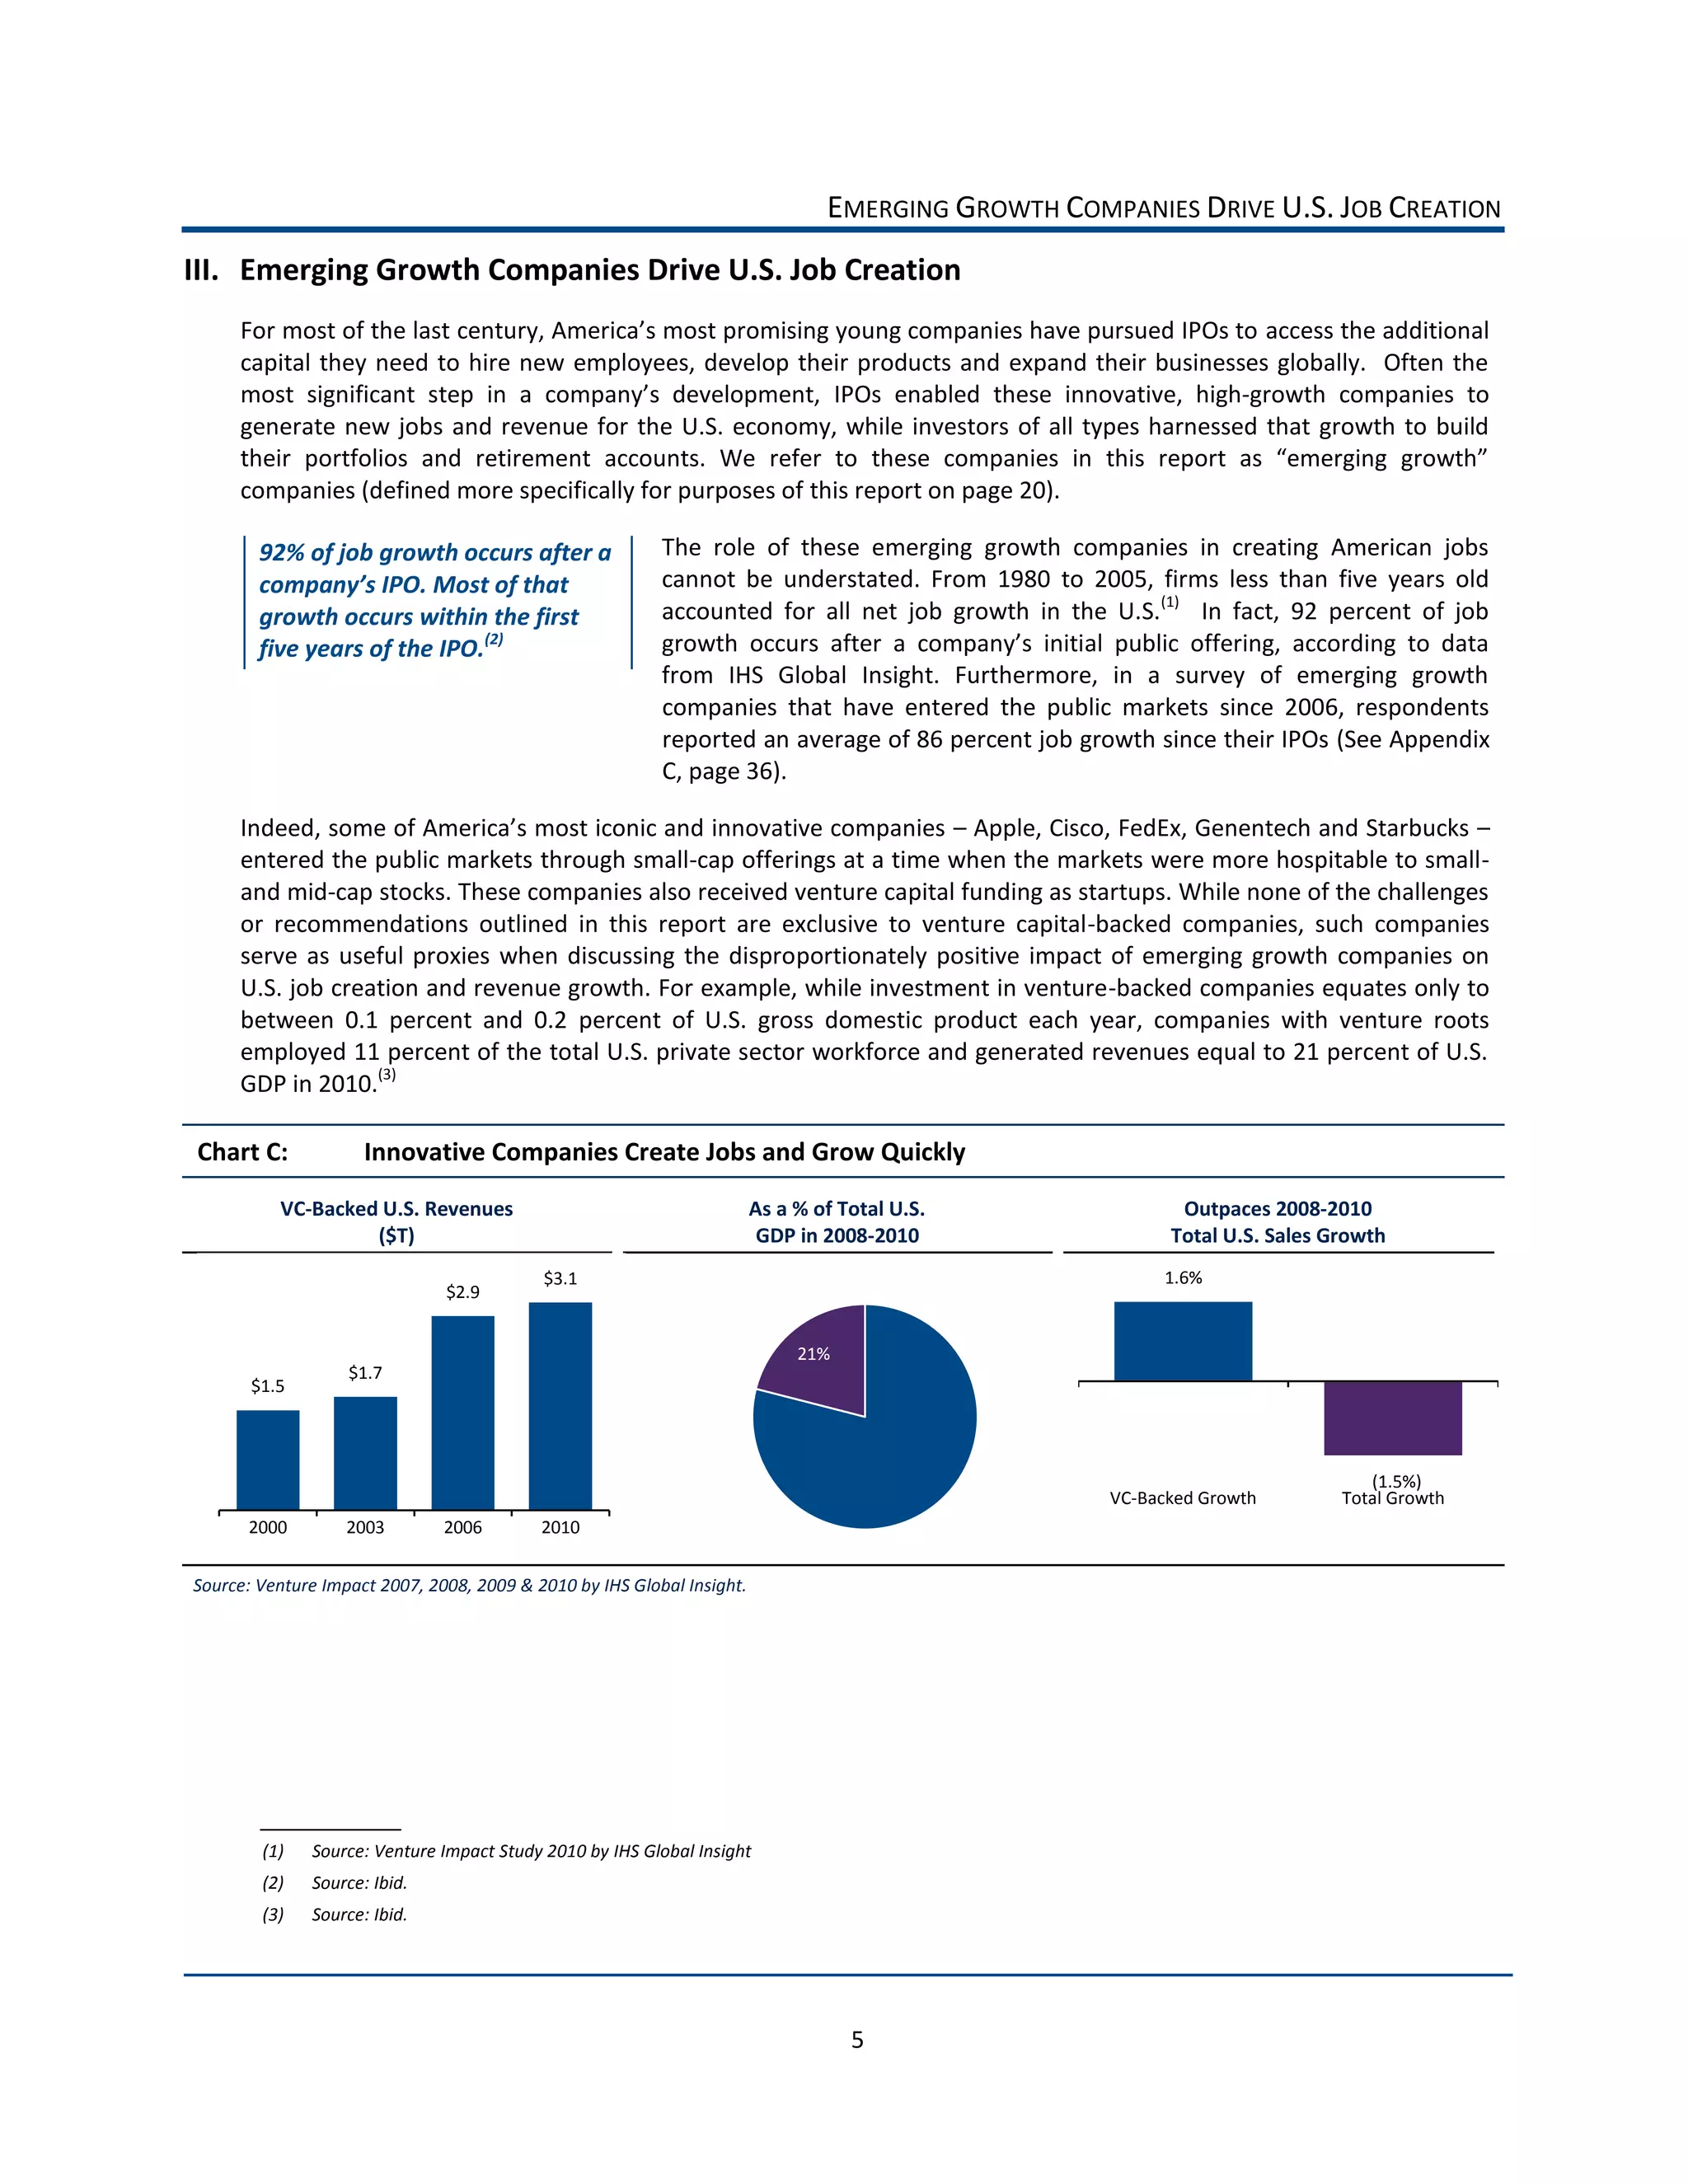
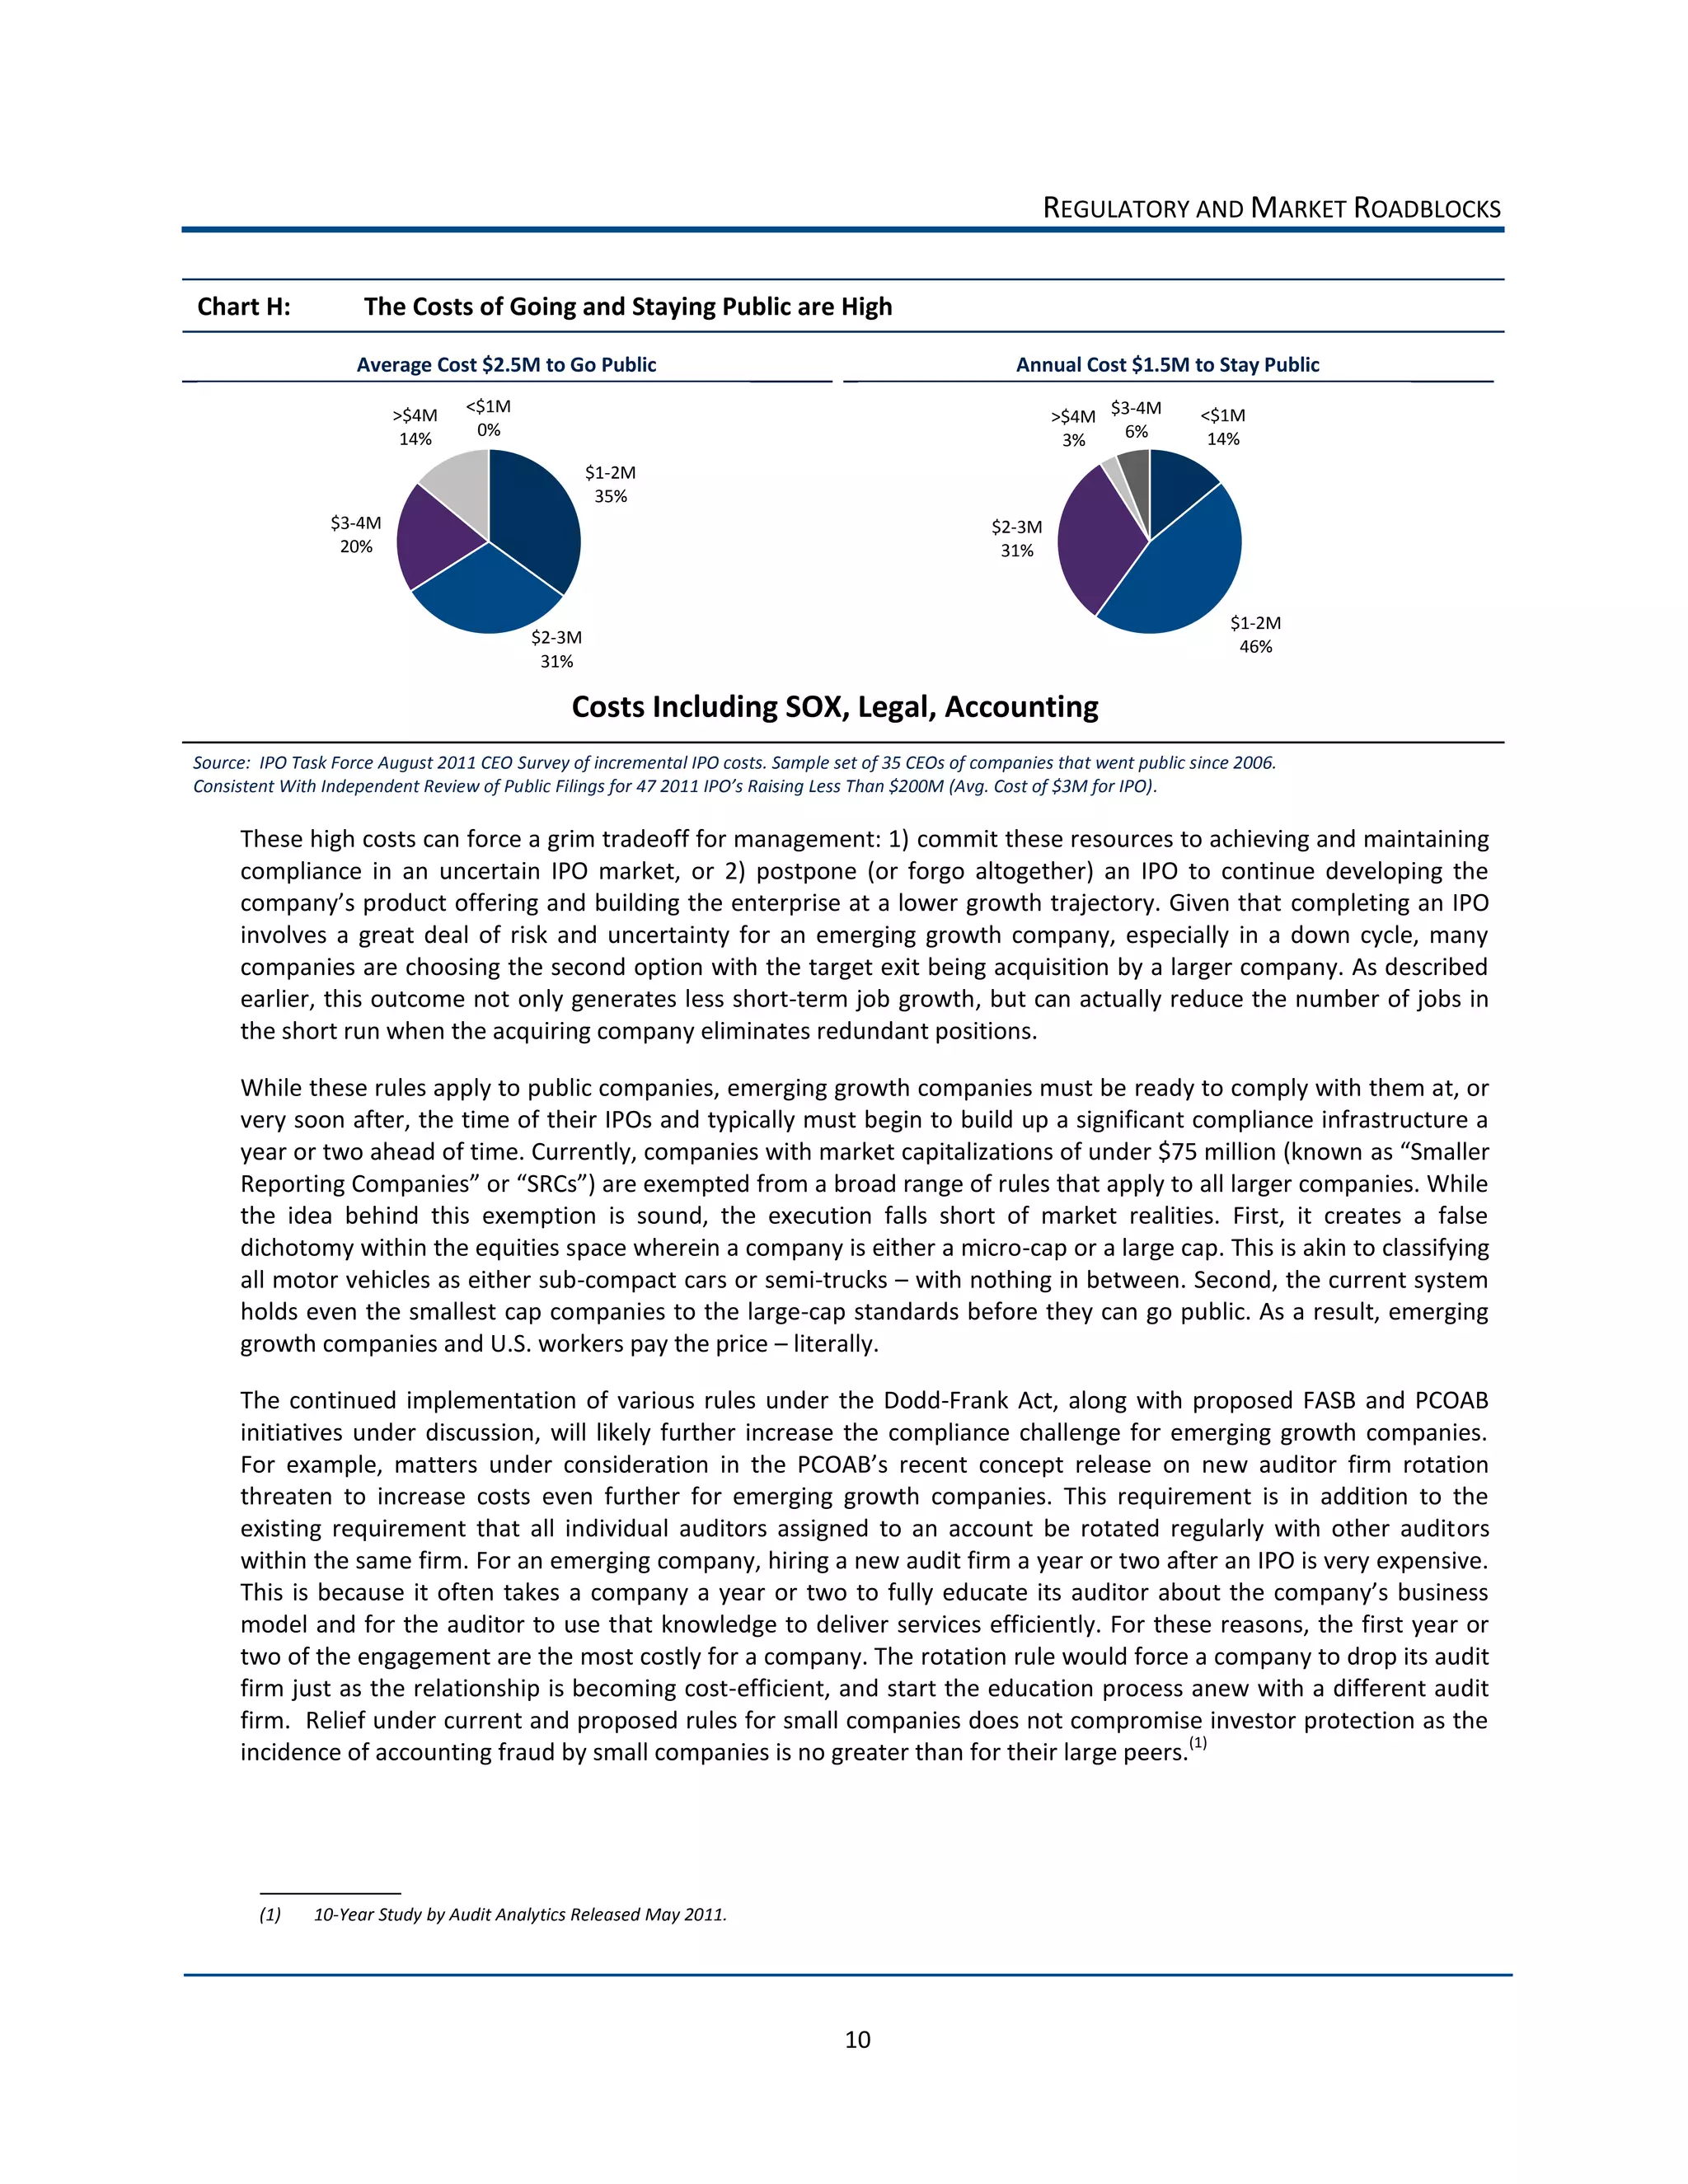
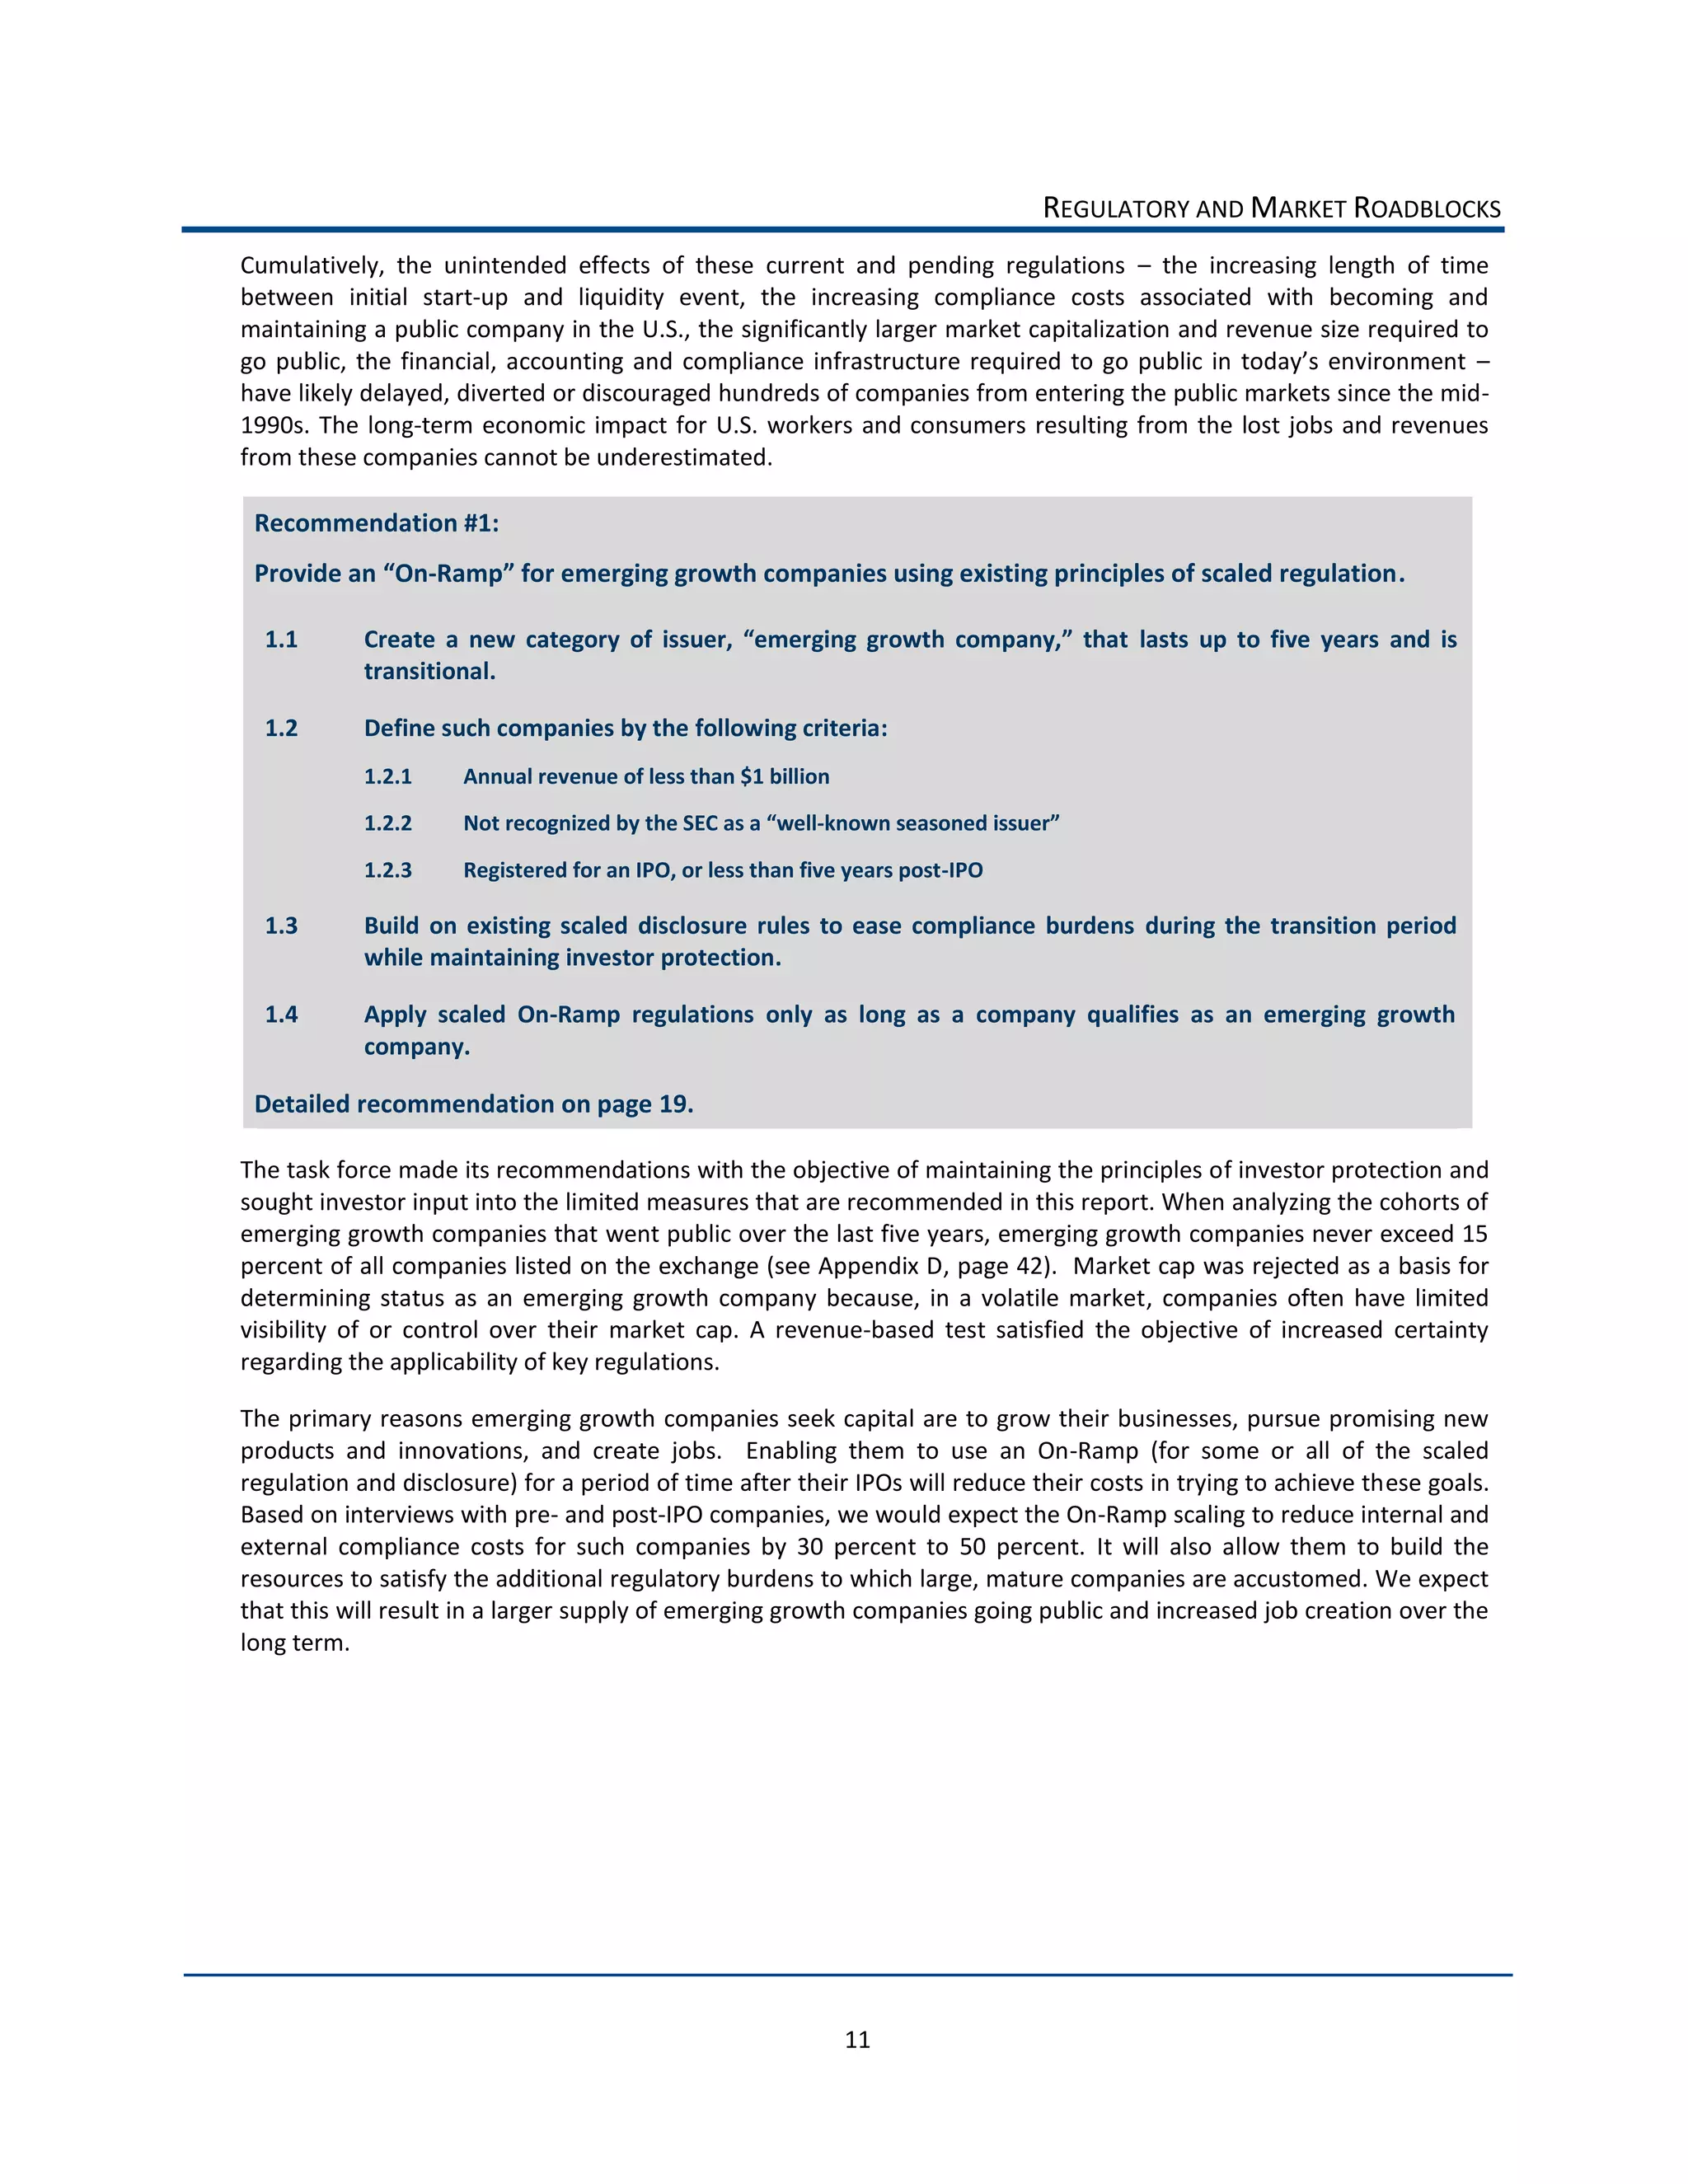
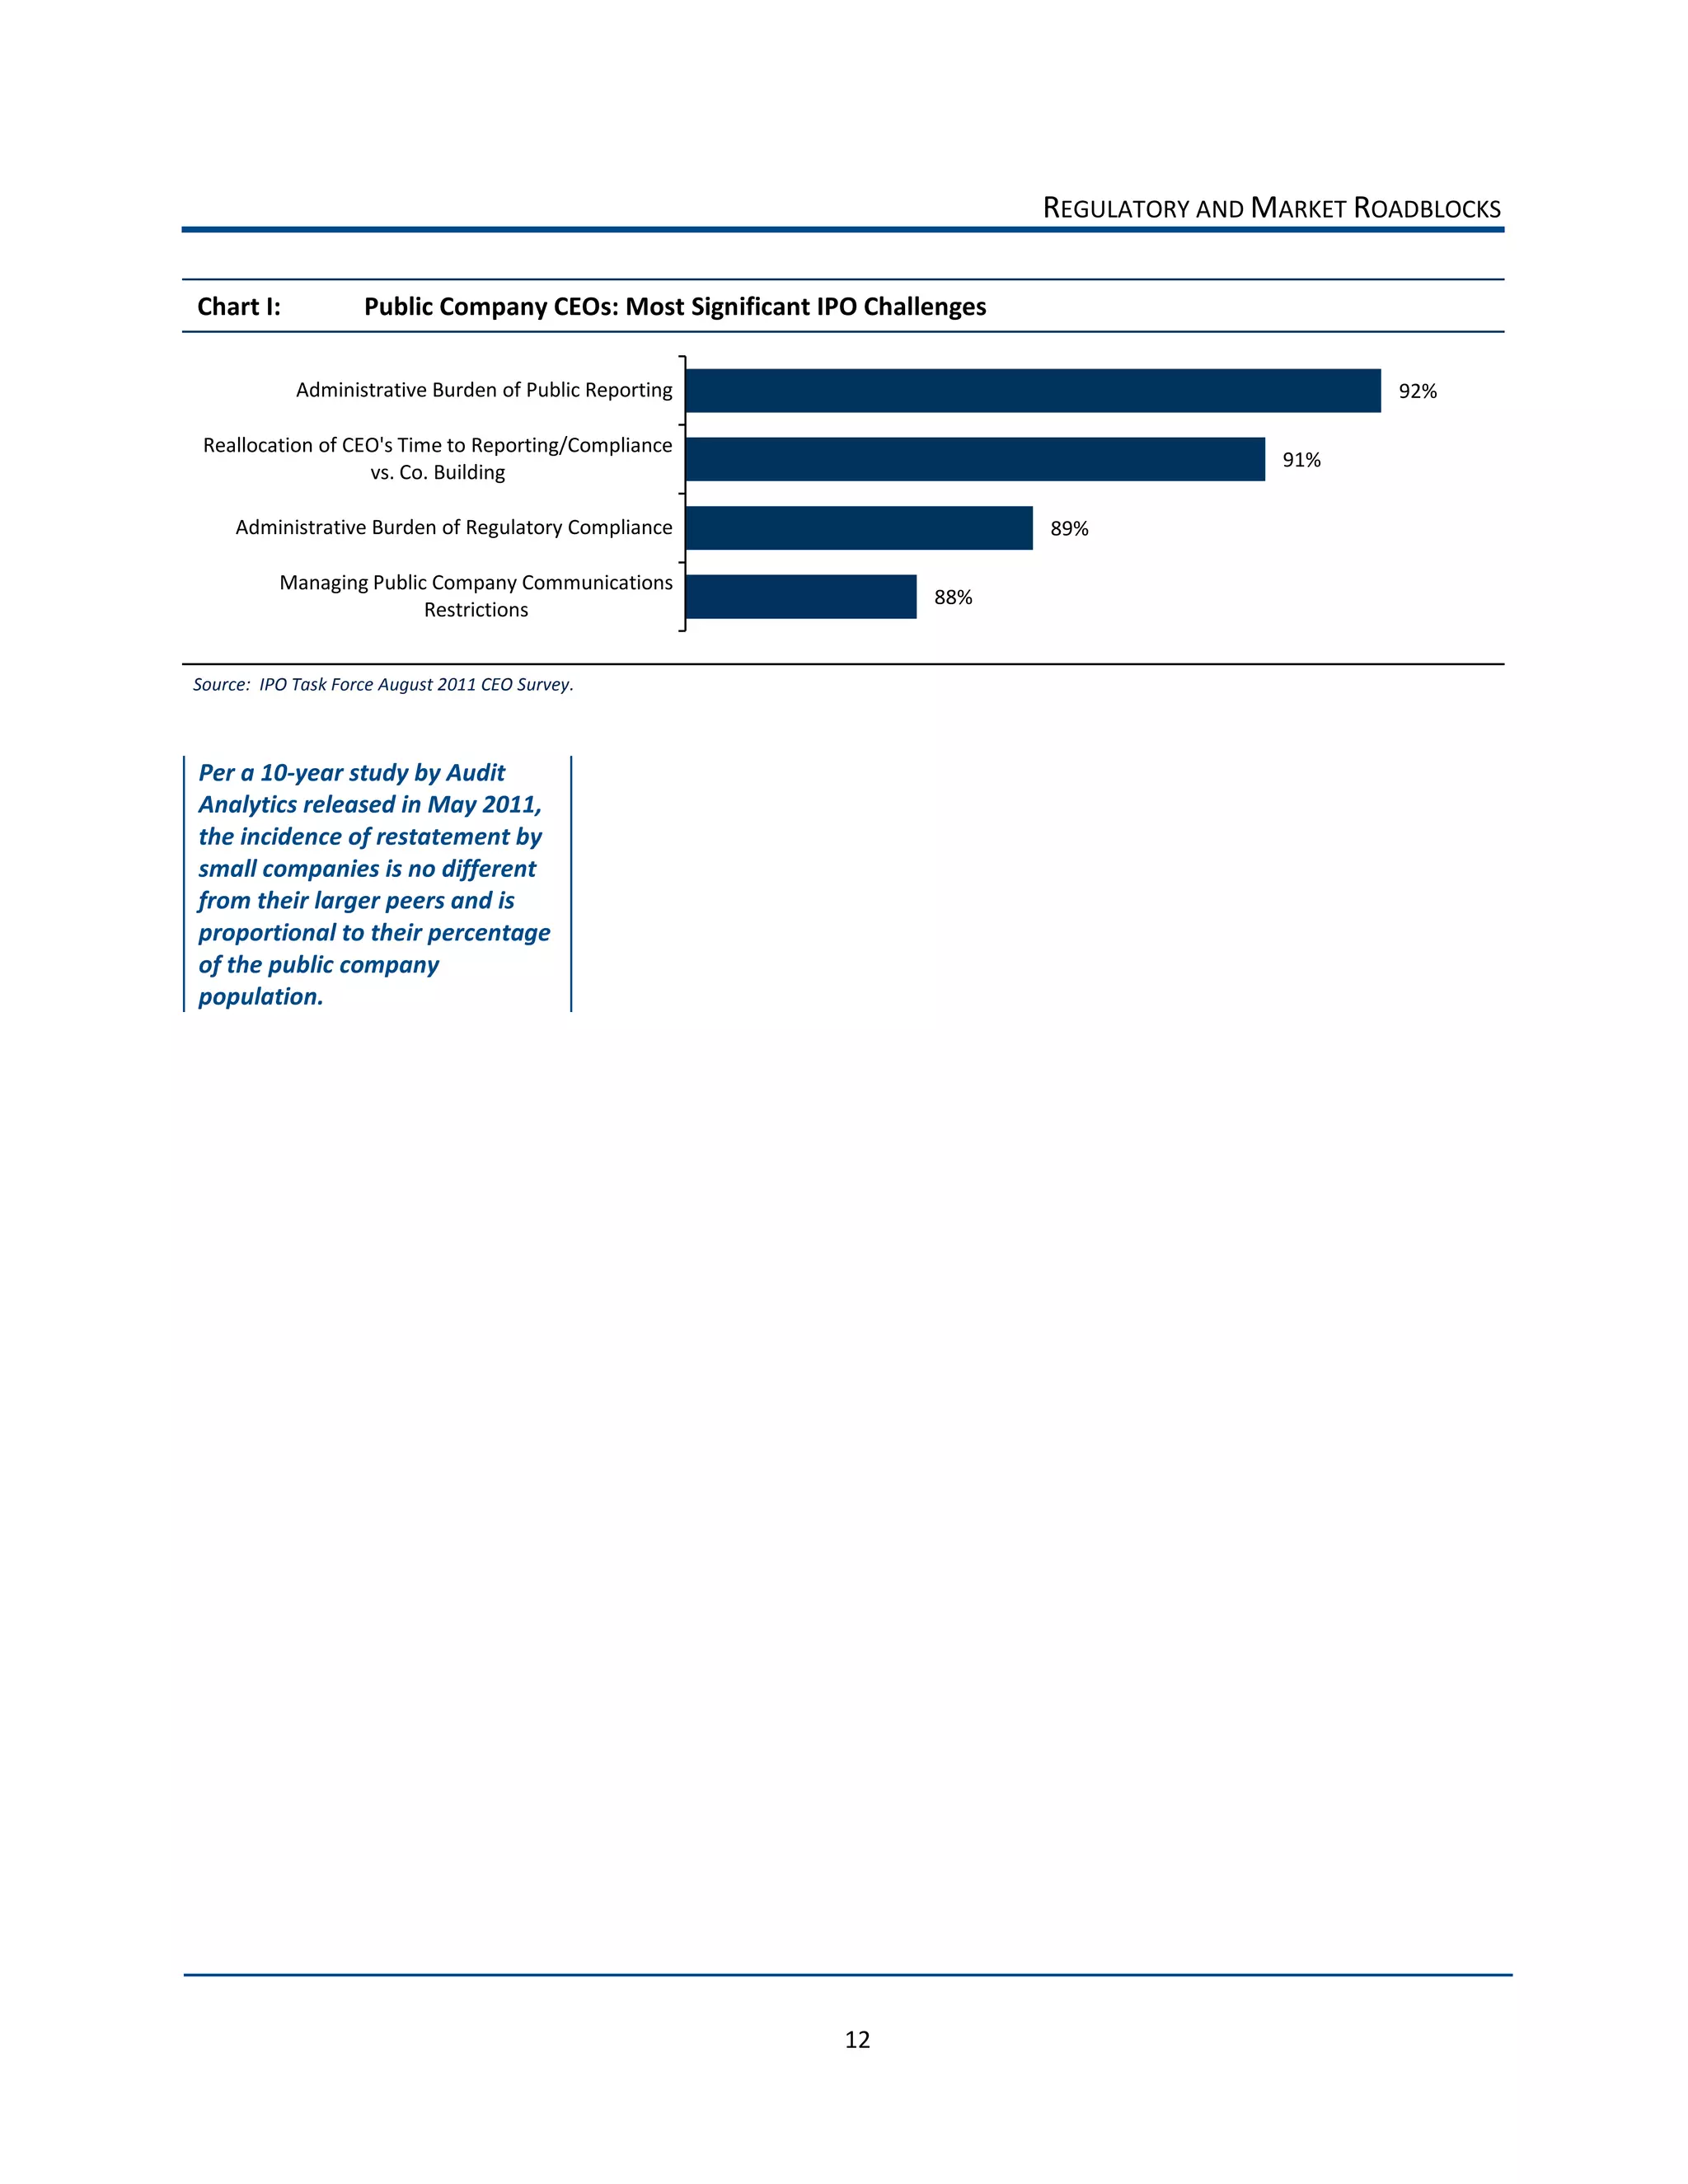
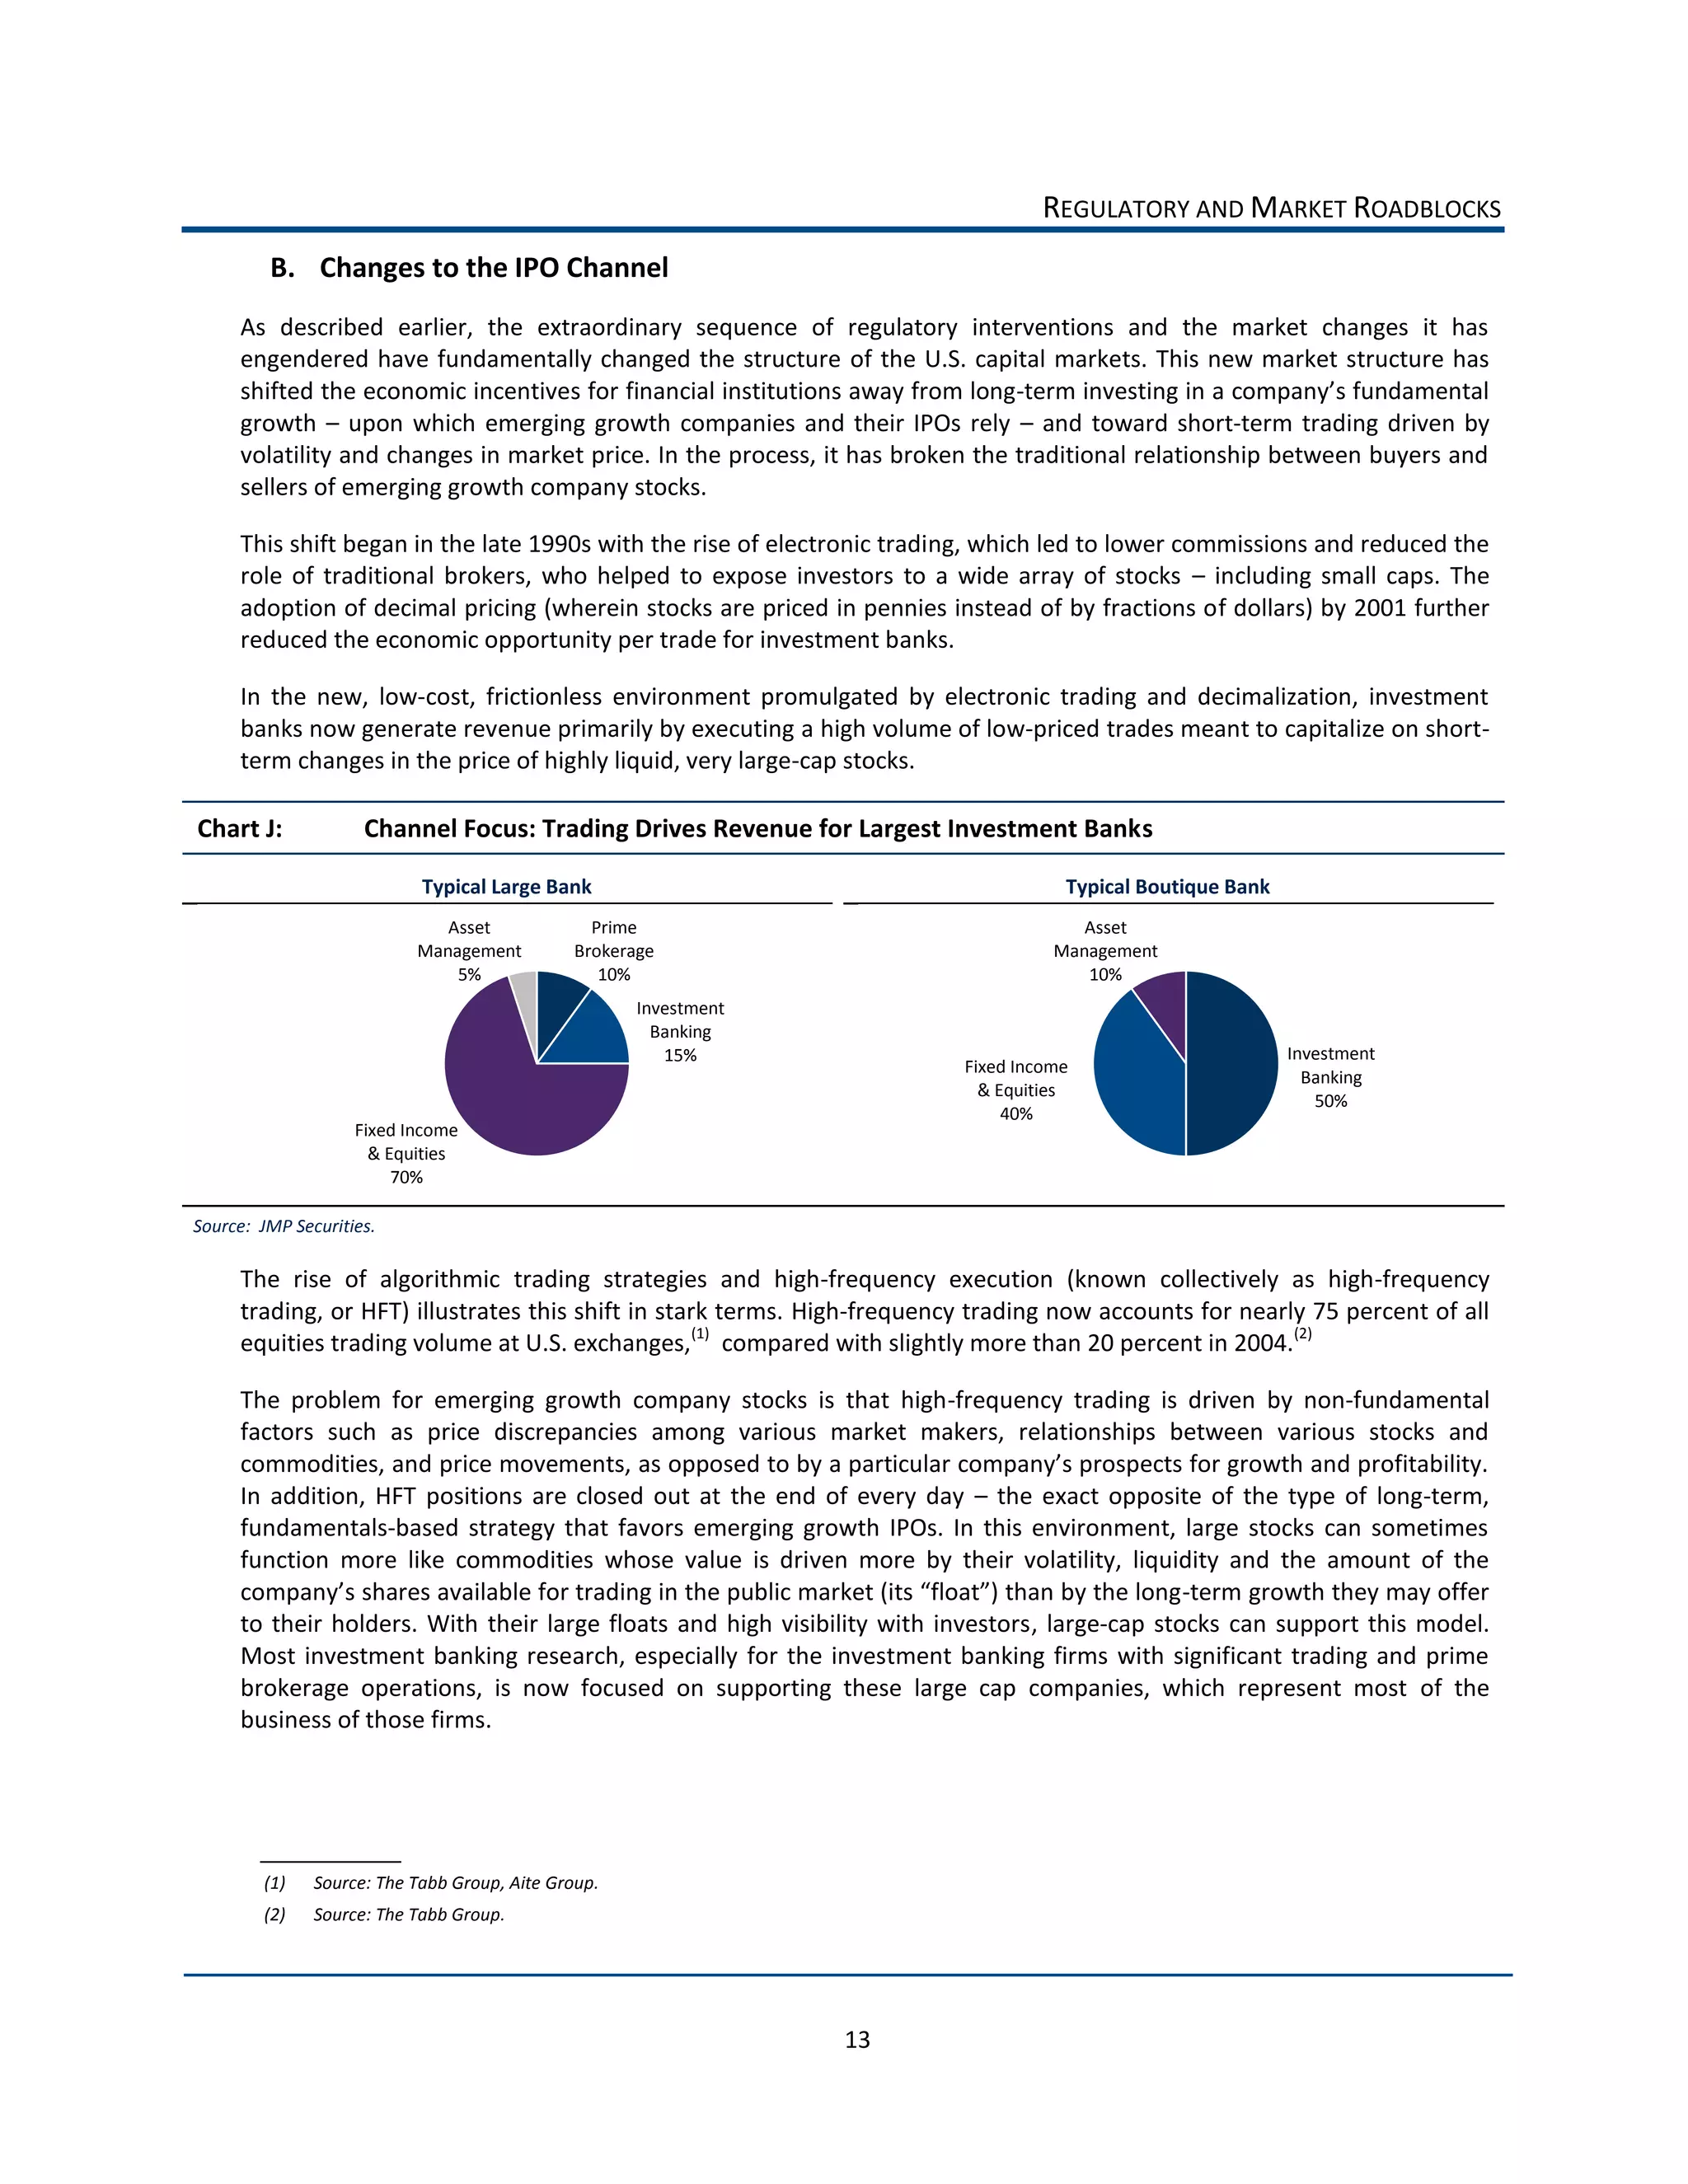
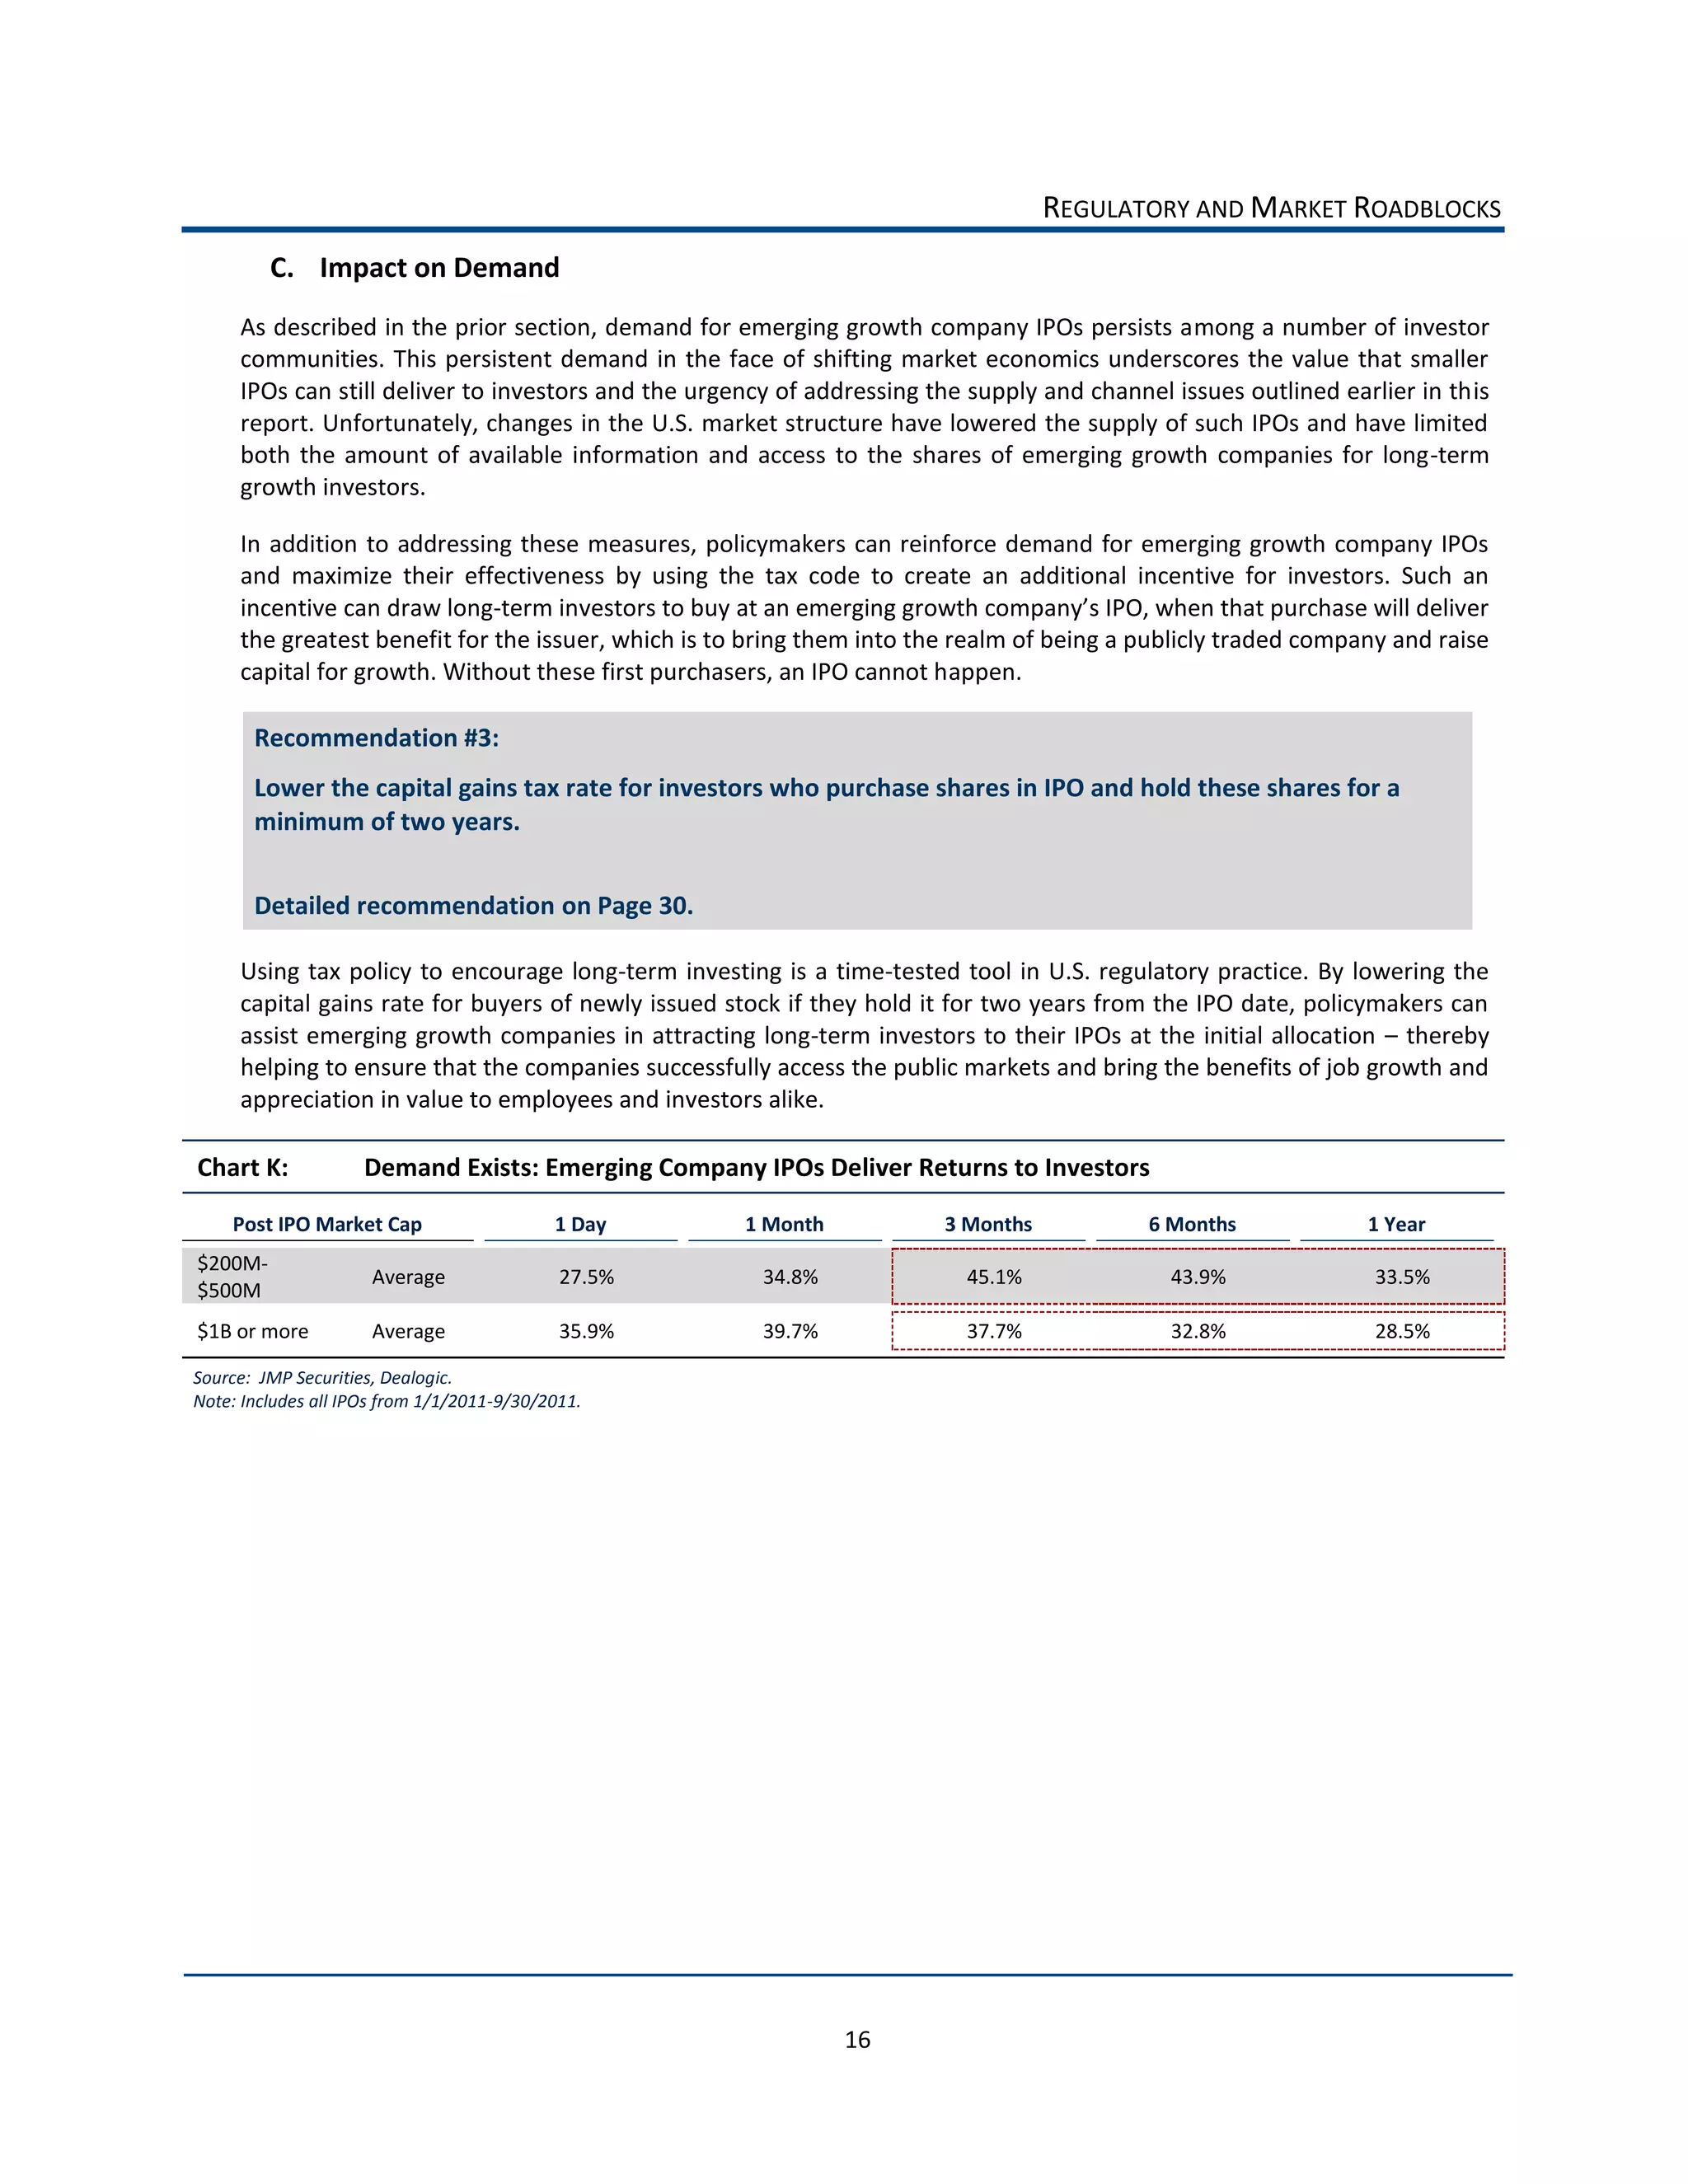


The document discusses recommendations from the IPO Task Force to improve access to capital for emerging growth companies through the IPO market. It finds that regulatory changes aimed at large companies have unintentionally increased costs for emerging companies, reduced information available to investors about them, and shifted capital markets focus away from emerging companies. The Task Force's four recommendations are: 1) Create a regulatory "on-ramp" allowing more time for emerging companies to comply with regulations; 2) Improve information flow to investors before and after IPOs; 3) Create an IPO tax incentive; and 4) Educate industry on emerging companies. The goal is to restore the IPO market's role in facilitating job growth.


