Energy & Commodities - 2010 - August/September
•
0 likes•301 views

Swedbank was founded in 1820, as Sweden’s first savings bank was established. Today, our heritage is visible in that we truly are a bank for each and every one and in that we still strive to contribute to a sustainable development of society and our environment. We are strongly committed to society as a whole and keen to help bring about a sustainable form of societal development. Our Swedish operations hold an ISO 14001 environmental certification, and environmental work is an integral part of our business activities.

Recommended
Recommended
More Related Content
What's hot
What's hot (20)
Viewers also liked
Viewers also liked (10)
Similar to Energy & Commodities - 2010 - August/September
Similar to Energy & Commodities - 2010 - August/September (17)
More from Swedbank
More from Swedbank (20)
Recently uploaded
Recently uploaded (20)
Energy & Commodities - 2010 - August/September
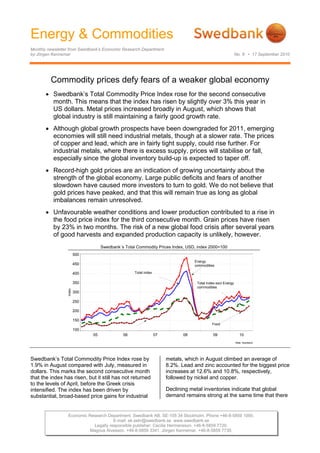
- 1. Energy & Commodities Monthly newsletter from Swedbank’s Economic Research Department by Jörgen Kennemar No. 8 • 17 September 2010 Economic Research Department. Swedbank AB. SE-105 34 Stockholm. Phone +46-8-5859 1000. E-mail: ek.sekr@swedbank.se www.swedbank.se Legally responsible publisher: Cecilia Hermansson. +46-8-5859 7720. Magnus Alvesson. +46-8-5859 3341. Jörgen Kennemar. +46-8-5859 7730. Commodity prices defy fears of a weaker global economy • Swedbank’s Total Commodity Price Index rose for the second consecutive month. This means that the index has risen by slightly over 3% this year in US dollars. Metal prices increased broadly in August, which shows that global industry is still maintaining a fairly good growth rate. • Although global growth prospects have been downgraded for 2011, emerging economies will still need industrial metals, though at a slower rate. The prices of copper and lead, which are in fairly tight supply, could rise further. For industrial metals, where there is excess supply, prices will stabilise or fall, especially since the global inventory build-up is expected to taper off. • Record-high gold prices are an indication of growing uncertainty about the strength of the global economy. Large public deficits and fears of another slowdown have caused more investors to turn to gold. We do not believe that gold prices have peaked, and that this will remain true as long as global imbalances remain unresolved. • Unfavourable weather conditions and lower production contributed to a rise in the food price index for the third consecutive month. Grain prices have risen by 23% in two months. The risk of a new global food crisis after several years of good harvests and expanded production capacity is unlikely, however. Swedbank´s Total Commodity Prices Index, USD, index 2000=100 Källa: Swedbank 05 06 07 08 09 10 Index 100 150 200 250 300 350 400 450 500 Total Index excl Energy commodities Total index Energy commodities Food Swedbank’s Total Commodity Price Index rose by 1.9% in August compared with July, measured in dollars. This marks the second consecutive month that the index has risen, but it still has not returned to the levels of April, before the Greek crisis intensified. The index has been driven by substantial, broad-based price gains for industrial metals, which in August climbed an average of 8.2%. Lead and zinc accounted for the biggest price increases at 12.6% and 10.8%, respectively, followed by nickel and copper. Declining metal inventories indicate that global demand remains strong at the same time that there
- 2. Energy & Commodities Monthly newsletter from Swedbank’s Economic Research Department, continued No. 8 • 17 September 2010 2 (4) are signs of supply restrictions. This is especially true of copper, where production has been limited in 2010 due to technical problems, strikes and lower capacity utilisation than expected. A further slowdown in the Chinese economy increases the likelihood that any increase in the price of copper will be held in check, though this is not yet reflected in the physical market. Copper inventories have fallen by 30% in four months and are at the lowest level since the autumn of last year. Supply conditions are not as tight as in 2007-2008, however. Signs of weaker growth in steel production grew during the summer. This is particularly true of China, which currently accounts for nearly half of global production. In July Chinese steel production rose by a modest 2% on an annual basis, its lowest growth rate since early 2009. It should be noted, however, that slowdown was from high levels after last year’s big stimulus package, which drove up production. Lower Chinese growth is the result of the credit constraints that have been put in place to avoid a future overheating, especially in the housing market. Steel production in China and metal prices Source: Reuters EcoWin 00 01 02 03 04 05 06 07 08 09 10 %-change -75 -50 -25 0 25 50 75 100 125 %-change -20 -10 0 10 20 30 40 50 60 Chines steel production, %-annual rate, left scale Prices on non-ferrous metals, %-annual rate, ri Weaker steel production in China will affect the price of other raw materials such as iron ore, nickel and coal, which are key inputs in steel production. In August Chinese imports of iron ore fell to the lowest level since 2009. A lower spot price for iron ore will create price pressure when contractual ore prices are set, which is now done quarterly rather than annually. Nickel, which is used in the production of stainless steel, has not yet been affected by lower steel production, but the risk of lower prices still remains. The market for aluminium is still facing an oversupply, partly due to higher aluminium production in China. Although aluminium has had a weaker price trend in 2010 than other metals, there is a risk of a sizable correction unless the global economy strengthens. Zinc and lead are other industrial metals with growing inventories due to increased mineral production. Our forecast of a slowdown in global growth during the second half year, when the temporary inventory build-up gradually subsides at the same time that economic policies are tightened in several countries, also assumes a slower price rise for metals. This is especially true of those that are in oversupply. For copper and tin, where supply is relatively limited, prices may continue to rise, despite that emerging economies are expected to grow at a slightly slower pace. Stock levels, base metals, million tons Source: LME, Reuters EcoWin 00 01 02 03 04 05 06 07 08 09 10 Ton(metric) -25000 0 25000 50000 75000 100000 125000 150000 175000 200000 225000 Ton(metric)(millions) 0.0 0.1 0.2 0.3 0.4 0.5 0.6 0.7 0.8 0.9 1.0 Copper Zink Lead Nickel, right scale Energy prices turned higher in August after three months of decline. The price of oil has fluctuated in the range of 70-80 dollars a barrel in 2010. This is a level that OPEC feels will not sabotage the economic recovery while at the same time stimulating new production. The global oil market is facing an oversupply with inventories still higher than the average for the last five years. Continued high oil consumption in emerging economies, led by Asia, has been more than compensated by increased crude production within and outside OPEC. We expect global demand to rise in the year ahead, though at a slower pace. The International Energy Agency (IEA) is predicting that global oil consumption will grow by 1.5% in 2011, in pace with the long-term growth trend. Our oil price projections of USD 78.50 for 2010 and USD 82 next year remain firm. Within Swedbank’s Total Commodity Price Index, the price index for food rose by 3.7% in dollar terms in August compared with the previous month. The biggest price gain was for grain, at nearly 25% in two months. In SEK, that figure was lower (14.5%) due to the krona’s appreciation against the dollar. Unfavourable weather conditions were the main reason for the increase in food prices. After this summer's wildfires, Russian wheat production is expected to shrink by a third in 2010. The risk of a new global food crisis is lower than in 2008. A fragile global economy and well-filled inventories reduce the risk of any major price increases. The export embargo of Russian wheat has contributed to greater uncertainty about food supplies, however. This was also the case with the
- 3. Energy & Commodities Monthly newsletter from Swedbank’s Economic Research Department, continued No. 8 • 17 September 2010 3 (4) global food crisis in 2007-2008, which probably accelerated the price increases. To ensure future food supplies, the easing of trading restrictions on foodstuffs will be extremely important. Economic worries are driving up the price of gold Gold is increasingly considered a safe alternative among financial investors. Several Asian central banks have also begun buy up gold to a great extent, partly in order to diversify their currency reserves. The price of gold has repeatedly broken new records in recent years. Higher gold demand is also driving up the prices of silver, probably to a lesser extent because industrial use of silver has increased. So far this year gold has risen by nearly 9% to USD 1 260 per ounce, while metal prices have fallen by 2%. Since the beginning of the 2000’s the price of gold has increased nearly five times over, faster than many of the world’s stock markets. Silver has also traded substantially higher during the same period after having mainly accelerated in the last two years. Gold and Silver in USD, Index 2000=100 Gold Silver Source: Reuters EcoWin 00 01 02 03 04 05 06 07 08 09 10 Index 50 100 150 200 250 300 350 400 450 500 2000=100 The continued rise in the price of gold indicates that the global economic recovery rests on shaky ground and that economic imbalances still remain. In addition to weaker growth signals in the US, there is great uncertainty about the fiscal situation in several European countries. During the summer and fall credit spreads in Greece, Ireland and Spain have risen to the levels of last spring. Against the backdrop of the underlying imbalances in the global economy and the risk of a double-dip recession, we feel it is likely that the price of gold could continue to rise in the short term. In a more long-term perspective, changing economic conditions could lead to a relatively fast shift to investments other than gold. Higher interest rates and a visible rise in the dollar would likely reduce interest in gold as a financial investment. Jörgen Kennemar
- 4. Energy & Commodities Monthly newsletter from Swedbank’s Economic Research Department, continued No. 8 • 17 September 2010 4 (4) Swedbank Commodity Index - US$ - Basis 2000 = 1oo 16-09-10 6.2010 7.2010 8.2010 Total index 259,9 264,8 270,0 Per cent change month ago -1,3 1,9 1,9 Per cent change year ago 14,8 22,3 13,6 Total index exclusive energy 239,2 256,3 265,6 Per cent change month ago -1,4 7,1 3,6 Per cent change year ago 31,2 38,6 32,5 Food, tropical beverages 212,4 225,8 234,1 Per cent change month ago 3,9 6,3 3,7 Per cent change year ago -0,7 11,5 10,9 Cereals 174,3 193,4 215,5 Per cent change month ago -3,6 11,0 11,4 Per cent change year ago -18,6 3,1 19,3 Tropical beverages and tobacco 235,1 249,0 253,6 Per cent change month ago 7,0 5,9 1,8 Per cent change year ago 15,6 21,0 14,5 Coffee 142,2 153,4 157,5 Per cent change month ago 10,9 7,9 2,7 Per cent change year ago 20,0 35,9 34,0 Oilseeds and oil 188,2 196,8 204,2 Per cent change month ago 0,7 4,6 3,8 Per cent change year ago -20,4 -4,0 -2,1 Industrial raw materials 247,0 265,1 274,7 Per cent change month ago -2,6 7,3 3,6 Per cent change year ago 42,5 47,5 39,1 Agricultural raw materials 163,4 166,8 170,7 Per cent change month ago -0,3 2,1 2,3 Per cent change year ago 40,0 36,1 29,8 Cotton 81,4 79,0 86,6 Per cent change month ago 0,0 -2,9 9,6 Per cent change year ago 51,0 33,4 47,8 Softwood 144,1 149,1 150,0 Per cent change month ago -0,6 3,5 0,6 Per cent change year ago 28,8 27,7 21,7 Woodpulp 969,4 978,6 976,6 Per cent change month ago 2,5 0,9 -0,2 Per cent change year ago 59,3 53,4 46,3 Non-ferrous metals 207,7 214,8 232,5 Per cent change month ago -6,6 3,4 8,2 Per cent change year ago 24,3 23,6 14,1 Copper 6498,7 6734,6 7283,2 Per cent change month ago -5,3 3,6 8,1 Per cent change year ago 29,6 29,1 17,8 Aluminium 1931,0 1987,8 2112,1 Per cent change month ago -5,6 2,9 6,3 Per cent change year ago 22,2 19,2 9,4 Lead 1703,4 1836,4 2071,8 Per cent change month ago -10,0 7,8 12,8 Per cent change year ago 1,7 9,4 8,5 Zinc 1742,5 1843,4 2042,6 Per cent change month ago -11,9 5,8 10,8 Per cent change year ago 11,9 16,8 12,2 Nickel 19382,7 19512,8 21370,0 Per cent change month ago -12,5 0,7 9,5 Per cent change year ago 29,3 22,1 8,8 Iron ore, steel scrap 571,5 658,0 659,3 Per cent change month ago 0,1 15,1 0,2 Per cent change year ago 70,4 92,1 89,3 Energy raw materials 269,0 268,6 271,9 Per cent change month ago -1,2 -0,2 1,2 Per cent change year ago 9,4 16,4 7,0 Coking coal 372,2 362,5 341,9 Per cent change month ago -1,4 -2,6 -5,7 Per cent change year ago 40,1 31,3 26,0 Crude oil 264,3 264,3 268,7 Per cent change month ago -1,2 0,0 1,7 Per cent change year ago 7,9 15,6 6,0 Source : SWEDBANK and HWWA-Institute for Economic Research Hamburg Swedbank Commodity Index - SKr - Basis 2000 = 1oo 16-09-10 6.2010 7.2010 8.2010 Total index 221,5 213,3 213,9 Per cent change month ago 0,6 -3,7 0,3 Per cent change year ago 16,0 18,0 15,8 Total index exclusive energy 203,9 206,4 210,4 Per cent change month ago 0,5 1,2 2,0 Per cent change year ago 32,5 33,8 35,1 Food, tropical beverages 181,0 181,8 185,5 Per cent change month ago 5,9 0,5 2,0 Per cent change year ago 0,3 7,6 13,1 Cereals 148,5 155,8 170,8 Per cent change month ago -1,7 4,9 9,6 Per cent change year ago -17,8 -0,5 21,7 Tropical beverages and tobacco 200,3 200,6 201,0 Per cent change month ago 9,0 0,1 0,2 Per cent change year ago 16,8 16,7 16,7 Coffee 121,2 123,6 124,8 Per cent change month ago 13,1 2,0 1,0 Per cent change year ago 21,2 31,1 36,7 Oilseeds and oil 160,4 158,5 161,8 Per cent change month ago 2,7 -1,2 2,1 Per cent change year ago -19,6 -7,4 -0,1 Industrial raw materials 210,5 213,5 217,6 Per cent change month ago -0,7 1,4 1,9 Per cent change year ago 44,0 42,3 41,8 Agricultural raw materials 139,2 134,3 135,3 Per cent change month ago 1,6 -3,5 0,7 Per cent change year ago 41,5 31,3 32,4 Cotton 69,4 63,6 68,6 Per cent change month ago 2,0 -8,3 7,8 Per cent change year ago 52,6 28,8 50,7 Softwood 122,8 120,1 118,9 Per cent change month ago 1,3 -2,2 -1,0 Per cent change year ago 30,1 23,2 24,0 Woodpulp 826,1 788,2 773,8 Per cent change month ago 4,5 -4,6 -1,8 Per cent change year ago 60,9 48,0 49,2 Non-ferrous metals 177,0 173,0 184,2 Per cent change month ago -4,8 -2,3 6,5 Per cent change year ago 25,6 19,2 16,4 Copper 5538,0 5424,3 5771,1 Per cent change month ago -3,5 -2,1 6,4 Per cent change year ago 30,9 24,6 20,2 Aluminium 1645,5 1601,0 1673,6 Per cent change month ago -3,7 -2,7 4,5 Per cent change year ago 23,4 15,0 11,5 Lead 1451,6 1479,1 1641,7 Per cent change month ago -8,3 1,9 11,0 Per cent change year ago 2,7 5,6 10,6 Zinc 1484,9 1484,7 1618,5 Per cent change month ago -10,2 0,0 9,0 Per cent change year ago 13,1 12,7 14,4 Nickel 16517,4 15716,3 16933,4 Per cent change month ago -10,8 -4,9 7,7 Per cent change year ago 30,7 17,8 11,0 Iron ore, steel scrap 487,0 530,0 522,4 Per cent change month ago 2,1 8,8 -1,4 Per cent change year ago 72,2 85,4 93,0 Energy raw materials 229,2 216,3 215,5 Per cent change month ago 0,7 -5,6 -0,4 Per cent change year ago 10,6 12,3 9,1 Coking coal 317,2 292,0 270,9 Per cent change month ago 0,5 -7,9 -7,2 Per cent change year ago 41,5 26,7 28,4 Crude oil 225,2 212,9 212,9 Per cent change month ago 0,7 -5,5 0,0 Per cent change year ago 9,0 11,6 8,1 Source : SWEDBANK and HWWA-Institute for Economic Research Hamburg Swedbank Economic Research Department SE-105 34 Stockholm, Sweden Phone +46-8-5859 7740 ek.sekr@swedbank.se www.swedbank.se Legally responsible publisher Cecilia Hermansson, +46-88-5859 7720 Magnus Alvesson, +46-8-5859 3341 Jörgen Kennemar, +46-8-5859 7730 Swedbank’s monthly Energy & Commodities newsletter is published as a service to our customers. We believe that we have used reliable sources and methods in the preparation of the analyses reported in this publication. However, we cannot guarantee the accuracy or completeness of the report and cannot be held responsible for any error or omission in the underlying material or its use. Readers are encouraged to base any (investment) decisions on other material as well. Neither Swedbank nor its employees may be held responsible for losses or damages, direct or indirect, owing to any errors or omissions in Swedbank’s monthly Energy & Commodities newsletter.