SlideShare a Scribd company logo
1 of 16
Download to read offline
WETLAND MONITORING IN
SNAKE VALLEY
May 2014Volume 46, Number 2
U T A H G E O L O G I C A L S U R V E Y
SURVEY NOTES
State of Utah
	 Gary R. Herbert, Governor
Department of Natural Resources
	 Michael Styler, Executive Director
UGS Board
	 Mark Bunnell, Chair	
William Loughlin, Tom Tripp, 	
Sunny Dent, Kenneth Puchlik, 	
Marc Eckels, Pete Kilbourne,
	 Kevin Carter (Trust Lands Administration-ex officio)
UGS Staff
Administration
	 Richard G. Allis, Director
	 Kimm Harty, Deputy Director
	 Starr Soliz, Secretary/Receptionist
Dianne Davis, Administrative Secretary
	 Jodi Patterson, Financial Manager
	 Linda Bennett, Accounting Technician
	 Michael Hylland, Technical Reviewer
	 Robert Ressetar, Technical Reviewer
Editorial Staff Vicky Clarke
	 Lori Steadman, Jay Hill, Nikki Simon, 	
Elizabeth Firmage
Geologic Hazards Steve Bowman
	 Richard Giraud, William Lund, Greg McDonald, 	
Jessica Castleton, Gregg Beukelman, Chris DuRoss, 	
Tyler Knudsen, Corey Unger, Adam McKean, 	
Ben Erickson, Pam Perri, Adam Hiscock
Geologic Information and Outreach Sandra Eldredge 	
Christine Wilkerson, Patricia Stokes, Mark Milligan,
Lance Weaver, Gentry Hammerschmid, Jim Davis,
Marshall Robinson, Bryan Butler, Robyn Keeling
Geologic Mapping Grant Willis
	 Jon King, Douglas Sprinkel, Kent Brown, Basia Matyjasik,
Donald Clark, Bob Biek, Paul Kuehne, Zach Anderson
Energy and Minerals David Tabet
	 Robert Blackett, Craig Morgan, Jeff Quick, Taylor Boden, 	
Thomas Chidsey, Cheryl Gustin, Tom Dempster, 	
Brigitte Hucka, Stephanie Carney, Ken Krahulec, 	
Brad Wolverton, Mike Vanden Berg, Andrew Rupke, 	
Mark Gwynn, Christian Hardwick, 	
Peter Nielsen, Hobie Willis, Rebekah Wood
Groundwater and Paleontology Mike Lowe
	 James Kirkland, Janae Wallace, Martha Hayden, 	
Hugh Hurlow, Don DeBlieux, Kim Nay, 	
Paul Inkenbrandt, Lucy Jordan, Kevin Thomas, 	
Walid Sabbah, Rich Emerson, Stefan Kirby, 	
Scott Madsen, Jennifer Jones, Diane Menuz, 	
Ryhan Sempler, Nathan Payne
Survey Notes is published three times yearly by Utah Geological Survey, 1594 W. North Temple, Suite 3110, Salt Lake City, Utah 84116; (801) 537-3300. The Utah Geological Survey provides timely
scientific information about Utah’s geologic environment, resources, and hazards. The UGS is a division of the Department of Natural Resources. Single copies of Survey Notes are distributed free
of charge within the United States and reproduction is encouraged with recognition of source. Copies are available at geology.utah.gov/surveynotes. ISSN 1061-7930
Contents
Wetland Monitoring in Snake Valley........................1
UGS Groundwater & Spring Flow Monitoring
in Snake Valley................................................. 4
When Sharks, Rays & Sawfish Ruled
Utah’s Rivers..................................................6
Energy News.........................................................8
GeoSights.............................................................10
Glad You Asked....................................................12
New Publications.................................................13
Survey News.........................................Back Cover
Design: Elizabeth Firmage
Cover: Springhead and associated wet meadow at an
unnamed cluster of springs north of Big Springs in southern
Snake Valley. Photo by Jennifer Jones.
The 2014 legislative ses-
sion has just ended, and
it included an important
building block of ongo-
ing general funds for the
Utah Geological Survey.
Our original source of
funding for monitoring
and maintaining ground-
water wells in Snake Val-
ley of Utah’s west desert,
as well as preserving the
data and serving it to the public on
our website, had dried up. The build-
ing block constitutes replacement
funding that is essential for sustain-
ing the valuable time series of hourly
water-level and spring-flow changes
that have now been collected for at
leastsixyears(seearticlebyHurlowand
Jordan, page 4; also, the article by
Menuz and others, page 1, discusses
wetlandsresearchbeingdoneinSnake
Valley). The groundwater network
includes 67 newly drilled wells, 11
previously drilled wells, and surface-
flow gauges at six springs. Monitoring
shows that in southern Snake Valley
there are significant irrigation effects
having an annual cycle, as well as
effects from longer term groundwater
pumping and variations in precipita-
tion (and consequently recharge) to
the groundwater. However, farther
north and at greater distance from the
main recharge source assumed to be
in the Snake Range, these precipita-
tion signals are much attenuated.
Modeling of the impacts
of large-scale ground-
water extraction by the
Southern Nevada Water
Authority (SNWA) for a
water rights hearing sev-
eral years ago consisted
of a relatively simple
model, and showed many
tens of feet of drawdown
over decades in southern
Snake Valley. The UGS
monitoring program now provides
sufficient data for a more accurate and
detailed model that can be calibrated
against ongoing irrigation effects and
natural recharge changes. The value
of this continuous dataset steadily
increases with time, and will allow Utah
to more quantitatively predict future
effects if SNWA decides to continue
its plan for large-scale extraction of
groundwater in southern Snake Valley.
Later this year, the UGS anticipates
publishing a compilation of scien-
tific findings from its studies in Snake
Valley as a result of the groundwater
monitoring program. This will be a
Bulletin (Hydrogeologic Studies and
Groundwater Monitoring in Snake
Valley and Adjacent Hydrographic
Areas, West-Central Utah and East-
Central Nevada, compiled by Hugh
A. Hurlow) containing 10 chapters and
over 100 illustrations. Like the water-
level data that are now accumulating,
this Bulletin will be valuable for pro-
tecting Utah’s groundwater resource
in Snake Valley.
The Director’s Perspective
by Richard G. Allis
Richard Kennedy, former UGS Board
member (1993–2001) and university
professor, passed away on February
9, 2014, in Henderson, Nevada. He
was 84 years old. Dr. Kennedy had
a distinguished teaching career and
was recognized as the “Outstanding
Science Educator” by the State of Utah
Former UGS Board Member
Richard Kennedy Passes Away
in 1994. He was a
certified gemologist
and appraiser and
consulted in geology
and mining for several companies.
According to his family, he was
“involved in his love of the wonders of
geology throughout his life.”
Although wetlands make up only one percent of Utah’s
landscape, they provide a large number of important benefits,
including water quality enhancement, flood abatement, and
critical habitat for a rich diversity of birds, frogs, and other
animal species. In addition to these often indirect economic
benefits, wetlands also generate revenue from hunting and
bird watching opportunities, and by serving as pasture or
watering grounds for livestock. Wetlands include everything
from predominantly dry and barren saline playas to wet
meadows at the edge of springs and cattail marshes filled
with nesting birds. Water is the common factor that unites
these systems; all wetlands experience periods where water
levels are at or above the surface of the soil. Saturation limits
oxygen availability in the soil so that only plants with special
adaptations can grow in the flooded, low-oxygen conditions.
The Utah Geological Survey (UGS) is developing a field
method to evaluate the condition of wetlands in the state using
a variety of plant, hydrologic, soil, and landscape data. The
method is intended to be used by a variety of practitioners,
including restoration specialists, land managers, researchers,
and private consultants, and will allow for comparison
by Diane Menuz, Jennifer Jones, Ryhan Sempler, and Richard Emerson
Wetland Monitoring
in Snake Valley, Utah
Developing a Method to Understand Wetland Condition
between similar wetland types as well as documenting change
at a site over time. Development of a Utah-specific condition
assessment method will make it easier to support management
decisions and effective conservation efforts at the state scale.
One of the focal areas for initial method development is Snake
Valley, home to numerous spring-fed wetlands in Utah’s west
desert. The water in Snake Valley is predominantly used
locally for growing alfalfa and hay and enhancing habitat for
livestock and wildlife. Increasing concerns about additional
groundwater-development pressures have been the impetus
for numerous recent hydrogeology, groundwater, and wildlife
resource studies in the region (see article by Hurlow and
Jordan in this issue of Survey Notes). Adequate water to
supply the valley’s wetlands is important to provide habitat
for snail species found nowhere else on earth and wildlife
species having limited habitat range (least chub and Columbia
spotted frog), as well as to allow the ranching way of life
to continue as it has for over 100 years. Obtaining data on
current conditions of wetlands in Snake Valley and their
associated water regimes is paramount to addressing and
mitigating potential changes from current and future threats.
Utah Geological Survey researcher Ryhan Sempler
collects water quality data at Clay Springs in Snake
Valley while curious horses look on. In addition to
supporting domestic and wild horses, wetlands in
Snake Valley are home to two habitat-restricted
species of concern, least chub and Columbia
spotted frog, and over 20 species of snail found
nowhere else in the world.
,
MAY 2014  1
Wetland condition is evaluated through examination of a
site’s hydrology, plant community, soil, and surrounding
landscape and comparing the status to that of natural, un-
disturbed sites. Some information on wetland condition is
readily apparent during brief site visits. For example, it may
be easy to detect whether the hydrology has been manipulated
to create unnatural flow patterns or whether a site has been
overgrazed to the point where the soil is compacted and
completely bare. Other indicators require substantially more
time and expertise to be useful. Plant species can be powerful
indicators of recent and current conditions, but using plant
data to determine condition generally requires more field time
during surveys, specialized knowledge to properly identify
species, and an understanding of how different species
respond to disturbance.
The UGS began testing wetland condition assessment
methods in 2010. Six out of the seven surveyed sites were
in northern Snake Valley because these sites provide most
of the critical wildlife habitat in the region. The sites were
generally found to be in excellent condition, with only a
few sites having any elements that were regarded as very
disturbed. While it was important to note the relative health
of the surveyed wetlands, the lack of variability in survey
results hampered development of field protocols. Additional
surveys were conducted in summer 2013 to expand the
range of conditions captured (see map in article by Hurlow
and Jordan in this issue of Survey Notes). We surveyed a
total of 18 sites, including 8 sites in northern and 10 sites in
southern Snake Valley. Common stressors near sites included
overgrazed vegetation and soil trampling, altered hydrology
due to ditching, and heavy algae formation (which sometimes
indicates issues with water quality). Cover of non-native plant
species and native species known to be invasive was generally
low, indicating overall good site condition. A final method for
assessing wetland condition in Utah and final scores for each
site in Snake Valley are currently being developed and should
be available by the end of the year.
In addition to field surveys, the UGS has been collecting and
managing data from 80 shallow wetland wells, or piezometers,
that provide hourly water-level data. Sixty wells 5 to 10
feet deep were installed between October 2009 and March
2010 by the UGS and a Utah Division of Wildlife Resources
(DWR) consultant, and an additional 20 wells were added in
2012 and 2013 by the DWR and UGS. Data from all wells
are now downloaded biannually and managed by the UGS
(http://geology.utah.gov/databases/groundwater/projects.
php). Well data will allow us to determine the relationship
between the timing and duration of flooding and associated
plant species. We can also use the data to map water levels
across wetlands, allowing us to better understand critical
relationships between water levels, vegetation, and sensitive
animal species. Together, this information helps us identify
wetland areas that are vulnerable to changes and anticipate
how those changes may affect the plants and animals that
depend on them.
-140
-120
-100
-80
-60
-40
-20
0
20
40
60
80
10-09
12-09
2-10
4-10
6-10
8-10
10-10
12-10
2-11
4-11
6-11
8-11
10-11
12-11
2-12
4-12
6-12
8-12
10-12
DepthtoWater(cm)
Date (Water Years 2010 to 2012)
Regime 1 Regime 2 Regime 3 Regime 4 Regime 5
The most common disturbances seen at wetland
study sites included soil disturbance from grazing
(left) and manipulation of hydrology to create
or enhance pasture (above). Other important
disturbances, notably changes in groundwater
levels, are not easy to detect during field surveys
but will be monitored through a network of
shallow wetland and deep groundwater wells.
Five water regimes, or patterns of the timing and duration of flooding,
observed in wetlands in Snake Valley based on data from wetland
wells. Plant species are closely associated with each regime, with, for
example, bulrush and other species adapted to extreme inundation
found in regime 1 and saltgrass dominant in the drier regimes 4 and
5. Understanding the relationship between plant species and water
regimes allows predictions of expected vegetation changes with
changes in water levels in the area.
2  SURVEY NOTES
Utah Geological Survey researchers Rich Emerson
and Diane Menuz download data from an automatic
recording probe in a shallow wetland well on the edge
of Pruess Lake in southern Snake Valley. Water level data
are recorded every hour year-round and can be used to
determine natural seasonal and annual fluctuations and
responsiveness to groundwater manipulations.
Data collected by the Utah Geological Survey
researchers on water quality, soil composition, plant
community, and stressors present can be used to
determine how close this wetland is to a natural,
undisturbed state.
Diane Menuz joined the
UGS in 2013 as the Assistant
State Wetland Coordinator.
Her work focuses on devel-
oping the wetland condition
assessment method for the
state and implementing asso-
ciated fieldwork. Prior to join-
ing the UGS, Diane worked
on projects modeling flow in
Wisconsin streams, modeling
the distribution of invasive
riparian plant species in the
Columbia River Basin, and
conducting rare plant surveys in southern California.
Ryhan Sempler
was hired by the UGS
in 2013 as a Wetland
Specialist Technician.
He is helping devel-
op the wetland con-
dition assessment
method specific to
Utah wetlands, and
is involved with mod-
eling surface water
flow paths around Great Salt Lake. Before moving to Utah,
Ryhan worked on habitat management projects for the New
York State Bureau of Wildlife, helped study zoonotic diseases
in Montana, and worked on various other wildlife research
projects throughout the country.
Rich Emerson is a geolo-
gist in the UGS Groundwater
and Paleontology Program,
where he has worked since
2007. His work focuses on geo-
graphic information system
(GIS) analysis, remote sensing,
wetland mapping, and collec-
tion and analysis of shallow-
groundwater data throughout
the state.
JenniferJoneshas been
the State Wetland Coordina-
tor since 2012, leading various
projects for the UGS Wetland
Section that target a variety of
wetland needs for the state. 
In addition to coordinating
development of the condition
assessment tool for Utah wet-
lands, she facilitates collabora-
tion among other state, local,
and interest groups to devel-
op wetland program planning
that serves the broader group
of wetland scientists in the state.  Before coming to Utah, Jen-
nifer worked in wetlands in the western U.S. for eight years on
projects in the Southern Rockies of Colorado and the Sierra
Nevada.
AuthorsAboutthe
MAY 2014  3
In March 2007 the Utah State Legislature requested the UGS to
establish a groundwater-monitoring network in Snake Valley and
adjacent areas, in response to concerns over potential drawdown
of the water table and reduced spring flow from proposed large-
by Hugh Hurlow and Lucy Jordan
")
")
")
")
")
")
")
")
")
")
")
")
")
")
")
")
")
")
")
")
")
")
XW
XW
^_
^_
^_
^_
^_
^_^_^_
^_^_
^_
^_
^_
^_
^_
^_
^_
^_
!.
!.
!.
!.
!.
!.
!.
!.
!.
!.
!. "/
&-
&-
&-
&-
&-
&-
&-
&-
&-
&-
&-
"/
"/
"/
&,
&,
&,
&-
#*
"/
"/
&-
#*
&,
&-
"/
XW
XW
XW
XW
XW
XW
"
"
"
"
"
"
A
A
A
A
A
A
A
A
AA
AA
A
A
A
A
A
A
A
A
A
A
A
A
A
AA
21
19
7
20
1
2
10
17
5
6
8
4
25
23
15
13
14
9
3
26
22
12
11
16
18
27
SPRING
VALLEY
HELL
EEK
NGE
DEEP
CREEK
RANGE
KERN
MTS
NORTHERN
SNAKE
RANGE
SOUTHERN
SNAKE
RANGE
SNAKE
VALLEY
BURBANK
HILLS
MOUNTAIN
HOME
CONFUSION
RANGE
HOUSE
RANGE
FISH
SPRINGS
RANGE FISH
SPRINGS
FLAT
TULE
VALLEY
GREAT SALT
LAKE DESERT
Callao
Baker
£¤50
!(21
Sevier
Lake
Miller
Spring
Foote
Spring
Twin
Springs
Leland
Harris
Springs
Coyote
Spring
Kell
Spring
Dearden
Springs
Clay Spring
Middle
Spring
North
S rin
Gandy
Warm
Springs
Big
Springs
Needle
Point
Spring
Granite Creek
Trout Creek
Salt Marsh
Lake Springs
Salt
Marsh
Lake
Snake Creek
Baker
eve
Creek
Creek
Eskdale
Gandy
Fish
Springs
Pruess Lake
Garrison
North
Spring
Fish
Springs
National
Wildlife
Refuge
Great
Basin
National
Park
NEVADA
UTAH
WHITE PINE CO.
LINCOLN CO.
JUAB CO.
MILLARD CO.
TOOELE CO.
JUAB CO.
32
24
31
28
30
29
43
40
3738
36
39
35
42
34
41
33
113.5° W
113.5° W
114° W
114° W
39.5° N 39.5° N
39° N 39° N
Projection: Transverse Mercator, central meridian 114° W.
Base map derived from USGS Digital Elevation Models and
1:250,000 scale topographic maps.
5 0 5 10
Miles
5 0 5 10 15 20
Kilometers
µ Study Area
Location
NEVADA
UTAH
^_
UGS Groundwater-Monitoring Network
Numeric label is UGS site number
Monitor wells in volcanic-rock aquifer&-
Monitor wells in basin-fill and carbonate-rock aquifers&-
Monitor wells in carbonate-rock aquifer&-
New Wells and Gages (2007-2009)
Monitor wells in Cambrian-Neoproterozoic
siliciclastic confining unit
&-
Aquifer-Test Sites
Nested piezometers near spring"/
Agricultural area monitor wells&,
Monitor wells in basin-fill aquifer&-
#*
Carbonate-rock and basin-fill aquifers
Carbonate-rock aquifer
#*
UGS spring-flow gage siteXW
Other Groundwater Monitoring Sites
UGS transducer in previously existing well!.
Other Features
Hydrographic Area boundary
Perennial Stream
USGS spring-flow gage siteXW
SNWA point of diversion")
SpringA
Bishop
Springs
area
Lake
Creek
Big
Springs
Creek
Area discussed in groundwater monitoring article
Wetlands Assessment Locations, 2013
UGS GROUNDWATER & SPRING FLOW
MONITORING IN SNAKE VALLEY
scale groundwater development projects in east-central Nevada and
west-central Utah. The UGS groundwater-monitoring network was
completed in spring 2009, and includes 67 newly constructed wells,
11 previously existing wells, and surface-flow gages at six springs.
The objectives of the UGS ground-
water-monitoring network are to (1)
determine baseline temporal and
spatial groundwater-level and chemi-
cal trends, (2) establish groundwa-
ter monitoring near the planned
pumping wells and areas of current
groundwater use to assess their
impacts on groundwater resources,
(3) monitor discharge from selected
springs that host environmentally
sensitive aquatic species, (4) con-
duct aquifer tests to measure the
hydraulic properties of, and hydraulic
connectivity between, the basin-fill
and carbonate-rock aquifers, and (5)
evaluate groundwater-flow systems
within Snake Valley and from Snake
Valley to Fish Springs National Wild-
life Refuge.
This article focuses on our pre-
liminary findings from monitoring
groundwater levels and spring flow.
The UGS monitoring wells have five
to seven years of high-frequency
(hourly) data. The U.S. Geological
Survey (USGS) has collected water-
level data annually for some of these
wells for at least 30 years, providing
a long-term context. Groundwater-
level trends can be compared to
precipitation data from the Great
Basin National Park climate station,
in a principal area of groundwater re-
charge for the Snake Valley basin-fill
and carbonate-rock aquifers.
Near the Eskdale agricultural area
in southern Snake Valley, data from
UGS sites 9 and 36 show that ground-
water levels vary seasonally due to
local pumping for crop irrigation, and
4  SURVEY NOTES
continued on page 9
that this cyclical variation is superposed on a trend of steadily declin-
ing groundwater levels of 3.1 to 3.5 inches per year in the basin-fill and
bedrock aquifers from 2007 to 2013. Long-term data from the USGS
show that groundwater levels in the basin-fill aquifer have declined by
about 4.2 inches per year since 1987. Data from UGS site 6, seven
miles northeast of Eskdale, may help distinguish groundwater-level
trends related to climate from those related to pumping. Groundwater
levels at site 6 lack the cyclical fluctuations characteristic of ground-
water pumping, so long-term groundwater-level trends here likely show
little or no effect from pumping and result primarily from overall de-
creased annual precipitation after a period of far greater-than-normal
precipitation (and, presumably, recharge to the aquifers) during the
early 1980s. Groundwater levels at site 6 have declined by 2.2 inches
per year since 1989, which can be interpreted as the long-term cli-
matic signal in the Eskdale area. Groundwater pumping, therefore,
may account for at least 1 inch per year of the decline at sites 9 and
36 observed in the UGS data, and for about 2 inches per year of the
decline observed in the long-term data.
Groundwater levels in UGS monitor wells near other agricultural sites
in Snake Valley also respond cyclically due to groundwater pumping,
and show similar or greater rates of long-term decline. Groundwater
levels in wells far from current agricultural pumping have declined
at substantially lower rates than those near agricultural areas.
Collectively the data show that in Snake Valley agricultural areas,
groundwater is currently being withdrawn at rates slightly greater than
it can flow to the discharge areas. Proposed large-scale groundwater-
development projects would greatly expand the area and magnitude
of groundwater withdrawal and discharge capture, resulting in lower
groundwater levels and reduced spring flow throughout southern and
central Snake Valley.
Snake Valley has numerous springs that support agriculture and
provide habitat for environmentally sensitive species. At the Bishop
Springs area in east-central Snake Valley, the average discharge from
Foote Reservoir Spring is 5.9 ± 0.1 acre-feet per day. Utah Division of
Wildlife personnel removed Russian olive (Eleagnus angustifolia) trees
around the reservoir and outlet stream in early 2012. Prior to tree re-
moval, the spring discharge shows a slight downward trend, whereas
the discharge after the trees were removed trends up. Non-native Rus-
sian olive and saltcedar trees have been implicated in increased wa-
ter loss from riparian systems through evapotranspiration in the West
since the 1980s. Our data suggest more water is flowing in the stream
channel since the removal of the trees. If verified, this result could
provide an approach for the Division of Wildlife Resources to preserve
in-stream flow that provides habitat for several aquatic species of con-
cern in west desert spring-fed wetlands, in support of a conservation
agreement that decreases the likelihood that the species will be listed
by the U.S. Fish and Wildlife Service as threatened.
In the southern part of the Snake Valley hydrographic area, flow from
Dearden Springs supports much of the in-stream flow and shallow
groundwater (i.e., underflow) in Lake Creek, which extends from the
springs 9 miles downstream to Pruess Lake. The Dearden Springs–
Lake Creek reach, together with the upstream Big Springs–Big Springs
Creek reach in Nevada, forms a 17-mile-long surface water-groundwa-
ter system, the largest and most continuous in Snake Valley. The creek
and associated wet meadows are used for grazing and provide wildlife
Groundwater levels near and north of Eskdale from UGS data. Site 6 shows
little or no effects of groundwater pumping, and a gradual decline of ground-
water levels of about 2.4 inches per year. Sites 9 and 36 show seasonal
variations in groundwater levels resulting from groundwater pumping, su-
perposed on a gradual decline of about 3.1 to 3.5 inches per year.
Long-term groundwater levels near and north of Eskdale, and annual pre-
cipitation at Great Basin National Park. The decline at site 6 may result pri-
marily from decreased annual precipitation after the mid-1980s, whereas
the greater rate of decline at site 36 may represent the combined effects of
groundwater pumping and decreased precipitation.
Site 6 (7 miles NNE of Eskdale)
4887
4892
4897
WaterLevelElevation(ftamsl)
Slope: -2.2 in/yr (R = 0.92)
2
Slope: -2.6 in/yr (R = 0.97)
2
Screen Depths & Hydrogeologic Units
PW06MX - 77-97 Basin-fill aquifer
PW06A - 150-170 Basin-fill aquifer
PW06B - 315-335 Basin-fill aquifer
PW06C - 370-390 Lower Paleozoic carbonate-rock aquifer
PW06D - 533-553 Lower Paleozoic carbonate-rock aquifer
Groundwater levels near and north of Eskdale from UGS data. Site 6 shows little or no effects of
groundwater pumping, and a gradual decline of groundwater levels of about 2.4 inches per year.
Sites 9 and 36 show seasonal variations in groundwater levels resulting from groundwater pumping,
superposed on a gradual decline of about 3.1 to 3.5 inches per year.
10/01/07 09/30/08 09/30/09
Date
09/30/10 09/30/11 09/29/13
4945
4950
WaterLevelElevation(ftamsl)
10/01/06
4970
4965
4955
Site 36 (1 mile E of Eskdale)
09/29/12
Screen Depths & Hydrogeologic Units
Eskdale MX - 77-97 Basin-fill aquifer
PW09A - 245-265 Lower Paleozoic carbonate-rock aquifer
PW09B - 700-720 Lower Paleozoic carbonate-rock aquifer
Slope: -3.1 in/yr (R = 0.55)
2
Slope: -3.1 in/yr (R = 0.66)
2
Slope: -3.5 in/yr (R = 0.69)
2
UGS DATA
Site 9 (1.4 miles E of Eskdale)
4900
4898
4896
4894
4892
4890
WaterLevelElevation(ftamsl)
1981
1983
1985
1987
1989
1991
1993
1995
1997
1999
2001
2003
2005
2007
2009
2011
4976
4974
4972
4970
4968
4966
13
CumulativeDeparturefrom
AveragePrecipitation(in)
8
3
-2
-7
Year
USGS DATA
Site 6 (7 miles NNE of Eskdale)
Site 36 (1 mile E of Eskdale)
PW06MX
Eskdale MX
Great Basin National Park
annual precipitation
Slope: -4.2 in/yr (R = 0.98)
2
Slope: -2.2 in/yr (R = 0.96)
2
Long-term groundwater levels near and north of Eskdale, and annual
precipitation at Great Basin National Park. The decline at site 6 may result
primarily from decreased annual precipitation after the mid-1980s,
whereas the greater rate of decline at site 36 may represent the combined
effects of groundwater pumping and decreased precipitation.
Snake Valley surface-flow and water-level data,
lithologic and geophysical logs, and well-construction
information can be accessed through the UGS web-based
groundwater-data server at <http://geology.utah.gov/
databases/groundwater/map.php?proj_id=1>.
MAY 2014  5
The recently published 637-page tome, At the Top of the Grand
Staircase: The Late Cretaceous of Southern Utah (Indiana
University Press: edited by Alan Titus and Mark Loewen) is filled
with papers summarizing the geological and paleontological
research on these rocks since the 1996 establishment of Grand
Staircase–Escalante National Monument (GSENM). While I
am a coauthor on several papers in this volume relating to new
dinosaur discoveries, I also took the opportunity to finally publish
my research on Utah’s freshwater elasmobranches (sharks and
rays) that I had begun as a graduate student 35 years ago. This
Survey Notes article briefly summarizes the results of this research.
The first extensive research on the vertebrate fossils in southern
Utah was not on the dinosaurs, but was in the quest for the tiny
fossil mammals that had lived in the shadow of the dinosaurs.
The process of recovering these fossils involves breaking down
fossiliferous rock by gently washing the rock, preferably soft
shales, mudstones, or poorly consolidated sandstones, through
fine screens and picking out the small identifiable bones and teeth
from the residues under a microscope. In this way, collections
of the entire fauna can be made—not just the mammals, but the
fish, salamanders, frogs, lizards, turtles, crocodiles, and even
dinosaur teeth. This research, begun during the early 1980s,
revealed not only that southern Utah preserved the most complete
record of Late Cretaceous life on land, but that throughout the
Cretaceous, Utah’s rivers hosted a variety of freshwater sharks
and rays. As an aspiring young paleontologist, I was assigned the
job of researching these teeth, as the “more interesting” groups of
animals were already spoken for by more established scientists.
As with the Cretaceous mammals, isolated teeth from the sharks
and rays are useful for identifying species, and I realized that
these collections contained new species that documented the
entire evolutionary history for several lineages of freshwater
elasmobranches. Unfortunately, the taxonomy of these fish was a
mess, and it took many years of research to get a handle on this
group of slippery organisms.
Today, most people would not expect to
catch a shark or ray while fishing in one of
North America’s rivers. However, in the tropics
and in the southern hemisphere, freshwater sharks
and rays are characteristic of many large river systems. The
Fitzroy River in eastern Australia, for example, includes a variety
of sharks, sawfish, and stingrays and can be thought of as a
modern analogue for the Late
Cretaceous rivers of southern
Utah. A comparable diversity of
freshwater elasmobranches is found to
have been living in Utah’s rivers throughout the last 30
million years of the Cretaceous.
Hybodonts are an extinct group of sharks that were the dominant
sharks for much of the Mesozoic Era following the near-extinction
of sharks at the end of the Paleozoic Era. They are characterized
by dorsal fin spines and small spines on their heads. There are
two lineages of hybodont sharks. Hybodus is a moderately large
species with a maximum length of 3 meters (10 ft), with teeth well
adapted to grabbing fish. This is the only spined shark found in
these rocks that was just as much at home in the ocean as it was
in Utah’s rivers. Lonchidion is a smaller shark, usually less than 1
meter (3 ft) long, with long, low blade-like teeth better adapted to
cutting up soft-prey animals.
Among the more advanced sharks, or neoselachians, were a
number of orectoloboid species that probably can be divided into
two evolutionary lineages. Orectoloboid sharks are represented
today by the nurse, carpet, and cat sharks. They seem to have
entered into the Cretaceous river systems from an ancestry of
shallow coastal sharks about 90 million years ago.
They were small sharks less than 1 meter (2 ft)
long with a mouth packed with tiny 1–2
millimeter (0.1 in) teeth useful for grasping
and shredding small prey. One lineage,
Cantioscyllium, was characterized by teeth
whose primary cusp is ridged and there are lateral cusps. Through
time, species of Cantioscyllium have progressively subdued the
ridges on their teeth. The other lineage has been referred to the
modern cat shark Chiloscyllium and is characterized by teeth
lacking lateral cusps, and whose primary cusp may have shoulders
that are incipiently serrated. Because the taxonomy of the modern
cat sharks is complicated, with few differences in the teeth among
the modern species, the assignment of these Cretaceous species
to Chiloscyllium is tentative and based primarily on the taxonomy
of other authors. The Upper Cretaceous of western North
America represents the only time and place
that this group of sharks is documented
to have populated freshwater
environments.
by James Kirkland
whensharks,rays,
ruled Utah’s riverssawfish &
Myledaphus bipartitus
Lonchidion sp.
6  SURVEY NOTES
The bottom-dwelling rays have repeatedly invaded fresh-
water habitats throughout geological history since their origins
in the Jurassic. The genus Myledaphus (“mill stone of the earth”),
first recognized in the 1870s, reached the relatively large size of
around 3 meters (10 ft) long prior to their extinction at the end
of the Cretaceous. Initially, the large grinding teeth of this ray
were thought to be the teeth of a large stingray. However, the
discovery of a Myledaphus mummy at Dinosaur Provincial Park in
Alberta, reported in 2005, proved that these were not freshwater
stingrays, but a specialized group of the more primitive guitarfish.
The abundance of fossil teeth from Utah document a lineage of
primitive rays linked by having crushing teeth with a distinct mid-
line crest. They originated more than 100 million years ago at the
end of the Early Cretaceous with small species (Cristomylus) that
got progressively larger and developed more efficiently packed
teeth (Pseudomyledaphus) with more complex grinding surfaces
(Myledaphus) through the Late Cretaceous.
The last group is represented by two lineages of extinct
Scelerorhynchiform sawfish. While looking superficially like
modern sawfish, differences in the skulls and pectoral
fins indicate that this group originated from guitarfish in
the Early Cretaceous. They reached a greater diversity than
modern sawfish and included very large species, prior to their
extinction at the end of the Cretaceous. Modern sawfish (pristids)
do not appear until the Eocene, about 45 million years ago.
The most common Utah species are found throughout the Upper
Cretaceous and have small teeth on their saw (or rostrum) and
ridged, diamond-shaped teeth in their mouths. We assigned
these species to the ptychotygonid Texatrygon, which appears
to be related to Lebanopristis and Micropristis, which are known
from complete specimens in the Middle East. Another taxon, the
scelerorhychid Columbusia, is only known from its oral teeth and
may have had a toothless rostrum more like that of a swordfish.
These fish used their rostrums to grub for invertebrates in the
sediment and to slash at small fish in more open water.
After being so characteristic of Utah’s Cretaceous river systems,
all of these lines of freshwater elasmobranches went extinct
with the dinosaurs at the end of the Cretaceous. Perhaps the
continued success of the bony fish was a result of their much
higher reproductive rates.
Hybodus sp.
The illustrations are recreations of some of the
freshwater sharks and rays characteristic of Utah’s Late
Cretaceous river systems, by Russell Hawley.
Texatrygon avonicola
Cretaceous Fossil Teeth From Utah
MAY 2014  7
Over the past decade shale-gas plays in Texas, Arkansas,
Louisiana, Oklahoma, and the northern Appalachian states
have been the sites of extensive drilling programs using
horizontal drilling and new hydraulic fracturing (or “fracking”)
techniques (see related 2012 Survey Notes article, v. 44, no.
2, p. 8–9). Shale, a fine-grained sedimentary rock composed
mainly of clay or mud, contains numerous pores (open spaces)
that are very small but can store significant quantities of
gas (or oil), thus serving as a hydrocarbon reservoir. The
permeability (the connectivity of those pores that allows gas
or liquids to flow) of shale is extremely low unless natural
fracture systems are present. Horizontal wells are directed to
encounter multiple natural fractures over thousands of feet,
and fracking significantly increases the number of fractures
and their permeability. The result of this drilling activity has
been the discovery of an estimated 129 trillion cubic feet (tcf)
of commercial, recoverable gas from shale in these established
plays. Although Utah produces 0.4 tcf of natural gas per year,
and has proven reserves of 7.0 tcf, all of this is in conventional
(i.e., non-shale) reservoirs.
For the past four years, the Utah Geological Survey (UGS)
has been conducting a major study of potential Paleozoic-
age shale-gas plays in Utah, specifically the Mississippian
Manning Canyon Shale in central Utah and the Pennsylvanian
Paradox Formation in southeastern Utah (see related 2011
Survey Notes article, v. 43, no. 2, p. 3–5). These approximately
300-million-year-old shale beds are widespread, thick, organic
rich, naturally fractured, and buried deep enough in many
areas to generate, store, and produce natural gas and oil.
The study was funded in part by the Research Partnership to
Secure Energy for America (RPSEA) and represents the work
of UGS staff, outside geologic consultants and engineers
having expertise specifically with shale reservoirs, and various
petroleum service companies and labs. The objectives of
the study were to (1) identify and map the major trends for
target shale intervals and identify areas having the greatest
gas potential, (2) characterize the geologic, geochemical, and
petrophysical rock properties of those shale beds, (3) reduce
exploration costs and drilling risk, especially in environmentally
sensitive areas, and (4) recommend the best practices to
complete and stimulate these shales to reduce development
costs and maximize gas recovery.
The UGS Paleozoic shale-gas study produced a number of
key findings. The Manning Canyon Shale was deposited in a
Manning Canyon shale-gas play area
Paradox Formation shale-gas play area
“Sweet spot”
“Sweet spot”
EXPLANATION
25 0 25 50 75 100
Miles
N
EW
S
Great
Salt
Lake
UINTA BASIN
BASIN
&
RANGE SanRafaelSwell
PARADOX BASIN
THRUS
T
BELT
Salt Lake City
Vernal
Monticello
Mexican Hat
Richfield
Moab
Green River
St.George
Price
Potential Paleozoic shale-gas play areas for the Manning
Canyon Shale and Paradox Formation in Utah, and the
identified “sweet spots” for each play area.
shallow restricted-marine, brackish, and freshwater setting like
the modern Everglades and Florida Bay. Total organic carbon
in the shale varies from 1 to 15 percent. Over time, the Manning
Canyon was buried deeply enough to generate natural gas.
The greatest Manning Canyon potential is a 600-square-mile
area surrounding Price, including the northwest end of the
San Rafael Swell. Several exploration wells in the area have
reported gas tests and hydrocarbon shows. Potential shale-gas
reservoirs in the Paradox Formation are estimated to contain
about 6.5 tcf of gas, mainly in the northeastern part of the play
area (the southwestern part is more oil prone with a potential
for over 250 million barrels of oil). In addition, the study shows
that overlying limestone beds, such as the lower Desert Creek
zone of the Paradox, may also contain significant gas reserves.
The resulting UGS publication, currently in the final stages
of review, is titled Paleozoic Shale-Gas Resources of the
Colorado Plateau and Eastern Great Basin, Utah: Multiple
Frontier Exploration Opportunities. The publication will be in
digital format and is anticipated to contain 11 chapters with
over 180 figures and 30 tables. These chapters include (1) a
geologic overview of Utah’s potential shale-gas reservoirs,
(2) the geologic setting of the Manning Canyon Shale and
Paradox Formation, (3) recent drilling activity (several wells
ENERGY
NEWS
8  SURVEY NOTES
(Left) UGS geologists describing and measuring an
outcrop of the Chimney Rock shale (Paradox Formation)
east of Mexican Hat, southeastern Utah. The organic-
rich Chimney Rock is a potential shale-gas reservoir
deep in the subsurface. The lower Desert Creek, which
may also have gas potential, and Akah are also zones in
the Paradox Formation.
(Top right) Well core (slabbed) of black, organic-rich,
shelly Manning Canyon Shale from a recent well south
of Price, Utah. The well initially tested 468,000 cubic feet
of gas per day from the Manning Canyon.
(Bottom right) Microscopic view (thin section) of the
Hovenweep shale (Paradox Formation) showing quartz
silt (numerous white angular grains), which creates
brittleness and fractures, within a muddy matrix.
Successful development of shale-gas plays requires integrating
accurate geologic characterization and reservoir-specific
engineering practices—a major goal of the UGS study. Our
study results can be used by geologists, petroleum engineers,
pipeline companies, landowners and other stakeholders, and
local, state, and federal government officials and decision
makers for the prudent exploration and development of these
potential Utah shale-gas resources.
For more information on the UGS Paleozoic shale-gas study,
visit our web page at geology.utah.gov/emp/shalegas/index.
htm.
have tested gas from shale in these formations), (4) visual
descriptions of shale cores obtained from both new and old
wells, (5) petrographic (microscopic) descriptions of the rocks
from wells and outcrops, (6) geochemical analyses to establish
organic content and maturity (capacity to generate gas) of
the shales, (7) petrophysics and rock mechanics to determine
porosity, permeability, and fracture potential, (8) identification
of outcrop analogs, (9) a variety of thickness and top of shale
(structure) maps, (10) recommendations for the best well
completion practices, and (11) identification of play “sweet
spots” that have the greatest shale-gas potential. Raw data,
core photographs, laboratory analyses, microscopic images,
etc., will be included in 21 appendices.
habitat. Recent groundwater-flow models constructed by the Southern
Nevada Water Authority (SNWA) and the USGS suggest that groundwa-
ter pumping along the eastern flank of the southern Snake Range west
of Lake Creek would severely reduce groundwater levels and spring
flow in the Big Springs–Dearden Springs–Lake Creek–Pruess Lake hy-
drologic/ecologic system. UGS monitoring of spring flow at Dearden
Springs and Clay Spring, and groundwater levels in many wells in this
area, will help quantify the impact if development occurs.
UGS flow data for Dearden Springs are an essential part of an in-
progress study of surface flow and groundwater-surface water
interaction along Big Springs Creek–Lake Creek, associated with a
monitoring agreement between the Department of the Interior and
SNWA. The Dearden Springs data are also part of a monitoring and
mitigation plan in the Nevada State Engineer’s decision to grant
water rights to SNWA in Spring Valley, and will likely be incorporated
into any future monitoring and mitigation plan associated with large-
scale groundwater development in southern Snake Valley. Separating
climatic and groundwater pumping signals in the data will be the main
use, and challenge, of the UGS monitoring.
continued from page 5
Hydrograph for Foote Reservoir Spring. Flow increased after removal of Rus-
sion olive trees surrounding the impoundment and outflow stream.
0
1
2
3
4
5
6
7
8
9
10
7/1/09 7/1/10 7/1/11 7/1/12 7/1/13 7/1/14
DailyMeanDischarge(ac-ft/d)
Date
Foote Reservoir Spring
Trend of pre-tree-removal discharge
Trend of post-tree-removal discharge
Tree removal late Jan/early Feb 2012
Mean Discharge 5.9 +/- 0.6 ac-ft/d (3.0 +/- 0.3 cfs)
Hydrograph for Foote Reservoir Spring. Flow increased after removal of Russion olive trees
surronding the impoundment and outflow stream.
Bishop Springs Area
UGS GROUNDWATER & SPRING FLOW MONITORING IN SNAKE VALLEY
MAY 2014  9
The Black Rock Desert is a volcanic area, or volcanic field,
covering more than 700 square miles in eastern Millard
County. Episodic volcanic activity has occurred here from a
couple million years ago up to a few centuries ago, leaving
intriguing landforms and features including volcanic cones,
lava tubes, pressure ridges, and craters. This article focuses on
the northeastern part of the field, which includes Black Rock
Volcano, Tabernacle Hill, White Mountain, the Ice Springs lava
flows, Devils Kitchen, and Pahvant Butte, all easily identifiable
from Interstate 15.
The Black Rock Desert lies within the Basin and Range
physiographic province, which has been shaped over the past
17 million years by stretching and uplift of the Earth’s crust.
Extension resulted in development of faults in the thinning
crust, creating a recurrent pattern of linear north-south
trending mountain ranges and valleys. Some of the faults have
been conduits for magma (and water) to reach the surface;
many of the volcanic cones, vents, and hot springs in the Black
Rock Desert align with the faults. Currently, the Black Rock
Desert may be the largest geothermal prospect in Utah.
The Black Rock Desert is the youngest volcanic field in Utah
and contains both Utah’s youngest known rhyolite dome,
White Mountain, and its most recent eruptive event, the basalt
flows at Ice Springs. Two major eruptions—at Pahvant Butte
and Tabernacle Hill—occurred when Ice Age Lake Bonneville
covered the area, forming volcanic islands in the lake.
About 15 miles south of Fillmore, the Black Rock Volcano—a
horseshoe-shaped volcanic cone—rises more than 300 feet
above the valley floor between I-15 and the town of Kanosh.
Volcanic cones are built of material ejected and piled up around
a central volcanic vent, forming a steep, conical hill. They are
called “cinder” cones when made of loose particles of volcanic
rock, and “spatter” cones when gobs of ejected molten lava
partially fuse the particles together. The Black Rock Volcano
is one of many cones of the Black Rock Desert that are a
combination of the two, known as “cinder-and-spatter” cones.
Tabernacle Hill is reached by way of Lava Tubes Road, named
for the caves in the area. The lava tubes, which extend for
hundreds of yards, formed as the surface of lava streams
cooled, solidified, and crusted over. The subterranean lava
then vacated the tubes as the supply of lava diminished,
leaving behind empty conduits. The central tuff ring, from
which Tabernacle Hill gets its name, is a type of volcanic cone
made of ash and grittier fragments (lapilli) created by explosive
eruptions caused by the interaction of basaltic magma and
shallow water. Only two-thirds of Tabernacle Hill’s original
3,000-foot-diameter cone remains; the northwest side has
been obliterated by eruptions. The central caldera within the
tuff ring is surfaced with pressure ridges and domes, which are
elliptical mounds that commonly split lengthwise along their
crest as molten lava pushes upward on the solidified crust of
the flow.
At about 400,000 years old, White Mountain is the youngest
known rhyolite dome in Utah. The dome gets its name from
the bright-white wind-blown gypsiferous Bonneville sands
draped across the volcanic protrusion. The 160-foot-high hill
consists of rhyolite, which is more viscous than basalt and tends
to pile up to form domes rather than spreading out in flows. At
the dome’s base is glassy-black obsidian formed by the rapid
cooling of lava, with frothy, bubble-filled pumice at the top of
the hill.
The Ice Springs lava flows, also called “The Cinders,” were
named for the natural icehouse conditions within the lava flows
where ice and icicles can be found throughout the year beneath
the blocky aa lava. Aa (pronounced ah ah) is characterized by
its rough-textured, loosely piled and jagged appearance, and
is notoriously difficult to travel across—sturdy hiking boots are
recommended. Pahoehoe lava flows have an entirely different
form, with a smooth, “ropey” texture. Lava flows can begin as
pahoehoe and change to aa, as seen at Tabernacle Hill. The Ice
geosights
An 8-foot-high pressure ridge at Tabernacle Hill.
Many of the ridges here are hundreds of feet long.
by Jim Davis
Volcanic Features in the Black Rock Desert, Millard County
10  SURVEY NOTES
Springs lava flows cover 17 square miles—dark volcanic rock
so recently extruded that little to no soil or vegetation has yet
taken hold. The flows originated from a cluster of four spatter-
and-cinder cones. These cones, along with several others,
churned out 700 million cubic yards of lava, one flow as recently
as around 600 years ago, earning the Ice Springs basalt the
designation of “newest rock in Utah.” People living in the area
at the time were undoubtedly mesmerized by the advance of
glowing, molten rock, and people may yet again see lava erupt
here in the future.
North of the Ice Springs flows is Devils Kitchen, named for
the hollow sound associated with its lava flow. In the days of
horse and wagon when travelers traversed the flow, hoofs
and wagon wheels vibrated the lava and the sound resonated
through it, like tapping on a drumhead or on the flat tin roof of
the devil’s kitchen. The Devils Kitchen fault forms a prominent
escarpment for most of its length from the Ice Springs flows
toward Pahvant Butte. The fault scarp is up to 60 feet high and
exposes columnar basalt, characterized by vertically jointed
columns, typically hexagonal and about two feet across, that
form from the cooling and contracting of thick lava. Numerous
boulders along the fault scarp have petroglyphs etched into
the dark patina.
Pahvant Butte, also known as “Sugarloaf,” is a major landmark
in the northern Black Rock Desert. A volcanic island in Ice Age
Lake Bonneville that emerged from beneath the lake surface,
Pahvant Butte has a wave-cut shoreline terrace surrounding
most of the tuff cone that rises almost 700 feet above this
ancient beach level. The upper part of the cone consists of
palagonite, a yellowish-colored rock created from the contact
of basalt lava flows with water. The northwest side of Pahvant
Butte is draped in the peculiar cavity-filled “lace curtain” rock
that resembles dripped wax (see article by W.F. Case in Survey
Notes, v. 34, no. 1). The southernmost part of the Pahvant
Butte lava field disappears under the younger Ice Springs
basalt flows.
There are many ways to access the Black Rock Desert
volcanic field, most of which involve travel over unpaved
but graded dirt roads. This selected route starts in Fillmore
and goes west to Ice Springs, from where you can go north
to Devils Kitchen and Pahvant Butte, or south to Tabernacle
Hill and White Mountain.
From I-15, take either Fillmore exit, then go down Main
Street and turn west on 400 North (State Route 100). Cross
the I-15 overpass (where 400 N turns into 500 N to Flowell)
and go 5.9 miles to 4600 West (Pahvant Heritage Trail). At this
intersection you can access the northern Ice Springs flows,
Devils Kitchen, and Pahvant Butte by turning right and
going north and west to Clear Lake Road, or you can access
the southern Ice Springs flows, Tabernacle Hill, and White
Mountain by turning left and going south and west along
the perimeter of the Ice Springs flows to 2300 South.
Tabernacle Hill and Pahvant Butte are classified by the
Bureau of Land Management (BLM) as Areas of Critical
Environmental
Concern (ACEC)
because they
are unusual vol-
canic features
and because of
their important
historic, wildlife,
and scenic val-
ues. A visit to
the BLM office
in Fillmore is a
good way to get
information, di-
rections, maps,
and current con-
ditions: 95 East
500 North, Fill-
more, UT, 84631,
(435) 743-3100.
how to get there
(Above left) Entrance to a lava tube at Tabernacle Hill.
(Above right) Inside a lava tube with skylights at Tabernacle Hill.
Skylights may be original to the lava flow, or the cave ceiling
could have collapsed after formation of the cave.
500 N
200 S
Clear Lake Rd.
400 N
4600W
2300
S
LavaTubesRd.
6400W
4000 S
Black
Rock
Volcano Kanosh
Hatton
Meadow
Flowell
Fillmore
0 4Miles
Holden
Pahvant
Butte
Devils
Kitchen
Ice Springs
Tabernacle
Hill White
Mtn.
DevilsKitchenFault
$
MAY 2014  11
Utah may be famous for its red rock, but the official state rock is coal.
I was recently asked by a child, “Do you like coal?” “Yes.” But, it can
leave a black mess on your hands and clothes, and if you are naughty
at Christmas you might find a lump of it in your stocking. And there are
worse associations: “anthrax” is derived from the Greek word for coal
(the skin disease causes lesions that are as black as coal), burning
high-sulfur coal contributes to acid rain (note that Utah’s coals are
low in sulfur), and coal is a major source of mercury pollution (again,
Utah’s coals contain relatively low amounts of mercury). So, what are
the positive aspects of coal that led it to be designated as Utah’s
state rock?
Coal has historical importance in Utah and
was mined in the territory as early as the
1850s. By the 1860s mines at Coalville in
Summit County supplied coal to Salt Lake
City. Historically, coal was used to heat
houses and power trains, contributing in a
substantial way to Utah’s early growth. The
Utah State Legislature designated coal as
Utah’s state rock in 1991, long after such
uses were commonplace. Despite no longer
being commonly used for trains or heating,
in 1991 Utah coal mines produced almost
44 BILLION pounds of coal (22 million tons),
valued at $795 million (inflation-adjusted).
More recently (2013), Utah mines produced
roughly 34 billion pounds (17 million tons)
of coal, valued at $579 million.
When I talk to groups of school kids, I often
find that neither they nor their parents know
what coal is used for today. I tell them to
look up, because the lights above their
heads are likely powered by coal-fired power
plants. In Utah, approximately 81 percent
of our electricity generation is derived from
coal; the rest of Utah’s generation comes
from natural gas (15 percent), hydroelectric
(1.5 percent), and other sources (2.5 percent). Beyond Utah, coal
accounts for 43 percent of U.S. and 41 percent of global electrical
production. Another way to look at it, approximately 96 percent of
coal mined in Utah is burned to generate electricity. The remaining 4
percent is mainly used by industrial plants, in kilns and furnaces.
The historical significance, usefulness, and economic contributions
of coal justified its designation as Utah’s official state rock, but how
is it formed and why does this rock burn? Coal is formed of ancient
plant matter. Plants (and some algae and bacteria) use the energy of
sunlight to convert carbon dioxide in the atmosphere to carbon-based
sugars through photosynthesis. Plants then use these sugars to build
cellulose or other complex carbon molecules that comprise plant’s
leafy and woody matter. When high concentrations of plants die and
accumulate in bogs and wetlands with low-oxygen conditions, burial,
heat, and pressure can convert plant matter to coal. Coal is the long-
term storage vessel of the carbon-based energy of plants. When coal
is burned the stored energy is converted to heat, which can be used
to turn turbines that create the electrical energy used in our homes
and industries.
When not turned to coal, the carbon-based
energy of plants can be consumed by
animals and become part of the food chain,
and either released back to the atmosphere
through burning or decomposition, or stored
in soil as detritus. This cycling of carbon,
from the atmosphere to plants to animals,
soil, or coal and back to the atmosphere,
is part of the Earth’s larger carbon cycle
(oceans are a major part of complex carbon
cycling). When we mine and burn coal and
other fossil fuels such as oil and gas, we are
removing carbon from long-term storage
within the Earth and releasing it to the
atmosphere as carbon dioxide.
In addition to being vital for photosynthesis,
atmospheric carbon dioxide is also an
important greenhouse gas. When carbon
dioxide is maintained at a relatively
constant level in our atmosphere, it helps
moderate our planet’s temperature.
However, since the Industrial Revolution,
we have been removing large quantities of
carbon from storage and transferring it to
the atmosphere (Utah’s coal only accounts
for 0.2 percent of the nearly 16 TRILLION pounds [8 billion tons] of
coal mined globally in 2012). The vast majority of scientists agree that
this increasing carbon dioxide in the atmosphere is the largest driver
of global warming.
So is Utah’s state rock good, bad, or ugly? The answer certainly
depends on who you ask, for coal has elements of good and elements
of bad. As for beauty, that is in the eye of the beholder.
Is coal beautiful? Victorian England apparently
thought so. Jet, a variety of coal that can be
carved and polished, was popular mourning
jewelry from the 1860s to the 1880s. Pictured
is a pendant that is dedicated, “DWS Fell Asleep
June 27th
1870 Aged 17.” Photo courtesy of
Barbara Robbins, www.artofmourning.com.
Coal became Utah’s official state rock in 1991.
In 2013 Utah mines produced roughly 17 million
tons of coal valued at $579 million, ranking
us 15th among 25 U.S. coal producing states.
Photo by Michael Vanden Berg.
GLAD YOU
ASKED
by Mark Milligan
IS UTAH’S STATE ROCK GOOD, BAD, OR UGLY?
12  SURVEY NOTES
Geologic hazards of the State Route 9 Corridor, La
Verkin City to Town of Springdale, Washington County,
Utah, by Tyler R. Knudsen and William R. Lund, DVD (13
p., 9 pl. [contains GIS data]), ISBN 978-1-55791-880-2,
Special Study 148......................................................................$24.95
Investigation of land subsidence and earth fissures in
Cedar Valley, Iron County, Utah, by Tyler Knudsen, Paul
Inkenbrandt, William Lund, Mike Lowe, and Steve Bowman,
CD (84 p. + 8 appendices), ISBN 978-1-55791-891-8,
Special Study 150.......................................................................$19.95
Utah’s extractive resource industries 2012, by Taylor Boden,
Michael Vanden Berg, Ken Krahulec, and Dave Tabet, 29 p.,
ISBN 978-1-55791-884-0, Circular 116.....................................$9.95
The Pony Express basaltic ash: a stratigraphic marker in
Lake Bonneville sediments, Utah, by Charles G. Oviatt
and Barbara P. Nash, CD (10 p.), ISBN 978-1-55791-890-1,
Miscellaneous Publication 14-1................................................$9.95
The Gilbert episode in the Great Salt Lake Basin, Utah,
by Charles G. Oviatt, CD (20 p.), ISBN 978-1-55791-893-2,
Miscellaneous Publication 14-3............................................$14.95
Preliminary isostatic residual gravity map of the New-
foundland Mountains and east part of the Wells 30’ x 60’
quadrangles, Box Elder County, Utah, by V.E. Langenheim, H.
Willis, N.D. Athens, B.A. Chuchel, S.M. Kraushaar, J. Rosario, J.
Roza, and C.L. Hardwick, CD (3 p., 1 pl., 3 data files), ISBN 978-
1-55791-879-6, Miscellaneous Publication 13-4................$14.95
Geologic map of the Brian Head quadrangle, Iron County,
Utah, by Peter D. Rowley, Robert F. Biek, Edward G. Sable,
Jonathan T. Boswell, Garrett S. Vice, Stanley C. Hatfield,
David J. Maxwell, and John J. Anderson, CD (38 p., 2 pl.
[contains GIS data]), scale 1:24,000, ISBN 978-1-55791-881-9,
Map 263DM..............................................................................$24.95
New Publications
Geologic map of the Saint John quadrangle, Tooele County,
Utah, by Stefan M. Kirby, CD (8 p., 2 pl. [contains GIS data]),
scale 1:24,000, ISBN 978-1-55791-885-7, Map 264DM.....$24.95
Geologic map of the Faust quadrangle, Tooele County, Utah,
by Stefan M. Kirby, DVD (8 p., 2 pl. [contains GIS data]), scale
1:24,000, ISBN 978-1-55791-886-4, Map 265DM..............$24.95
Geologic map of the Vernon NE quadrangle, Tooele County,
Utah, by Stefan M. Kirby, CD (6 p., 2 pl. [contains GIS data]),
scale 1:24,000, ISBN 978-1-55791-887-1, Map 266DM......$24.95
Regional groundwater flow and water quality in the Virgin
River Basin and surrounding areas, Utah and Arizona, by
Paul Inkenbrandt, Kevin Thomas, and J. Lucy Jordan, CD
(46 p. + 4 p. appendix), ISBN 978-1-55791-883-3, Report of
Investigation 272......................................................................$19.95
Investigation of the December 12, 2013, fatal rock fall at
368 West Main Street, Rockville, Utah, by William R. Lund,
Tyler R. Knudsen, and Steve D. Bowman, CD (20 p.), ISBN
978-1-55791-895-6, Report of Investigation 273..........$14.95
Interim geologic map of the Cedar City 7.5-minute
quadrangle, Iron County, Utah, by Tyler R. Knudsen, CD (20
p., 2 pl.), scale 1:24,000, Open-File Report 626................$14.95
Interim geologic map of the Cedar City NW quadrangle,
Iron County, Utah, by Tyler R. Knudsen and Robert F. Biek, CD
(18 p., 2 pl.), scale 1:24,000, Open-File Report 627........$14.95
Interim geologic map of the Enoch quad-rangle, Iron County,
Utah, by Tyler R. Knudsen, CD (12 p., 2 pl.), scale 1:24,000,
Open-File Report 628............................................................$14.95
The majority of
Utah’s electicity
generation is
produced by coal-
fired power plants.
This percentage is
likely to drop as
power plants such
as the Intermountain
Power Plant convert
to cleaner burning
natural gas. Data
from the U.S.
Energy Information
Administration.
Coal
81%
Natural
Gas
Hydroelectric
1.5%
Other
2.5%
15%
UTAH’S ELECTRICITY BY SOURCEThe Intermountain Power Plant (IPP) is a large, coal-fired power
plant near Delta, Millard County. IPP has a capacity of 1,900 MW,
enough to serve roughly 1.5 million households. About 75% of the
power produced by IPP is exported to Southern California. Photo
by Michael Vanden Berg.
MAY 2014  13
PRSRT STD
U.S. Postage
PAID
Salt Lake City, UT
Permit No. 4728
UTAH GEOLOGICAL SURVEY
1594 W North Temple, Suite 3110
Box 146100
Salt Lake City, UT 84114-6100
Address service requested
Survey Notes
FOLLOW US!
UGS TwitterUGS Blog
geology.utah.gov/blog UGS Facebook
NATURAL RESOURCES
MAP & BOOKSTORE
mapstore.utah.gov
1594 W. North Temple
Salt Lake City, UT 84116
801.537.3320 or 1.888.UTAHMAP
Monday–Friday 8 am–5 pm
The Groundwater and Paleontology Program welcomes Nathan Payne as
the new GIS analyst. He comes to us from Utah State University where he
recently graduated with a Bachelor of Science in Geography.
Congratulations to Tom Chidsey who was named the 2013 UGS Employee
of the Year. Tom is a senior scientist with the Energy and Minerals Program
and has worked at the UGS for 25 years. For 23 of those years, Tom served
as Petroleum Section chief. Tom never settles for the minimum required,
but always goes above and beyond. He has consistently produced a
high volume of superb quality work, having published over 100 technical
papers. He has impeccable character and integrity, and has brought
praise to the UGS from organizations such as the American Association of
Petroleum Geologists and Brigham Young University. Tom is a role-model
employee, carrying a heavy workload capably and cheerfully, and is a
deserving recipient of the UGS Employee of the Year Award.
2013 UGS Employee
of the Year
Employee News
SURVEY NEWS

More Related Content

What's hot

Tarnecki and Patterson 2015
Tarnecki and Patterson 2015Tarnecki and Patterson 2015
Tarnecki and Patterson 2015Joe Tarnecki
 
Final Draft Determining the effects of freshwater releases
Final Draft Determining the effects of freshwater releasesFinal Draft Determining the effects of freshwater releases
Final Draft Determining the effects of freshwater releasesJonathan Valentine
 
Animal Agriculture and the Earth
Animal Agriculture and the EarthAnimal Agriculture and the Earth
Animal Agriculture and the EarthAshwani Garg, MD
 
Environmental Impacts of Clay harvesting
Environmental Impacts of Clay harvestingEnvironmental Impacts of Clay harvesting
Environmental Impacts of Clay harvestingCOLLINS KUFFOUR
 
Water-related bird assemblages in an urban pond ‘archipelago’: Winter pattern...
Water-related bird assemblages in an urban pond ‘archipelago’: Winter pattern...Water-related bird assemblages in an urban pond ‘archipelago’: Winter pattern...
Water-related bird assemblages in an urban pond ‘archipelago’: Winter pattern...Maria Paola Di Santo
 
DuballPoster_CERFconference2015_PortlandOR
DuballPoster_CERFconference2015_PortlandORDuballPoster_CERFconference2015_PortlandOR
DuballPoster_CERFconference2015_PortlandORChelsea Duball
 
Tahoe institute for_environmental_security_presendation
Tahoe institute for_environmental_security_presendationTahoe institute for_environmental_security_presendation
Tahoe institute for_environmental_security_presendationDRIscience
 
IRJET- Hydrogeochemistry and Environmental Implication of Periyar River S...
IRJET-  	  Hydrogeochemistry and Environmental Implication of Periyar River S...IRJET-  	  Hydrogeochemistry and Environmental Implication of Periyar River S...
IRJET- Hydrogeochemistry and Environmental Implication of Periyar River S...IRJET Journal
 
UNCERTAINTY OF HYDROLOGIC EVENTS UNDER SOUTH DAKOTA’S CHANGING CONDITIONS: A ...
UNCERTAINTY OF HYDROLOGIC EVENTS UNDER SOUTH DAKOTA’S CHANGING CONDITIONS: A ...UNCERTAINTY OF HYDROLOGIC EVENTS UNDER SOUTH DAKOTA’S CHANGING CONDITIONS: A ...
UNCERTAINTY OF HYDROLOGIC EVENTS UNDER SOUTH DAKOTA’S CHANGING CONDITIONS: A ...Boris Shmagin
 
Cathey Quals
Cathey QualsCathey Quals
Cathey Qualsacathey
 
Residential irrigation as a driver of urban biodiversity
Residential irrigation as a driver of urban biodiversityResidential irrigation as a driver of urban biodiversity
Residential irrigation as a driver of urban biodiversityMadhusudan Katti
 

What's hot (20)

Tarnecki and Patterson 2015
Tarnecki and Patterson 2015Tarnecki and Patterson 2015
Tarnecki and Patterson 2015
 
July 30-150-Amanda Nelson
July 30-150-Amanda NelsonJuly 30-150-Amanda Nelson
July 30-150-Amanda Nelson
 
Final Draft Determining the effects of freshwater releases
Final Draft Determining the effects of freshwater releasesFinal Draft Determining the effects of freshwater releases
Final Draft Determining the effects of freshwater releases
 
Animal Agriculture and the Earth
Animal Agriculture and the EarthAnimal Agriculture and the Earth
Animal Agriculture and the Earth
 
Environmental Impacts of Clay harvesting
Environmental Impacts of Clay harvestingEnvironmental Impacts of Clay harvesting
Environmental Impacts of Clay harvesting
 
Water-related bird assemblages in an urban pond ‘archipelago’: Winter pattern...
Water-related bird assemblages in an urban pond ‘archipelago’: Winter pattern...Water-related bird assemblages in an urban pond ‘archipelago’: Winter pattern...
Water-related bird assemblages in an urban pond ‘archipelago’: Winter pattern...
 
DuballPoster_CERFconference2015_PortlandOR
DuballPoster_CERFconference2015_PortlandORDuballPoster_CERFconference2015_PortlandOR
DuballPoster_CERFconference2015_PortlandOR
 
Internship Paper
Internship PaperInternship Paper
Internship Paper
 
Tahoe institute for_environmental_security_presendation
Tahoe institute for_environmental_security_presendationTahoe institute for_environmental_security_presendation
Tahoe institute for_environmental_security_presendation
 
M. Stoever Final Assignment
M. Stoever Final AssignmentM. Stoever Final Assignment
M. Stoever Final Assignment
 
Feasibility Study on Small Scale Food Production Using Off-Grid Photovoltaic ...
Feasibility Study on Small Scale Food Production Using Off-Grid Photovoltaic ...Feasibility Study on Small Scale Food Production Using Off-Grid Photovoltaic ...
Feasibility Study on Small Scale Food Production Using Off-Grid Photovoltaic ...
 
FW Biology Publication Final
FW Biology Publication FinalFW Biology Publication Final
FW Biology Publication Final
 
IRJET- Hydrogeochemistry and Environmental Implication of Periyar River S...
IRJET-  	  Hydrogeochemistry and Environmental Implication of Periyar River S...IRJET-  	  Hydrogeochemistry and Environmental Implication of Periyar River S...
IRJET- Hydrogeochemistry and Environmental Implication of Periyar River S...
 
2013_61_1_Caballero_9
2013_61_1_Caballero_92013_61_1_Caballero_9
2013_61_1_Caballero_9
 
UNCERTAINTY OF HYDROLOGIC EVENTS UNDER SOUTH DAKOTA’S CHANGING CONDITIONS: A ...
UNCERTAINTY OF HYDROLOGIC EVENTS UNDER SOUTH DAKOTA’S CHANGING CONDITIONS: A ...UNCERTAINTY OF HYDROLOGIC EVENTS UNDER SOUTH DAKOTA’S CHANGING CONDITIONS: A ...
UNCERTAINTY OF HYDROLOGIC EVENTS UNDER SOUTH DAKOTA’S CHANGING CONDITIONS: A ...
 
Cathey Quals
Cathey QualsCathey Quals
Cathey Quals
 
Riverine thermal regimes
Riverine thermal regimesRiverine thermal regimes
Riverine thermal regimes
 
Residential irrigation as a driver of urban biodiversity
Residential irrigation as a driver of urban biodiversityResidential irrigation as a driver of urban biodiversity
Residential irrigation as a driver of urban biodiversity
 
LChasmer_cv_2017
LChasmer_cv_2017LChasmer_cv_2017
LChasmer_cv_2017
 
PRESENTATION
PRESENTATIONPRESENTATION
PRESENTATION
 

Similar to Survey Notes, May 2014

Diehl_Research_poster(2) (1)
Diehl_Research_poster(2) (1)Diehl_Research_poster(2) (1)
Diehl_Research_poster(2) (1)Brett Diehl
 
Water Quality Guidelines For Agriculture
Water Quality Guidelines For AgricultureWater Quality Guidelines For Agriculture
Water Quality Guidelines For AgricultureTiffany Surratt
 
Assessment Of Lake Water Quality And Eutrophication Risk In An Agricultural I...
Assessment Of Lake Water Quality And Eutrophication Risk In An Agricultural I...Assessment Of Lake Water Quality And Eutrophication Risk In An Agricultural I...
Assessment Of Lake Water Quality And Eutrophication Risk In An Agricultural I...Amy Cernava
 
Poster survey of migratory waterfowl on krystal lake quarry pond chazy
Poster survey of migratory waterfowl on krystal lake quarry pond chazyPoster survey of migratory waterfowl on krystal lake quarry pond chazy
Poster survey of migratory waterfowl on krystal lake quarry pond chazyMichelle Volk
 
WaterQualityReportCard1215152
WaterQualityReportCard1215152WaterQualityReportCard1215152
WaterQualityReportCard1215152Laura Kelm
 
Wetland Conservation: What Do We Have to Lose?
Wetland Conservation: What Do We Have to Lose?Wetland Conservation: What Do We Have to Lose?
Wetland Conservation: What Do We Have to Lose?Sean Carroll
 
Biodiversity and abundance of fish and plankton of nguru lake, northeastern, ...
Biodiversity and abundance of fish and plankton of nguru lake, northeastern, ...Biodiversity and abundance of fish and plankton of nguru lake, northeastern, ...
Biodiversity and abundance of fish and plankton of nguru lake, northeastern, ...Alexander Decker
 
CCW conference: Protecting Susquehanna and impacts on jobs
CCW conference: Protecting Susquehanna and impacts on jobsCCW conference: Protecting Susquehanna and impacts on jobs
CCW conference: Protecting Susquehanna and impacts on jobsClean Water
 
Hydrogeology-of-the-Dry-Zone-Central-Myanmar PART-1
Hydrogeology-of-the-Dry-Zone-Central-Myanmar PART-1Hydrogeology-of-the-Dry-Zone-Central-Myanmar PART-1
Hydrogeology-of-the-Dry-Zone-Central-Myanmar PART-1MYO AUNG Myanmar
 
Freshwater fish diversity of a tropical rainforest river in southeast nigeria
Freshwater fish diversity of a tropical rainforest river in southeast nigeriaFreshwater fish diversity of a tropical rainforest river in southeast nigeria
Freshwater fish diversity of a tropical rainforest river in southeast nigeriaAlexander Decker
 
Youngstown Sewage Water Policy
Youngstown Sewage Water PolicyYoungstown Sewage Water Policy
Youngstown Sewage Water PolicyTaylor Hartman
 
EOPS_2019_09_12.pdf
EOPS_2019_09_12.pdfEOPS_2019_09_12.pdf
EOPS_2019_09_12.pdfEOPS EOPS
 

Similar to Survey Notes, May 2014 (20)

DERMA Management
DERMA ManagementDERMA Management
DERMA Management
 
Diehl_Research_poster(2) (1)
Diehl_Research_poster(2) (1)Diehl_Research_poster(2) (1)
Diehl_Research_poster(2) (1)
 
Water Quality Guidelines For Agriculture
Water Quality Guidelines For AgricultureWater Quality Guidelines For Agriculture
Water Quality Guidelines For Agriculture
 
Assessment Of Lake Water Quality And Eutrophication Risk In An Agricultural I...
Assessment Of Lake Water Quality And Eutrophication Risk In An Agricultural I...Assessment Of Lake Water Quality And Eutrophication Risk In An Agricultural I...
Assessment Of Lake Water Quality And Eutrophication Risk In An Agricultural I...
 
July 29-1030-Stroud
July 29-1030-StroudJuly 29-1030-Stroud
July 29-1030-Stroud
 
Poster survey of migratory waterfowl on krystal lake quarry pond chazy
Poster survey of migratory waterfowl on krystal lake quarry pond chazyPoster survey of migratory waterfowl on krystal lake quarry pond chazy
Poster survey of migratory waterfowl on krystal lake quarry pond chazy
 
UWV draft 3
UWV draft 3UWV draft 3
UWV draft 3
 
Grimaldo2009MCF
Grimaldo2009MCFGrimaldo2009MCF
Grimaldo2009MCF
 
Grimaldo_et_al_2004
Grimaldo_et_al_2004Grimaldo_et_al_2004
Grimaldo_et_al_2004
 
WaterQualityReportCard1215152
WaterQualityReportCard1215152WaterQualityReportCard1215152
WaterQualityReportCard1215152
 
SRS Final Presentation
SRS Final Presentation SRS Final Presentation
SRS Final Presentation
 
Wetland Conservation: What Do We Have to Lose?
Wetland Conservation: What Do We Have to Lose?Wetland Conservation: What Do We Have to Lose?
Wetland Conservation: What Do We Have to Lose?
 
Biodiversity and abundance of fish and plankton of nguru lake, northeastern, ...
Biodiversity and abundance of fish and plankton of nguru lake, northeastern, ...Biodiversity and abundance of fish and plankton of nguru lake, northeastern, ...
Biodiversity and abundance of fish and plankton of nguru lake, northeastern, ...
 
CCW conference: Protecting Susquehanna and impacts on jobs
CCW conference: Protecting Susquehanna and impacts on jobsCCW conference: Protecting Susquehanna and impacts on jobs
CCW conference: Protecting Susquehanna and impacts on jobs
 
OGE.Report.final_
OGE.Report.final_OGE.Report.final_
OGE.Report.final_
 
Hydrogeology-of-the-Dry-Zone-Central-Myanmar PART-1
Hydrogeology-of-the-Dry-Zone-Central-Myanmar PART-1Hydrogeology-of-the-Dry-Zone-Central-Myanmar PART-1
Hydrogeology-of-the-Dry-Zone-Central-Myanmar PART-1
 
Bathymetric Survey of Cross Lake
Bathymetric Survey of Cross LakeBathymetric Survey of Cross Lake
Bathymetric Survey of Cross Lake
 
Freshwater fish diversity of a tropical rainforest river in southeast nigeria
Freshwater fish diversity of a tropical rainforest river in southeast nigeriaFreshwater fish diversity of a tropical rainforest river in southeast nigeria
Freshwater fish diversity of a tropical rainforest river in southeast nigeria
 
Youngstown Sewage Water Policy
Youngstown Sewage Water PolicyYoungstown Sewage Water Policy
Youngstown Sewage Water Policy
 
EOPS_2019_09_12.pdf
EOPS_2019_09_12.pdfEOPS_2019_09_12.pdf
EOPS_2019_09_12.pdf
 

More from State of Utah, Salt Lake City

Health Data Transparency: Utah’s All Payer Claims Database
Health Data Transparency: Utah’s All Payer Claims DatabaseHealth Data Transparency: Utah’s All Payer Claims Database
Health Data Transparency: Utah’s All Payer Claims DatabaseState of Utah, Salt Lake City
 
Health Disparities by Utah Legislative District 2019
Health Disparities by Utah Legislative District 2019Health Disparities by Utah Legislative District 2019
Health Disparities by Utah Legislative District 2019State of Utah, Salt Lake City
 
The Utah Geological Survey provides timely scientific information about Utah’...
The Utah Geological Survey provides timely scientific information about Utah’...The Utah Geological Survey provides timely scientific information about Utah’...
The Utah Geological Survey provides timely scientific information about Utah’...State of Utah, Salt Lake City
 
Utah Division of Wildlife Resources Presentation to 2019 Legislature
Utah Division of Wildlife Resources Presentation to 2019 LegislatureUtah Division of Wildlife Resources Presentation to 2019 Legislature
Utah Division of Wildlife Resources Presentation to 2019 LegislatureState of Utah, Salt Lake City
 
Utah Division of Aeronautics Annual Needs and Accomplishments
Utah Division of Aeronautics Annual Needs and AccomplishmentsUtah Division of Aeronautics Annual Needs and Accomplishments
Utah Division of Aeronautics Annual Needs and AccomplishmentsState of Utah, Salt Lake City
 
Fourth Quarter FY2018 Quarterly Report from Utah DCFS
Fourth Quarter FY2018 Quarterly Report from Utah DCFSFourth Quarter FY2018 Quarterly Report from Utah DCFS
Fourth Quarter FY2018 Quarterly Report from Utah DCFSState of Utah, Salt Lake City
 
Transportation Policy and Funding: Historical and Emerging Trends
Transportation Policy and Funding: Historical and Emerging TrendsTransportation Policy and Funding: Historical and Emerging Trends
Transportation Policy and Funding: Historical and Emerging TrendsState of Utah, Salt Lake City
 

More from State of Utah, Salt Lake City (20)

Utah Veterinary Diagnostic Laboratory
Utah Veterinary Diagnostic LaboratoryUtah Veterinary Diagnostic Laboratory
Utah Veterinary Diagnostic Laboratory
 
Health Data Transparency: Utah’s All Payer Claims Database
Health Data Transparency: Utah’s All Payer Claims DatabaseHealth Data Transparency: Utah’s All Payer Claims Database
Health Data Transparency: Utah’s All Payer Claims Database
 
Utah Division of Juvenile and Justice Services
Utah Division of Juvenile and Justice ServicesUtah Division of Juvenile and Justice Services
Utah Division of Juvenile and Justice Services
 
Health Disparities by Utah Legislative District 2019
Health Disparities by Utah Legislative District 2019Health Disparities by Utah Legislative District 2019
Health Disparities by Utah Legislative District 2019
 
Localscapes
LocalscapesLocalscapes
Localscapes
 
Status of Translocated Tortoises in Southwest Utah
Status of Translocated Tortoises in Southwest UtahStatus of Translocated Tortoises in Southwest Utah
Status of Translocated Tortoises in Southwest Utah
 
The Logan River Observatory
The Logan River ObservatoryThe Logan River Observatory
The Logan River Observatory
 
Utah Strategic Workforce Presentation
Utah Strategic Workforce PresentationUtah Strategic Workforce Presentation
Utah Strategic Workforce Presentation
 
The Utah Geological Survey provides timely scientific information about Utah’...
The Utah Geological Survey provides timely scientific information about Utah’...The Utah Geological Survey provides timely scientific information about Utah’...
The Utah Geological Survey provides timely scientific information about Utah’...
 
Utah Forestry, Fire and State Lands 2019
Utah Forestry, Fire and State Lands 2019Utah Forestry, Fire and State Lands 2019
Utah Forestry, Fire and State Lands 2019
 
Utah Division of Wildlife Resources Presentation to 2019 Legislature
Utah Division of Wildlife Resources Presentation to 2019 LegislatureUtah Division of Wildlife Resources Presentation to 2019 Legislature
Utah Division of Wildlife Resources Presentation to 2019 Legislature
 
UDOT Presentation to 2019 Legislature
UDOT Presentation to 2019 LegislatureUDOT Presentation to 2019 Legislature
UDOT Presentation to 2019 Legislature
 
Utah System of Technical Colleges
Utah System of Technical CollegesUtah System of Technical Colleges
Utah System of Technical Colleges
 
Public Water System Identification in Utah
Public Water System Identification in UtahPublic Water System Identification in Utah
Public Water System Identification in Utah
 
State of Utah Suicide Prevention
State of Utah Suicide PreventionState of Utah Suicide Prevention
State of Utah Suicide Prevention
 
Utah Division of Aeronautics Annual Needs and Accomplishments
Utah Division of Aeronautics Annual Needs and AccomplishmentsUtah Division of Aeronautics Annual Needs and Accomplishments
Utah Division of Aeronautics Annual Needs and Accomplishments
 
Fourth Quarter FY2018 Quarterly Report from Utah DCFS
Fourth Quarter FY2018 Quarterly Report from Utah DCFSFourth Quarter FY2018 Quarterly Report from Utah DCFS
Fourth Quarter FY2018 Quarterly Report from Utah DCFS
 
Update on FirstNet in Utah
Update on FirstNet in UtahUpdate on FirstNet in Utah
Update on FirstNet in Utah
 
Energy Incentives in Utah - 2018 Audit
Energy Incentives in Utah - 2018 AuditEnergy Incentives in Utah - 2018 Audit
Energy Incentives in Utah - 2018 Audit
 
Transportation Policy and Funding: Historical and Emerging Trends
Transportation Policy and Funding: Historical and Emerging TrendsTransportation Policy and Funding: Historical and Emerging Trends
Transportation Policy and Funding: Historical and Emerging Trends
 

Recently uploaded

High-Level Thematic Event on Tourism - SUSTAINABILITY WEEK 2024- United Natio...
High-Level Thematic Event on Tourism - SUSTAINABILITY WEEK 2024- United Natio...High-Level Thematic Event on Tourism - SUSTAINABILITY WEEK 2024- United Natio...
High-Level Thematic Event on Tourism - SUSTAINABILITY WEEK 2024- United Natio...Christina Parmionova
 
NO1 Certified kala jadu Love Marriage Black Magic Punjab Powerful Black Magic...
NO1 Certified kala jadu Love Marriage Black Magic Punjab Powerful Black Magic...NO1 Certified kala jadu Love Marriage Black Magic Punjab Powerful Black Magic...
NO1 Certified kala jadu Love Marriage Black Magic Punjab Powerful Black Magic...Amil baba
 
Angels_EDProgrammes & Services 2024.pptx
Angels_EDProgrammes & Services 2024.pptxAngels_EDProgrammes & Services 2024.pptx
Angels_EDProgrammes & Services 2024.pptxLizelle Coombs
 
Start Donating your Old Clothes to Poor People
Start Donating your Old Clothes to Poor PeopleStart Donating your Old Clothes to Poor People
Start Donating your Old Clothes to Poor PeopleSERUDS INDIA
 
call girls in Mayapuri DELHI 🔝 >༒9540349809 🔝 genuine Escort Service 🔝✔️✔️
call girls in Mayapuri DELHI 🔝 >༒9540349809 🔝 genuine Escort Service 🔝✔️✔️call girls in Mayapuri DELHI 🔝 >༒9540349809 🔝 genuine Escort Service 🔝✔️✔️
call girls in Mayapuri DELHI 🔝 >༒9540349809 🔝 genuine Escort Service 🔝✔️✔️saminamagar
 
PEO AVRIL POUR LA COMMUNE D'ORGERUS INFO
PEO AVRIL POUR LA COMMUNE D'ORGERUS INFOPEO AVRIL POUR LA COMMUNE D'ORGERUS INFO
PEO AVRIL POUR LA COMMUNE D'ORGERUS INFOMAIRIEORGERUS
 
call girls in Vasant Kunj DELHI 🔝 >༒9540349809 🔝 genuine Escort Service 🔝✔️✔️
call girls in Vasant Kunj DELHI 🔝 >༒9540349809 🔝 genuine Escort Service 🔝✔️✔️call girls in Vasant Kunj DELHI 🔝 >༒9540349809 🔝 genuine Escort Service 🔝✔️✔️
call girls in Vasant Kunj DELHI 🔝 >༒9540349809 🔝 genuine Escort Service 🔝✔️✔️saminamagar
 
call girls in sector 22 Gurgaon 🔝 >༒9540349809 🔝 genuine Escort Service 🔝✔️✔️
call girls in sector 22 Gurgaon  🔝 >༒9540349809 🔝 genuine Escort Service 🔝✔️✔️call girls in sector 22 Gurgaon  🔝 >༒9540349809 🔝 genuine Escort Service 🔝✔️✔️
call girls in sector 22 Gurgaon 🔝 >༒9540349809 🔝 genuine Escort Service 🔝✔️✔️saminamagar
 
Action Toolkit - Earth Day 2024 - April 22nd.
Action Toolkit - Earth Day 2024 - April 22nd.Action Toolkit - Earth Day 2024 - April 22nd.
Action Toolkit - Earth Day 2024 - April 22nd.Christina Parmionova
 
call girls in Tilak Nagar DELHI 🔝 >༒9540349809 🔝 genuine Escort Service 🔝✔️✔️
call girls in Tilak Nagar DELHI 🔝 >༒9540349809 🔝 genuine Escort Service 🔝✔️✔️call girls in Tilak Nagar DELHI 🔝 >༒9540349809 🔝 genuine Escort Service 🔝✔️✔️
call girls in Tilak Nagar DELHI 🔝 >༒9540349809 🔝 genuine Escort Service 🔝✔️✔️saminamagar
 
Professional Conduct and ethics lecture.pptx
Professional Conduct and ethics lecture.pptxProfessional Conduct and ethics lecture.pptx
Professional Conduct and ethics lecture.pptxjennysansano2
 
2024: The FAR, Federal Acquisition Regulations - Part 25
2024: The FAR, Federal Acquisition Regulations - Part 252024: The FAR, Federal Acquisition Regulations - Part 25
2024: The FAR, Federal Acquisition Regulations - Part 25JSchaus & Associates
 
Powering Britain: Can we decarbonise electricity without disadvantaging poore...
Powering Britain: Can we decarbonise electricity without disadvantaging poore...Powering Britain: Can we decarbonise electricity without disadvantaging poore...
Powering Britain: Can we decarbonise electricity without disadvantaging poore...ResolutionFoundation
 
(多少钱)Dal毕业证国外本科学位证
(多少钱)Dal毕业证国外本科学位证(多少钱)Dal毕业证国外本科学位证
(多少钱)Dal毕业证国外本科学位证mbetknu
 
Jewish Efforts to Influence American Immigration Policy in the Years Before t...
Jewish Efforts to Influence American Immigration Policy in the Years Before t...Jewish Efforts to Influence American Immigration Policy in the Years Before t...
Jewish Efforts to Influence American Immigration Policy in the Years Before t...yalehistoricalreview
 
YHR Fall 2023 Issue (Joseph Manning Interview) (2).pdf
YHR Fall 2023 Issue (Joseph Manning Interview) (2).pdfYHR Fall 2023 Issue (Joseph Manning Interview) (2).pdf
YHR Fall 2023 Issue (Joseph Manning Interview) (2).pdfyalehistoricalreview
 
办理约克大学毕业证成绩单|购买加拿大文凭证书
办理约克大学毕业证成绩单|购买加拿大文凭证书办理约克大学毕业证成绩单|购买加拿大文凭证书
办理约克大学毕业证成绩单|购买加拿大文凭证书zdzoqco
 
Stop throwing your old clothes and start donating
Stop throwing your old clothes and start donatingStop throwing your old clothes and start donating
Stop throwing your old clothes and start donatingSERUDS INDIA
 
Madurai Call Girls 7001305949 WhatsApp Number 24x7 Best Services
Madurai Call Girls 7001305949 WhatsApp Number 24x7 Best ServicesMadurai Call Girls 7001305949 WhatsApp Number 24x7 Best Services
Madurai Call Girls 7001305949 WhatsApp Number 24x7 Best Servicesnajka9823
 
2023 Ecological Profile of Ilocos Norte.pdf
2023 Ecological Profile of Ilocos Norte.pdf2023 Ecological Profile of Ilocos Norte.pdf
2023 Ecological Profile of Ilocos Norte.pdfilocosnortegovph
 

Recently uploaded (20)

High-Level Thematic Event on Tourism - SUSTAINABILITY WEEK 2024- United Natio...
High-Level Thematic Event on Tourism - SUSTAINABILITY WEEK 2024- United Natio...High-Level Thematic Event on Tourism - SUSTAINABILITY WEEK 2024- United Natio...
High-Level Thematic Event on Tourism - SUSTAINABILITY WEEK 2024- United Natio...
 
NO1 Certified kala jadu Love Marriage Black Magic Punjab Powerful Black Magic...
NO1 Certified kala jadu Love Marriage Black Magic Punjab Powerful Black Magic...NO1 Certified kala jadu Love Marriage Black Magic Punjab Powerful Black Magic...
NO1 Certified kala jadu Love Marriage Black Magic Punjab Powerful Black Magic...
 
Angels_EDProgrammes & Services 2024.pptx
Angels_EDProgrammes & Services 2024.pptxAngels_EDProgrammes & Services 2024.pptx
Angels_EDProgrammes & Services 2024.pptx
 
Start Donating your Old Clothes to Poor People
Start Donating your Old Clothes to Poor PeopleStart Donating your Old Clothes to Poor People
Start Donating your Old Clothes to Poor People
 
call girls in Mayapuri DELHI 🔝 >༒9540349809 🔝 genuine Escort Service 🔝✔️✔️
call girls in Mayapuri DELHI 🔝 >༒9540349809 🔝 genuine Escort Service 🔝✔️✔️call girls in Mayapuri DELHI 🔝 >༒9540349809 🔝 genuine Escort Service 🔝✔️✔️
call girls in Mayapuri DELHI 🔝 >༒9540349809 🔝 genuine Escort Service 🔝✔️✔️
 
PEO AVRIL POUR LA COMMUNE D'ORGERUS INFO
PEO AVRIL POUR LA COMMUNE D'ORGERUS INFOPEO AVRIL POUR LA COMMUNE D'ORGERUS INFO
PEO AVRIL POUR LA COMMUNE D'ORGERUS INFO
 
call girls in Vasant Kunj DELHI 🔝 >༒9540349809 🔝 genuine Escort Service 🔝✔️✔️
call girls in Vasant Kunj DELHI 🔝 >༒9540349809 🔝 genuine Escort Service 🔝✔️✔️call girls in Vasant Kunj DELHI 🔝 >༒9540349809 🔝 genuine Escort Service 🔝✔️✔️
call girls in Vasant Kunj DELHI 🔝 >༒9540349809 🔝 genuine Escort Service 🔝✔️✔️
 
call girls in sector 22 Gurgaon 🔝 >༒9540349809 🔝 genuine Escort Service 🔝✔️✔️
call girls in sector 22 Gurgaon  🔝 >༒9540349809 🔝 genuine Escort Service 🔝✔️✔️call girls in sector 22 Gurgaon  🔝 >༒9540349809 🔝 genuine Escort Service 🔝✔️✔️
call girls in sector 22 Gurgaon 🔝 >༒9540349809 🔝 genuine Escort Service 🔝✔️✔️
 
Action Toolkit - Earth Day 2024 - April 22nd.
Action Toolkit - Earth Day 2024 - April 22nd.Action Toolkit - Earth Day 2024 - April 22nd.
Action Toolkit - Earth Day 2024 - April 22nd.
 
call girls in Tilak Nagar DELHI 🔝 >༒9540349809 🔝 genuine Escort Service 🔝✔️✔️
call girls in Tilak Nagar DELHI 🔝 >༒9540349809 🔝 genuine Escort Service 🔝✔️✔️call girls in Tilak Nagar DELHI 🔝 >༒9540349809 🔝 genuine Escort Service 🔝✔️✔️
call girls in Tilak Nagar DELHI 🔝 >༒9540349809 🔝 genuine Escort Service 🔝✔️✔️
 
Professional Conduct and ethics lecture.pptx
Professional Conduct and ethics lecture.pptxProfessional Conduct and ethics lecture.pptx
Professional Conduct and ethics lecture.pptx
 
2024: The FAR, Federal Acquisition Regulations - Part 25
2024: The FAR, Federal Acquisition Regulations - Part 252024: The FAR, Federal Acquisition Regulations - Part 25
2024: The FAR, Federal Acquisition Regulations - Part 25
 
Powering Britain: Can we decarbonise electricity without disadvantaging poore...
Powering Britain: Can we decarbonise electricity without disadvantaging poore...Powering Britain: Can we decarbonise electricity without disadvantaging poore...
Powering Britain: Can we decarbonise electricity without disadvantaging poore...
 
(多少钱)Dal毕业证国外本科学位证
(多少钱)Dal毕业证国外本科学位证(多少钱)Dal毕业证国外本科学位证
(多少钱)Dal毕业证国外本科学位证
 
Jewish Efforts to Influence American Immigration Policy in the Years Before t...
Jewish Efforts to Influence American Immigration Policy in the Years Before t...Jewish Efforts to Influence American Immigration Policy in the Years Before t...
Jewish Efforts to Influence American Immigration Policy in the Years Before t...
 
YHR Fall 2023 Issue (Joseph Manning Interview) (2).pdf
YHR Fall 2023 Issue (Joseph Manning Interview) (2).pdfYHR Fall 2023 Issue (Joseph Manning Interview) (2).pdf
YHR Fall 2023 Issue (Joseph Manning Interview) (2).pdf
 
办理约克大学毕业证成绩单|购买加拿大文凭证书
办理约克大学毕业证成绩单|购买加拿大文凭证书办理约克大学毕业证成绩单|购买加拿大文凭证书
办理约克大学毕业证成绩单|购买加拿大文凭证书
 
Stop throwing your old clothes and start donating
Stop throwing your old clothes and start donatingStop throwing your old clothes and start donating
Stop throwing your old clothes and start donating
 
Madurai Call Girls 7001305949 WhatsApp Number 24x7 Best Services
Madurai Call Girls 7001305949 WhatsApp Number 24x7 Best ServicesMadurai Call Girls 7001305949 WhatsApp Number 24x7 Best Services
Madurai Call Girls 7001305949 WhatsApp Number 24x7 Best Services
 
2023 Ecological Profile of Ilocos Norte.pdf
2023 Ecological Profile of Ilocos Norte.pdf2023 Ecological Profile of Ilocos Norte.pdf
2023 Ecological Profile of Ilocos Norte.pdf
 

Survey Notes, May 2014

  • 1. WETLAND MONITORING IN SNAKE VALLEY May 2014Volume 46, Number 2 U T A H G E O L O G I C A L S U R V E Y SURVEY NOTES
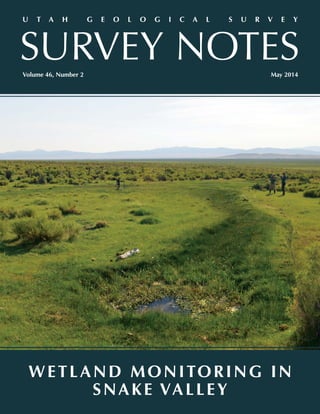
  • 2. State of Utah Gary R. Herbert, Governor Department of Natural Resources Michael Styler, Executive Director UGS Board Mark Bunnell, Chair William Loughlin, Tom Tripp, Sunny Dent, Kenneth Puchlik, Marc Eckels, Pete Kilbourne, Kevin Carter (Trust Lands Administration-ex officio) UGS Staff Administration Richard G. Allis, Director Kimm Harty, Deputy Director Starr Soliz, Secretary/Receptionist Dianne Davis, Administrative Secretary Jodi Patterson, Financial Manager Linda Bennett, Accounting Technician Michael Hylland, Technical Reviewer Robert Ressetar, Technical Reviewer Editorial Staff Vicky Clarke Lori Steadman, Jay Hill, Nikki Simon, Elizabeth Firmage Geologic Hazards Steve Bowman Richard Giraud, William Lund, Greg McDonald, Jessica Castleton, Gregg Beukelman, Chris DuRoss, Tyler Knudsen, Corey Unger, Adam McKean, Ben Erickson, Pam Perri, Adam Hiscock Geologic Information and Outreach Sandra Eldredge Christine Wilkerson, Patricia Stokes, Mark Milligan, Lance Weaver, Gentry Hammerschmid, Jim Davis, Marshall Robinson, Bryan Butler, Robyn Keeling Geologic Mapping Grant Willis Jon King, Douglas Sprinkel, Kent Brown, Basia Matyjasik, Donald Clark, Bob Biek, Paul Kuehne, Zach Anderson Energy and Minerals David Tabet Robert Blackett, Craig Morgan, Jeff Quick, Taylor Boden, Thomas Chidsey, Cheryl Gustin, Tom Dempster, Brigitte Hucka, Stephanie Carney, Ken Krahulec, Brad Wolverton, Mike Vanden Berg, Andrew Rupke, Mark Gwynn, Christian Hardwick, Peter Nielsen, Hobie Willis, Rebekah Wood Groundwater and Paleontology Mike Lowe James Kirkland, Janae Wallace, Martha Hayden, Hugh Hurlow, Don DeBlieux, Kim Nay, Paul Inkenbrandt, Lucy Jordan, Kevin Thomas, Walid Sabbah, Rich Emerson, Stefan Kirby, Scott Madsen, Jennifer Jones, Diane Menuz, Ryhan Sempler, Nathan Payne Survey Notes is published three times yearly by Utah Geological Survey, 1594 W. North Temple, Suite 3110, Salt Lake City, Utah 84116; (801) 537-3300. The Utah Geological Survey provides timely scientific information about Utah’s geologic environment, resources, and hazards. The UGS is a division of the Department of Natural Resources. Single copies of Survey Notes are distributed free of charge within the United States and reproduction is encouraged with recognition of source. Copies are available at geology.utah.gov/surveynotes. ISSN 1061-7930 Contents Wetland Monitoring in Snake Valley........................1 UGS Groundwater & Spring Flow Monitoring in Snake Valley................................................. 4 When Sharks, Rays & Sawfish Ruled Utah’s Rivers..................................................6 Energy News.........................................................8 GeoSights.............................................................10 Glad You Asked....................................................12 New Publications.................................................13 Survey News.........................................Back Cover Design: Elizabeth Firmage Cover: Springhead and associated wet meadow at an unnamed cluster of springs north of Big Springs in southern Snake Valley. Photo by Jennifer Jones. The 2014 legislative ses- sion has just ended, and it included an important building block of ongo- ing general funds for the Utah Geological Survey. Our original source of funding for monitoring and maintaining ground- water wells in Snake Val- ley of Utah’s west desert, as well as preserving the data and serving it to the public on our website, had dried up. The build- ing block constitutes replacement funding that is essential for sustain- ing the valuable time series of hourly water-level and spring-flow changes that have now been collected for at leastsixyears(seearticlebyHurlowand Jordan, page 4; also, the article by Menuz and others, page 1, discusses wetlandsresearchbeingdoneinSnake Valley). The groundwater network includes 67 newly drilled wells, 11 previously drilled wells, and surface- flow gauges at six springs. Monitoring shows that in southern Snake Valley there are significant irrigation effects having an annual cycle, as well as effects from longer term groundwater pumping and variations in precipita- tion (and consequently recharge) to the groundwater. However, farther north and at greater distance from the main recharge source assumed to be in the Snake Range, these precipita- tion signals are much attenuated. Modeling of the impacts of large-scale ground- water extraction by the Southern Nevada Water Authority (SNWA) for a water rights hearing sev- eral years ago consisted of a relatively simple model, and showed many tens of feet of drawdown over decades in southern Snake Valley. The UGS monitoring program now provides sufficient data for a more accurate and detailed model that can be calibrated against ongoing irrigation effects and natural recharge changes. The value of this continuous dataset steadily increases with time, and will allow Utah to more quantitatively predict future effects if SNWA decides to continue its plan for large-scale extraction of groundwater in southern Snake Valley. Later this year, the UGS anticipates publishing a compilation of scien- tific findings from its studies in Snake Valley as a result of the groundwater monitoring program. This will be a Bulletin (Hydrogeologic Studies and Groundwater Monitoring in Snake Valley and Adjacent Hydrographic Areas, West-Central Utah and East- Central Nevada, compiled by Hugh A. Hurlow) containing 10 chapters and over 100 illustrations. Like the water- level data that are now accumulating, this Bulletin will be valuable for pro- tecting Utah’s groundwater resource in Snake Valley. The Director’s Perspective by Richard G. Allis Richard Kennedy, former UGS Board member (1993–2001) and university professor, passed away on February 9, 2014, in Henderson, Nevada. He was 84 years old. Dr. Kennedy had a distinguished teaching career and was recognized as the “Outstanding Science Educator” by the State of Utah Former UGS Board Member Richard Kennedy Passes Away in 1994. He was a certified gemologist and appraiser and consulted in geology and mining for several companies. According to his family, he was “involved in his love of the wonders of geology throughout his life.”
  • 3. Although wetlands make up only one percent of Utah’s landscape, they provide a large number of important benefits, including water quality enhancement, flood abatement, and critical habitat for a rich diversity of birds, frogs, and other animal species. In addition to these often indirect economic benefits, wetlands also generate revenue from hunting and bird watching opportunities, and by serving as pasture or watering grounds for livestock. Wetlands include everything from predominantly dry and barren saline playas to wet meadows at the edge of springs and cattail marshes filled with nesting birds. Water is the common factor that unites these systems; all wetlands experience periods where water levels are at or above the surface of the soil. Saturation limits oxygen availability in the soil so that only plants with special adaptations can grow in the flooded, low-oxygen conditions. The Utah Geological Survey (UGS) is developing a field method to evaluate the condition of wetlands in the state using a variety of plant, hydrologic, soil, and landscape data. The method is intended to be used by a variety of practitioners, including restoration specialists, land managers, researchers, and private consultants, and will allow for comparison by Diane Menuz, Jennifer Jones, Ryhan Sempler, and Richard Emerson Wetland Monitoring in Snake Valley, Utah Developing a Method to Understand Wetland Condition between similar wetland types as well as documenting change at a site over time. Development of a Utah-specific condition assessment method will make it easier to support management decisions and effective conservation efforts at the state scale. One of the focal areas for initial method development is Snake Valley, home to numerous spring-fed wetlands in Utah’s west desert. The water in Snake Valley is predominantly used locally for growing alfalfa and hay and enhancing habitat for livestock and wildlife. Increasing concerns about additional groundwater-development pressures have been the impetus for numerous recent hydrogeology, groundwater, and wildlife resource studies in the region (see article by Hurlow and Jordan in this issue of Survey Notes). Adequate water to supply the valley’s wetlands is important to provide habitat for snail species found nowhere else on earth and wildlife species having limited habitat range (least chub and Columbia spotted frog), as well as to allow the ranching way of life to continue as it has for over 100 years. Obtaining data on current conditions of wetlands in Snake Valley and their associated water regimes is paramount to addressing and mitigating potential changes from current and future threats. Utah Geological Survey researcher Ryhan Sempler collects water quality data at Clay Springs in Snake Valley while curious horses look on. In addition to supporting domestic and wild horses, wetlands in Snake Valley are home to two habitat-restricted species of concern, least chub and Columbia spotted frog, and over 20 species of snail found nowhere else in the world. , MAY 2014  1
  • 4. Wetland condition is evaluated through examination of a site’s hydrology, plant community, soil, and surrounding landscape and comparing the status to that of natural, un- disturbed sites. Some information on wetland condition is readily apparent during brief site visits. For example, it may be easy to detect whether the hydrology has been manipulated to create unnatural flow patterns or whether a site has been overgrazed to the point where the soil is compacted and completely bare. Other indicators require substantially more time and expertise to be useful. Plant species can be powerful indicators of recent and current conditions, but using plant data to determine condition generally requires more field time during surveys, specialized knowledge to properly identify species, and an understanding of how different species respond to disturbance. The UGS began testing wetland condition assessment methods in 2010. Six out of the seven surveyed sites were in northern Snake Valley because these sites provide most of the critical wildlife habitat in the region. The sites were generally found to be in excellent condition, with only a few sites having any elements that were regarded as very disturbed. While it was important to note the relative health of the surveyed wetlands, the lack of variability in survey results hampered development of field protocols. Additional surveys were conducted in summer 2013 to expand the range of conditions captured (see map in article by Hurlow and Jordan in this issue of Survey Notes). We surveyed a total of 18 sites, including 8 sites in northern and 10 sites in southern Snake Valley. Common stressors near sites included overgrazed vegetation and soil trampling, altered hydrology due to ditching, and heavy algae formation (which sometimes indicates issues with water quality). Cover of non-native plant species and native species known to be invasive was generally low, indicating overall good site condition. A final method for assessing wetland condition in Utah and final scores for each site in Snake Valley are currently being developed and should be available by the end of the year. In addition to field surveys, the UGS has been collecting and managing data from 80 shallow wetland wells, or piezometers, that provide hourly water-level data. Sixty wells 5 to 10 feet deep were installed between October 2009 and March 2010 by the UGS and a Utah Division of Wildlife Resources (DWR) consultant, and an additional 20 wells were added in 2012 and 2013 by the DWR and UGS. Data from all wells are now downloaded biannually and managed by the UGS (http://geology.utah.gov/databases/groundwater/projects. php). Well data will allow us to determine the relationship between the timing and duration of flooding and associated plant species. We can also use the data to map water levels across wetlands, allowing us to better understand critical relationships between water levels, vegetation, and sensitive animal species. Together, this information helps us identify wetland areas that are vulnerable to changes and anticipate how those changes may affect the plants and animals that depend on them. -140 -120 -100 -80 -60 -40 -20 0 20 40 60 80 10-09 12-09 2-10 4-10 6-10 8-10 10-10 12-10 2-11 4-11 6-11 8-11 10-11 12-11 2-12 4-12 6-12 8-12 10-12 DepthtoWater(cm) Date (Water Years 2010 to 2012) Regime 1 Regime 2 Regime 3 Regime 4 Regime 5 The most common disturbances seen at wetland study sites included soil disturbance from grazing (left) and manipulation of hydrology to create or enhance pasture (above). Other important disturbances, notably changes in groundwater levels, are not easy to detect during field surveys but will be monitored through a network of shallow wetland and deep groundwater wells. Five water regimes, or patterns of the timing and duration of flooding, observed in wetlands in Snake Valley based on data from wetland wells. Plant species are closely associated with each regime, with, for example, bulrush and other species adapted to extreme inundation found in regime 1 and saltgrass dominant in the drier regimes 4 and 5. Understanding the relationship between plant species and water regimes allows predictions of expected vegetation changes with changes in water levels in the area. 2  SURVEY NOTES
  • 5. Utah Geological Survey researchers Rich Emerson and Diane Menuz download data from an automatic recording probe in a shallow wetland well on the edge of Pruess Lake in southern Snake Valley. Water level data are recorded every hour year-round and can be used to determine natural seasonal and annual fluctuations and responsiveness to groundwater manipulations. Data collected by the Utah Geological Survey researchers on water quality, soil composition, plant community, and stressors present can be used to determine how close this wetland is to a natural, undisturbed state. Diane Menuz joined the UGS in 2013 as the Assistant State Wetland Coordinator. Her work focuses on devel- oping the wetland condition assessment method for the state and implementing asso- ciated fieldwork. Prior to join- ing the UGS, Diane worked on projects modeling flow in Wisconsin streams, modeling the distribution of invasive riparian plant species in the Columbia River Basin, and conducting rare plant surveys in southern California. Ryhan Sempler was hired by the UGS in 2013 as a Wetland Specialist Technician. He is helping devel- op the wetland con- dition assessment method specific to Utah wetlands, and is involved with mod- eling surface water flow paths around Great Salt Lake. Before moving to Utah, Ryhan worked on habitat management projects for the New York State Bureau of Wildlife, helped study zoonotic diseases in Montana, and worked on various other wildlife research projects throughout the country. Rich Emerson is a geolo- gist in the UGS Groundwater and Paleontology Program, where he has worked since 2007. His work focuses on geo- graphic information system (GIS) analysis, remote sensing, wetland mapping, and collec- tion and analysis of shallow- groundwater data throughout the state. JenniferJoneshas been the State Wetland Coordina- tor since 2012, leading various projects for the UGS Wetland Section that target a variety of wetland needs for the state.  In addition to coordinating development of the condition assessment tool for Utah wet- lands, she facilitates collabora- tion among other state, local, and interest groups to devel- op wetland program planning that serves the broader group of wetland scientists in the state.  Before coming to Utah, Jen- nifer worked in wetlands in the western U.S. for eight years on projects in the Southern Rockies of Colorado and the Sierra Nevada. AuthorsAboutthe MAY 2014  3
  • 6. In March 2007 the Utah State Legislature requested the UGS to establish a groundwater-monitoring network in Snake Valley and adjacent areas, in response to concerns over potential drawdown of the water table and reduced spring flow from proposed large- by Hugh Hurlow and Lucy Jordan ") ") ") ") ") ") ") ") ") ") ") ") ") ") ") ") ") ") ") ") ") ") XW XW ^_ ^_ ^_ ^_ ^_ ^_^_^_ ^_^_ ^_ ^_ ^_ ^_ ^_ ^_ ^_ ^_ !. !. !. !. !. !. !. !. !. !. !. "/ &- &- &- &- &- &- &- &- &- &- &- "/ "/ "/ &, &, &, &- #* "/ "/ &- #* &, &- "/ XW XW XW XW XW XW " " " " " " A A A A A A A A AA AA A A A A A A A A A A A A A AA 21 19 7 20 1 2 10 17 5 6 8 4 25 23 15 13 14 9 3 26 22 12 11 16 18 27 SPRING VALLEY HELL EEK NGE DEEP CREEK RANGE KERN MTS NORTHERN SNAKE RANGE SOUTHERN SNAKE RANGE SNAKE VALLEY BURBANK HILLS MOUNTAIN HOME CONFUSION RANGE HOUSE RANGE FISH SPRINGS RANGE FISH SPRINGS FLAT TULE VALLEY GREAT SALT LAKE DESERT Callao Baker £¤50 !(21 Sevier Lake Miller Spring Foote Spring Twin Springs Leland Harris Springs Coyote Spring Kell Spring Dearden Springs Clay Spring Middle Spring North S rin Gandy Warm Springs Big Springs Needle Point Spring Granite Creek Trout Creek Salt Marsh Lake Springs Salt Marsh Lake Snake Creek Baker eve Creek Creek Eskdale Gandy Fish Springs Pruess Lake Garrison North Spring Fish Springs National Wildlife Refuge Great Basin National Park NEVADA UTAH WHITE PINE CO. LINCOLN CO. JUAB CO. MILLARD CO. TOOELE CO. JUAB CO. 32 24 31 28 30 29 43 40 3738 36 39 35 42 34 41 33 113.5° W 113.5° W 114° W 114° W 39.5° N 39.5° N 39° N 39° N Projection: Transverse Mercator, central meridian 114° W. Base map derived from USGS Digital Elevation Models and 1:250,000 scale topographic maps. 5 0 5 10 Miles 5 0 5 10 15 20 Kilometers µ Study Area Location NEVADA UTAH ^_ UGS Groundwater-Monitoring Network Numeric label is UGS site number Monitor wells in volcanic-rock aquifer&- Monitor wells in basin-fill and carbonate-rock aquifers&- Monitor wells in carbonate-rock aquifer&- New Wells and Gages (2007-2009) Monitor wells in Cambrian-Neoproterozoic siliciclastic confining unit &- Aquifer-Test Sites Nested piezometers near spring"/ Agricultural area monitor wells&, Monitor wells in basin-fill aquifer&- #* Carbonate-rock and basin-fill aquifers Carbonate-rock aquifer #* UGS spring-flow gage siteXW Other Groundwater Monitoring Sites UGS transducer in previously existing well!. Other Features Hydrographic Area boundary Perennial Stream USGS spring-flow gage siteXW SNWA point of diversion") SpringA Bishop Springs area Lake Creek Big Springs Creek Area discussed in groundwater monitoring article Wetlands Assessment Locations, 2013 UGS GROUNDWATER & SPRING FLOW MONITORING IN SNAKE VALLEY scale groundwater development projects in east-central Nevada and west-central Utah. The UGS groundwater-monitoring network was completed in spring 2009, and includes 67 newly constructed wells, 11 previously existing wells, and surface-flow gages at six springs. The objectives of the UGS ground- water-monitoring network are to (1) determine baseline temporal and spatial groundwater-level and chemi- cal trends, (2) establish groundwa- ter monitoring near the planned pumping wells and areas of current groundwater use to assess their impacts on groundwater resources, (3) monitor discharge from selected springs that host environmentally sensitive aquatic species, (4) con- duct aquifer tests to measure the hydraulic properties of, and hydraulic connectivity between, the basin-fill and carbonate-rock aquifers, and (5) evaluate groundwater-flow systems within Snake Valley and from Snake Valley to Fish Springs National Wild- life Refuge. This article focuses on our pre- liminary findings from monitoring groundwater levels and spring flow. The UGS monitoring wells have five to seven years of high-frequency (hourly) data. The U.S. Geological Survey (USGS) has collected water- level data annually for some of these wells for at least 30 years, providing a long-term context. Groundwater- level trends can be compared to precipitation data from the Great Basin National Park climate station, in a principal area of groundwater re- charge for the Snake Valley basin-fill and carbonate-rock aquifers. Near the Eskdale agricultural area in southern Snake Valley, data from UGS sites 9 and 36 show that ground- water levels vary seasonally due to local pumping for crop irrigation, and 4  SURVEY NOTES
  • 7. continued on page 9 that this cyclical variation is superposed on a trend of steadily declin- ing groundwater levels of 3.1 to 3.5 inches per year in the basin-fill and bedrock aquifers from 2007 to 2013. Long-term data from the USGS show that groundwater levels in the basin-fill aquifer have declined by about 4.2 inches per year since 1987. Data from UGS site 6, seven miles northeast of Eskdale, may help distinguish groundwater-level trends related to climate from those related to pumping. Groundwater levels at site 6 lack the cyclical fluctuations characteristic of ground- water pumping, so long-term groundwater-level trends here likely show little or no effect from pumping and result primarily from overall de- creased annual precipitation after a period of far greater-than-normal precipitation (and, presumably, recharge to the aquifers) during the early 1980s. Groundwater levels at site 6 have declined by 2.2 inches per year since 1989, which can be interpreted as the long-term cli- matic signal in the Eskdale area. Groundwater pumping, therefore, may account for at least 1 inch per year of the decline at sites 9 and 36 observed in the UGS data, and for about 2 inches per year of the decline observed in the long-term data. Groundwater levels in UGS monitor wells near other agricultural sites in Snake Valley also respond cyclically due to groundwater pumping, and show similar or greater rates of long-term decline. Groundwater levels in wells far from current agricultural pumping have declined at substantially lower rates than those near agricultural areas. Collectively the data show that in Snake Valley agricultural areas, groundwater is currently being withdrawn at rates slightly greater than it can flow to the discharge areas. Proposed large-scale groundwater- development projects would greatly expand the area and magnitude of groundwater withdrawal and discharge capture, resulting in lower groundwater levels and reduced spring flow throughout southern and central Snake Valley. Snake Valley has numerous springs that support agriculture and provide habitat for environmentally sensitive species. At the Bishop Springs area in east-central Snake Valley, the average discharge from Foote Reservoir Spring is 5.9 ± 0.1 acre-feet per day. Utah Division of Wildlife personnel removed Russian olive (Eleagnus angustifolia) trees around the reservoir and outlet stream in early 2012. Prior to tree re- moval, the spring discharge shows a slight downward trend, whereas the discharge after the trees were removed trends up. Non-native Rus- sian olive and saltcedar trees have been implicated in increased wa- ter loss from riparian systems through evapotranspiration in the West since the 1980s. Our data suggest more water is flowing in the stream channel since the removal of the trees. If verified, this result could provide an approach for the Division of Wildlife Resources to preserve in-stream flow that provides habitat for several aquatic species of con- cern in west desert spring-fed wetlands, in support of a conservation agreement that decreases the likelihood that the species will be listed by the U.S. Fish and Wildlife Service as threatened. In the southern part of the Snake Valley hydrographic area, flow from Dearden Springs supports much of the in-stream flow and shallow groundwater (i.e., underflow) in Lake Creek, which extends from the springs 9 miles downstream to Pruess Lake. The Dearden Springs– Lake Creek reach, together with the upstream Big Springs–Big Springs Creek reach in Nevada, forms a 17-mile-long surface water-groundwa- ter system, the largest and most continuous in Snake Valley. The creek and associated wet meadows are used for grazing and provide wildlife Groundwater levels near and north of Eskdale from UGS data. Site 6 shows little or no effects of groundwater pumping, and a gradual decline of ground- water levels of about 2.4 inches per year. Sites 9 and 36 show seasonal variations in groundwater levels resulting from groundwater pumping, su- perposed on a gradual decline of about 3.1 to 3.5 inches per year. Long-term groundwater levels near and north of Eskdale, and annual pre- cipitation at Great Basin National Park. The decline at site 6 may result pri- marily from decreased annual precipitation after the mid-1980s, whereas the greater rate of decline at site 36 may represent the combined effects of groundwater pumping and decreased precipitation. Site 6 (7 miles NNE of Eskdale) 4887 4892 4897 WaterLevelElevation(ftamsl) Slope: -2.2 in/yr (R = 0.92) 2 Slope: -2.6 in/yr (R = 0.97) 2 Screen Depths & Hydrogeologic Units PW06MX - 77-97 Basin-fill aquifer PW06A - 150-170 Basin-fill aquifer PW06B - 315-335 Basin-fill aquifer PW06C - 370-390 Lower Paleozoic carbonate-rock aquifer PW06D - 533-553 Lower Paleozoic carbonate-rock aquifer Groundwater levels near and north of Eskdale from UGS data. Site 6 shows little or no effects of groundwater pumping, and a gradual decline of groundwater levels of about 2.4 inches per year. Sites 9 and 36 show seasonal variations in groundwater levels resulting from groundwater pumping, superposed on a gradual decline of about 3.1 to 3.5 inches per year. 10/01/07 09/30/08 09/30/09 Date 09/30/10 09/30/11 09/29/13 4945 4950 WaterLevelElevation(ftamsl) 10/01/06 4970 4965 4955 Site 36 (1 mile E of Eskdale) 09/29/12 Screen Depths & Hydrogeologic Units Eskdale MX - 77-97 Basin-fill aquifer PW09A - 245-265 Lower Paleozoic carbonate-rock aquifer PW09B - 700-720 Lower Paleozoic carbonate-rock aquifer Slope: -3.1 in/yr (R = 0.55) 2 Slope: -3.1 in/yr (R = 0.66) 2 Slope: -3.5 in/yr (R = 0.69) 2 UGS DATA Site 9 (1.4 miles E of Eskdale) 4900 4898 4896 4894 4892 4890 WaterLevelElevation(ftamsl) 1981 1983 1985 1987 1989 1991 1993 1995 1997 1999 2001 2003 2005 2007 2009 2011 4976 4974 4972 4970 4968 4966 13 CumulativeDeparturefrom AveragePrecipitation(in) 8 3 -2 -7 Year USGS DATA Site 6 (7 miles NNE of Eskdale) Site 36 (1 mile E of Eskdale) PW06MX Eskdale MX Great Basin National Park annual precipitation Slope: -4.2 in/yr (R = 0.98) 2 Slope: -2.2 in/yr (R = 0.96) 2 Long-term groundwater levels near and north of Eskdale, and annual precipitation at Great Basin National Park. The decline at site 6 may result primarily from decreased annual precipitation after the mid-1980s, whereas the greater rate of decline at site 36 may represent the combined effects of groundwater pumping and decreased precipitation. Snake Valley surface-flow and water-level data, lithologic and geophysical logs, and well-construction information can be accessed through the UGS web-based groundwater-data server at <http://geology.utah.gov/ databases/groundwater/map.php?proj_id=1>. MAY 2014  5
  • 8. The recently published 637-page tome, At the Top of the Grand Staircase: The Late Cretaceous of Southern Utah (Indiana University Press: edited by Alan Titus and Mark Loewen) is filled with papers summarizing the geological and paleontological research on these rocks since the 1996 establishment of Grand Staircase–Escalante National Monument (GSENM). While I am a coauthor on several papers in this volume relating to new dinosaur discoveries, I also took the opportunity to finally publish my research on Utah’s freshwater elasmobranches (sharks and rays) that I had begun as a graduate student 35 years ago. This Survey Notes article briefly summarizes the results of this research. The first extensive research on the vertebrate fossils in southern Utah was not on the dinosaurs, but was in the quest for the tiny fossil mammals that had lived in the shadow of the dinosaurs. The process of recovering these fossils involves breaking down fossiliferous rock by gently washing the rock, preferably soft shales, mudstones, or poorly consolidated sandstones, through fine screens and picking out the small identifiable bones and teeth from the residues under a microscope. In this way, collections of the entire fauna can be made—not just the mammals, but the fish, salamanders, frogs, lizards, turtles, crocodiles, and even dinosaur teeth. This research, begun during the early 1980s, revealed not only that southern Utah preserved the most complete record of Late Cretaceous life on land, but that throughout the Cretaceous, Utah’s rivers hosted a variety of freshwater sharks and rays. As an aspiring young paleontologist, I was assigned the job of researching these teeth, as the “more interesting” groups of animals were already spoken for by more established scientists. As with the Cretaceous mammals, isolated teeth from the sharks and rays are useful for identifying species, and I realized that these collections contained new species that documented the entire evolutionary history for several lineages of freshwater elasmobranches. Unfortunately, the taxonomy of these fish was a mess, and it took many years of research to get a handle on this group of slippery organisms. Today, most people would not expect to catch a shark or ray while fishing in one of North America’s rivers. However, in the tropics and in the southern hemisphere, freshwater sharks and rays are characteristic of many large river systems. The Fitzroy River in eastern Australia, for example, includes a variety of sharks, sawfish, and stingrays and can be thought of as a modern analogue for the Late Cretaceous rivers of southern Utah. A comparable diversity of freshwater elasmobranches is found to have been living in Utah’s rivers throughout the last 30 million years of the Cretaceous. Hybodonts are an extinct group of sharks that were the dominant sharks for much of the Mesozoic Era following the near-extinction of sharks at the end of the Paleozoic Era. They are characterized by dorsal fin spines and small spines on their heads. There are two lineages of hybodont sharks. Hybodus is a moderately large species with a maximum length of 3 meters (10 ft), with teeth well adapted to grabbing fish. This is the only spined shark found in these rocks that was just as much at home in the ocean as it was in Utah’s rivers. Lonchidion is a smaller shark, usually less than 1 meter (3 ft) long, with long, low blade-like teeth better adapted to cutting up soft-prey animals. Among the more advanced sharks, or neoselachians, were a number of orectoloboid species that probably can be divided into two evolutionary lineages. Orectoloboid sharks are represented today by the nurse, carpet, and cat sharks. They seem to have entered into the Cretaceous river systems from an ancestry of shallow coastal sharks about 90 million years ago. They were small sharks less than 1 meter (2 ft) long with a mouth packed with tiny 1–2 millimeter (0.1 in) teeth useful for grasping and shredding small prey. One lineage, Cantioscyllium, was characterized by teeth whose primary cusp is ridged and there are lateral cusps. Through time, species of Cantioscyllium have progressively subdued the ridges on their teeth. The other lineage has been referred to the modern cat shark Chiloscyllium and is characterized by teeth lacking lateral cusps, and whose primary cusp may have shoulders that are incipiently serrated. Because the taxonomy of the modern cat sharks is complicated, with few differences in the teeth among the modern species, the assignment of these Cretaceous species to Chiloscyllium is tentative and based primarily on the taxonomy of other authors. The Upper Cretaceous of western North America represents the only time and place that this group of sharks is documented to have populated freshwater environments. by James Kirkland whensharks,rays, ruled Utah’s riverssawfish & Myledaphus bipartitus Lonchidion sp. 6  SURVEY NOTES
  • 9. The bottom-dwelling rays have repeatedly invaded fresh- water habitats throughout geological history since their origins in the Jurassic. The genus Myledaphus (“mill stone of the earth”), first recognized in the 1870s, reached the relatively large size of around 3 meters (10 ft) long prior to their extinction at the end of the Cretaceous. Initially, the large grinding teeth of this ray were thought to be the teeth of a large stingray. However, the discovery of a Myledaphus mummy at Dinosaur Provincial Park in Alberta, reported in 2005, proved that these were not freshwater stingrays, but a specialized group of the more primitive guitarfish. The abundance of fossil teeth from Utah document a lineage of primitive rays linked by having crushing teeth with a distinct mid- line crest. They originated more than 100 million years ago at the end of the Early Cretaceous with small species (Cristomylus) that got progressively larger and developed more efficiently packed teeth (Pseudomyledaphus) with more complex grinding surfaces (Myledaphus) through the Late Cretaceous. The last group is represented by two lineages of extinct Scelerorhynchiform sawfish. While looking superficially like modern sawfish, differences in the skulls and pectoral fins indicate that this group originated from guitarfish in the Early Cretaceous. They reached a greater diversity than modern sawfish and included very large species, prior to their extinction at the end of the Cretaceous. Modern sawfish (pristids) do not appear until the Eocene, about 45 million years ago. The most common Utah species are found throughout the Upper Cretaceous and have small teeth on their saw (or rostrum) and ridged, diamond-shaped teeth in their mouths. We assigned these species to the ptychotygonid Texatrygon, which appears to be related to Lebanopristis and Micropristis, which are known from complete specimens in the Middle East. Another taxon, the scelerorhychid Columbusia, is only known from its oral teeth and may have had a toothless rostrum more like that of a swordfish. These fish used their rostrums to grub for invertebrates in the sediment and to slash at small fish in more open water. After being so characteristic of Utah’s Cretaceous river systems, all of these lines of freshwater elasmobranches went extinct with the dinosaurs at the end of the Cretaceous. Perhaps the continued success of the bony fish was a result of their much higher reproductive rates. Hybodus sp. The illustrations are recreations of some of the freshwater sharks and rays characteristic of Utah’s Late Cretaceous river systems, by Russell Hawley. Texatrygon avonicola Cretaceous Fossil Teeth From Utah MAY 2014  7
  • 10. Over the past decade shale-gas plays in Texas, Arkansas, Louisiana, Oklahoma, and the northern Appalachian states have been the sites of extensive drilling programs using horizontal drilling and new hydraulic fracturing (or “fracking”) techniques (see related 2012 Survey Notes article, v. 44, no. 2, p. 8–9). Shale, a fine-grained sedimentary rock composed mainly of clay or mud, contains numerous pores (open spaces) that are very small but can store significant quantities of gas (or oil), thus serving as a hydrocarbon reservoir. The permeability (the connectivity of those pores that allows gas or liquids to flow) of shale is extremely low unless natural fracture systems are present. Horizontal wells are directed to encounter multiple natural fractures over thousands of feet, and fracking significantly increases the number of fractures and their permeability. The result of this drilling activity has been the discovery of an estimated 129 trillion cubic feet (tcf) of commercial, recoverable gas from shale in these established plays. Although Utah produces 0.4 tcf of natural gas per year, and has proven reserves of 7.0 tcf, all of this is in conventional (i.e., non-shale) reservoirs. For the past four years, the Utah Geological Survey (UGS) has been conducting a major study of potential Paleozoic- age shale-gas plays in Utah, specifically the Mississippian Manning Canyon Shale in central Utah and the Pennsylvanian Paradox Formation in southeastern Utah (see related 2011 Survey Notes article, v. 43, no. 2, p. 3–5). These approximately 300-million-year-old shale beds are widespread, thick, organic rich, naturally fractured, and buried deep enough in many areas to generate, store, and produce natural gas and oil. The study was funded in part by the Research Partnership to Secure Energy for America (RPSEA) and represents the work of UGS staff, outside geologic consultants and engineers having expertise specifically with shale reservoirs, and various petroleum service companies and labs. The objectives of the study were to (1) identify and map the major trends for target shale intervals and identify areas having the greatest gas potential, (2) characterize the geologic, geochemical, and petrophysical rock properties of those shale beds, (3) reduce exploration costs and drilling risk, especially in environmentally sensitive areas, and (4) recommend the best practices to complete and stimulate these shales to reduce development costs and maximize gas recovery. The UGS Paleozoic shale-gas study produced a number of key findings. The Manning Canyon Shale was deposited in a Manning Canyon shale-gas play area Paradox Formation shale-gas play area “Sweet spot” “Sweet spot” EXPLANATION 25 0 25 50 75 100 Miles N EW S Great Salt Lake UINTA BASIN BASIN & RANGE SanRafaelSwell PARADOX BASIN THRUS T BELT Salt Lake City Vernal Monticello Mexican Hat Richfield Moab Green River St.George Price Potential Paleozoic shale-gas play areas for the Manning Canyon Shale and Paradox Formation in Utah, and the identified “sweet spots” for each play area. shallow restricted-marine, brackish, and freshwater setting like the modern Everglades and Florida Bay. Total organic carbon in the shale varies from 1 to 15 percent. Over time, the Manning Canyon was buried deeply enough to generate natural gas. The greatest Manning Canyon potential is a 600-square-mile area surrounding Price, including the northwest end of the San Rafael Swell. Several exploration wells in the area have reported gas tests and hydrocarbon shows. Potential shale-gas reservoirs in the Paradox Formation are estimated to contain about 6.5 tcf of gas, mainly in the northeastern part of the play area (the southwestern part is more oil prone with a potential for over 250 million barrels of oil). In addition, the study shows that overlying limestone beds, such as the lower Desert Creek zone of the Paradox, may also contain significant gas reserves. The resulting UGS publication, currently in the final stages of review, is titled Paleozoic Shale-Gas Resources of the Colorado Plateau and Eastern Great Basin, Utah: Multiple Frontier Exploration Opportunities. The publication will be in digital format and is anticipated to contain 11 chapters with over 180 figures and 30 tables. These chapters include (1) a geologic overview of Utah’s potential shale-gas reservoirs, (2) the geologic setting of the Manning Canyon Shale and Paradox Formation, (3) recent drilling activity (several wells ENERGY NEWS 8  SURVEY NOTES
  • 11. (Left) UGS geologists describing and measuring an outcrop of the Chimney Rock shale (Paradox Formation) east of Mexican Hat, southeastern Utah. The organic- rich Chimney Rock is a potential shale-gas reservoir deep in the subsurface. The lower Desert Creek, which may also have gas potential, and Akah are also zones in the Paradox Formation. (Top right) Well core (slabbed) of black, organic-rich, shelly Manning Canyon Shale from a recent well south of Price, Utah. The well initially tested 468,000 cubic feet of gas per day from the Manning Canyon. (Bottom right) Microscopic view (thin section) of the Hovenweep shale (Paradox Formation) showing quartz silt (numerous white angular grains), which creates brittleness and fractures, within a muddy matrix. Successful development of shale-gas plays requires integrating accurate geologic characterization and reservoir-specific engineering practices—a major goal of the UGS study. Our study results can be used by geologists, petroleum engineers, pipeline companies, landowners and other stakeholders, and local, state, and federal government officials and decision makers for the prudent exploration and development of these potential Utah shale-gas resources. For more information on the UGS Paleozoic shale-gas study, visit our web page at geology.utah.gov/emp/shalegas/index. htm. have tested gas from shale in these formations), (4) visual descriptions of shale cores obtained from both new and old wells, (5) petrographic (microscopic) descriptions of the rocks from wells and outcrops, (6) geochemical analyses to establish organic content and maturity (capacity to generate gas) of the shales, (7) petrophysics and rock mechanics to determine porosity, permeability, and fracture potential, (8) identification of outcrop analogs, (9) a variety of thickness and top of shale (structure) maps, (10) recommendations for the best well completion practices, and (11) identification of play “sweet spots” that have the greatest shale-gas potential. Raw data, core photographs, laboratory analyses, microscopic images, etc., will be included in 21 appendices. habitat. Recent groundwater-flow models constructed by the Southern Nevada Water Authority (SNWA) and the USGS suggest that groundwa- ter pumping along the eastern flank of the southern Snake Range west of Lake Creek would severely reduce groundwater levels and spring flow in the Big Springs–Dearden Springs–Lake Creek–Pruess Lake hy- drologic/ecologic system. UGS monitoring of spring flow at Dearden Springs and Clay Spring, and groundwater levels in many wells in this area, will help quantify the impact if development occurs. UGS flow data for Dearden Springs are an essential part of an in- progress study of surface flow and groundwater-surface water interaction along Big Springs Creek–Lake Creek, associated with a monitoring agreement between the Department of the Interior and SNWA. The Dearden Springs data are also part of a monitoring and mitigation plan in the Nevada State Engineer’s decision to grant water rights to SNWA in Spring Valley, and will likely be incorporated into any future monitoring and mitigation plan associated with large- scale groundwater development in southern Snake Valley. Separating climatic and groundwater pumping signals in the data will be the main use, and challenge, of the UGS monitoring. continued from page 5 Hydrograph for Foote Reservoir Spring. Flow increased after removal of Rus- sion olive trees surrounding the impoundment and outflow stream. 0 1 2 3 4 5 6 7 8 9 10 7/1/09 7/1/10 7/1/11 7/1/12 7/1/13 7/1/14 DailyMeanDischarge(ac-ft/d) Date Foote Reservoir Spring Trend of pre-tree-removal discharge Trend of post-tree-removal discharge Tree removal late Jan/early Feb 2012 Mean Discharge 5.9 +/- 0.6 ac-ft/d (3.0 +/- 0.3 cfs) Hydrograph for Foote Reservoir Spring. Flow increased after removal of Russion olive trees surronding the impoundment and outflow stream. Bishop Springs Area UGS GROUNDWATER & SPRING FLOW MONITORING IN SNAKE VALLEY MAY 2014  9
  • 12. The Black Rock Desert is a volcanic area, or volcanic field, covering more than 700 square miles in eastern Millard County. Episodic volcanic activity has occurred here from a couple million years ago up to a few centuries ago, leaving intriguing landforms and features including volcanic cones, lava tubes, pressure ridges, and craters. This article focuses on the northeastern part of the field, which includes Black Rock Volcano, Tabernacle Hill, White Mountain, the Ice Springs lava flows, Devils Kitchen, and Pahvant Butte, all easily identifiable from Interstate 15. The Black Rock Desert lies within the Basin and Range physiographic province, which has been shaped over the past 17 million years by stretching and uplift of the Earth’s crust. Extension resulted in development of faults in the thinning crust, creating a recurrent pattern of linear north-south trending mountain ranges and valleys. Some of the faults have been conduits for magma (and water) to reach the surface; many of the volcanic cones, vents, and hot springs in the Black Rock Desert align with the faults. Currently, the Black Rock Desert may be the largest geothermal prospect in Utah. The Black Rock Desert is the youngest volcanic field in Utah and contains both Utah’s youngest known rhyolite dome, White Mountain, and its most recent eruptive event, the basalt flows at Ice Springs. Two major eruptions—at Pahvant Butte and Tabernacle Hill—occurred when Ice Age Lake Bonneville covered the area, forming volcanic islands in the lake. About 15 miles south of Fillmore, the Black Rock Volcano—a horseshoe-shaped volcanic cone—rises more than 300 feet above the valley floor between I-15 and the town of Kanosh. Volcanic cones are built of material ejected and piled up around a central volcanic vent, forming a steep, conical hill. They are called “cinder” cones when made of loose particles of volcanic rock, and “spatter” cones when gobs of ejected molten lava partially fuse the particles together. The Black Rock Volcano is one of many cones of the Black Rock Desert that are a combination of the two, known as “cinder-and-spatter” cones. Tabernacle Hill is reached by way of Lava Tubes Road, named for the caves in the area. The lava tubes, which extend for hundreds of yards, formed as the surface of lava streams cooled, solidified, and crusted over. The subterranean lava then vacated the tubes as the supply of lava diminished, leaving behind empty conduits. The central tuff ring, from which Tabernacle Hill gets its name, is a type of volcanic cone made of ash and grittier fragments (lapilli) created by explosive eruptions caused by the interaction of basaltic magma and shallow water. Only two-thirds of Tabernacle Hill’s original 3,000-foot-diameter cone remains; the northwest side has been obliterated by eruptions. The central caldera within the tuff ring is surfaced with pressure ridges and domes, which are elliptical mounds that commonly split lengthwise along their crest as molten lava pushes upward on the solidified crust of the flow. At about 400,000 years old, White Mountain is the youngest known rhyolite dome in Utah. The dome gets its name from the bright-white wind-blown gypsiferous Bonneville sands draped across the volcanic protrusion. The 160-foot-high hill consists of rhyolite, which is more viscous than basalt and tends to pile up to form domes rather than spreading out in flows. At the dome’s base is glassy-black obsidian formed by the rapid cooling of lava, with frothy, bubble-filled pumice at the top of the hill. The Ice Springs lava flows, also called “The Cinders,” were named for the natural icehouse conditions within the lava flows where ice and icicles can be found throughout the year beneath the blocky aa lava. Aa (pronounced ah ah) is characterized by its rough-textured, loosely piled and jagged appearance, and is notoriously difficult to travel across—sturdy hiking boots are recommended. Pahoehoe lava flows have an entirely different form, with a smooth, “ropey” texture. Lava flows can begin as pahoehoe and change to aa, as seen at Tabernacle Hill. The Ice geosights An 8-foot-high pressure ridge at Tabernacle Hill. Many of the ridges here are hundreds of feet long. by Jim Davis Volcanic Features in the Black Rock Desert, Millard County 10  SURVEY NOTES
  • 13. Springs lava flows cover 17 square miles—dark volcanic rock so recently extruded that little to no soil or vegetation has yet taken hold. The flows originated from a cluster of four spatter- and-cinder cones. These cones, along with several others, churned out 700 million cubic yards of lava, one flow as recently as around 600 years ago, earning the Ice Springs basalt the designation of “newest rock in Utah.” People living in the area at the time were undoubtedly mesmerized by the advance of glowing, molten rock, and people may yet again see lava erupt here in the future. North of the Ice Springs flows is Devils Kitchen, named for the hollow sound associated with its lava flow. In the days of horse and wagon when travelers traversed the flow, hoofs and wagon wheels vibrated the lava and the sound resonated through it, like tapping on a drumhead or on the flat tin roof of the devil’s kitchen. The Devils Kitchen fault forms a prominent escarpment for most of its length from the Ice Springs flows toward Pahvant Butte. The fault scarp is up to 60 feet high and exposes columnar basalt, characterized by vertically jointed columns, typically hexagonal and about two feet across, that form from the cooling and contracting of thick lava. Numerous boulders along the fault scarp have petroglyphs etched into the dark patina. Pahvant Butte, also known as “Sugarloaf,” is a major landmark in the northern Black Rock Desert. A volcanic island in Ice Age Lake Bonneville that emerged from beneath the lake surface, Pahvant Butte has a wave-cut shoreline terrace surrounding most of the tuff cone that rises almost 700 feet above this ancient beach level. The upper part of the cone consists of palagonite, a yellowish-colored rock created from the contact of basalt lava flows with water. The northwest side of Pahvant Butte is draped in the peculiar cavity-filled “lace curtain” rock that resembles dripped wax (see article by W.F. Case in Survey Notes, v. 34, no. 1). The southernmost part of the Pahvant Butte lava field disappears under the younger Ice Springs basalt flows. There are many ways to access the Black Rock Desert volcanic field, most of which involve travel over unpaved but graded dirt roads. This selected route starts in Fillmore and goes west to Ice Springs, from where you can go north to Devils Kitchen and Pahvant Butte, or south to Tabernacle Hill and White Mountain. From I-15, take either Fillmore exit, then go down Main Street and turn west on 400 North (State Route 100). Cross the I-15 overpass (where 400 N turns into 500 N to Flowell) and go 5.9 miles to 4600 West (Pahvant Heritage Trail). At this intersection you can access the northern Ice Springs flows, Devils Kitchen, and Pahvant Butte by turning right and going north and west to Clear Lake Road, or you can access the southern Ice Springs flows, Tabernacle Hill, and White Mountain by turning left and going south and west along the perimeter of the Ice Springs flows to 2300 South. Tabernacle Hill and Pahvant Butte are classified by the Bureau of Land Management (BLM) as Areas of Critical Environmental Concern (ACEC) because they are unusual vol- canic features and because of their important historic, wildlife, and scenic val- ues. A visit to the BLM office in Fillmore is a good way to get information, di- rections, maps, and current con- ditions: 95 East 500 North, Fill- more, UT, 84631, (435) 743-3100. how to get there (Above left) Entrance to a lava tube at Tabernacle Hill. (Above right) Inside a lava tube with skylights at Tabernacle Hill. Skylights may be original to the lava flow, or the cave ceiling could have collapsed after formation of the cave. 500 N 200 S Clear Lake Rd. 400 N 4600W 2300 S LavaTubesRd. 6400W 4000 S Black Rock Volcano Kanosh Hatton Meadow Flowell Fillmore 0 4Miles Holden Pahvant Butte Devils Kitchen Ice Springs Tabernacle Hill White Mtn. DevilsKitchenFault $ MAY 2014  11
  • 14. Utah may be famous for its red rock, but the official state rock is coal. I was recently asked by a child, “Do you like coal?” “Yes.” But, it can leave a black mess on your hands and clothes, and if you are naughty at Christmas you might find a lump of it in your stocking. And there are worse associations: “anthrax” is derived from the Greek word for coal (the skin disease causes lesions that are as black as coal), burning high-sulfur coal contributes to acid rain (note that Utah’s coals are low in sulfur), and coal is a major source of mercury pollution (again, Utah’s coals contain relatively low amounts of mercury). So, what are the positive aspects of coal that led it to be designated as Utah’s state rock? Coal has historical importance in Utah and was mined in the territory as early as the 1850s. By the 1860s mines at Coalville in Summit County supplied coal to Salt Lake City. Historically, coal was used to heat houses and power trains, contributing in a substantial way to Utah’s early growth. The Utah State Legislature designated coal as Utah’s state rock in 1991, long after such uses were commonplace. Despite no longer being commonly used for trains or heating, in 1991 Utah coal mines produced almost 44 BILLION pounds of coal (22 million tons), valued at $795 million (inflation-adjusted). More recently (2013), Utah mines produced roughly 34 billion pounds (17 million tons) of coal, valued at $579 million. When I talk to groups of school kids, I often find that neither they nor their parents know what coal is used for today. I tell them to look up, because the lights above their heads are likely powered by coal-fired power plants. In Utah, approximately 81 percent of our electricity generation is derived from coal; the rest of Utah’s generation comes from natural gas (15 percent), hydroelectric (1.5 percent), and other sources (2.5 percent). Beyond Utah, coal accounts for 43 percent of U.S. and 41 percent of global electrical production. Another way to look at it, approximately 96 percent of coal mined in Utah is burned to generate electricity. The remaining 4 percent is mainly used by industrial plants, in kilns and furnaces. The historical significance, usefulness, and economic contributions of coal justified its designation as Utah’s official state rock, but how is it formed and why does this rock burn? Coal is formed of ancient plant matter. Plants (and some algae and bacteria) use the energy of sunlight to convert carbon dioxide in the atmosphere to carbon-based sugars through photosynthesis. Plants then use these sugars to build cellulose or other complex carbon molecules that comprise plant’s leafy and woody matter. When high concentrations of plants die and accumulate in bogs and wetlands with low-oxygen conditions, burial, heat, and pressure can convert plant matter to coal. Coal is the long- term storage vessel of the carbon-based energy of plants. When coal is burned the stored energy is converted to heat, which can be used to turn turbines that create the electrical energy used in our homes and industries. When not turned to coal, the carbon-based energy of plants can be consumed by animals and become part of the food chain, and either released back to the atmosphere through burning or decomposition, or stored in soil as detritus. This cycling of carbon, from the atmosphere to plants to animals, soil, or coal and back to the atmosphere, is part of the Earth’s larger carbon cycle (oceans are a major part of complex carbon cycling). When we mine and burn coal and other fossil fuels such as oil and gas, we are removing carbon from long-term storage within the Earth and releasing it to the atmosphere as carbon dioxide. In addition to being vital for photosynthesis, atmospheric carbon dioxide is also an important greenhouse gas. When carbon dioxide is maintained at a relatively constant level in our atmosphere, it helps moderate our planet’s temperature. However, since the Industrial Revolution, we have been removing large quantities of carbon from storage and transferring it to the atmosphere (Utah’s coal only accounts for 0.2 percent of the nearly 16 TRILLION pounds [8 billion tons] of coal mined globally in 2012). The vast majority of scientists agree that this increasing carbon dioxide in the atmosphere is the largest driver of global warming. So is Utah’s state rock good, bad, or ugly? The answer certainly depends on who you ask, for coal has elements of good and elements of bad. As for beauty, that is in the eye of the beholder. Is coal beautiful? Victorian England apparently thought so. Jet, a variety of coal that can be carved and polished, was popular mourning jewelry from the 1860s to the 1880s. Pictured is a pendant that is dedicated, “DWS Fell Asleep June 27th 1870 Aged 17.” Photo courtesy of Barbara Robbins, www.artofmourning.com. Coal became Utah’s official state rock in 1991. In 2013 Utah mines produced roughly 17 million tons of coal valued at $579 million, ranking us 15th among 25 U.S. coal producing states. Photo by Michael Vanden Berg. GLAD YOU ASKED by Mark Milligan IS UTAH’S STATE ROCK GOOD, BAD, OR UGLY? 12  SURVEY NOTES
  • 15. Geologic hazards of the State Route 9 Corridor, La Verkin City to Town of Springdale, Washington County, Utah, by Tyler R. Knudsen and William R. Lund, DVD (13 p., 9 pl. [contains GIS data]), ISBN 978-1-55791-880-2, Special Study 148......................................................................$24.95 Investigation of land subsidence and earth fissures in Cedar Valley, Iron County, Utah, by Tyler Knudsen, Paul Inkenbrandt, William Lund, Mike Lowe, and Steve Bowman, CD (84 p. + 8 appendices), ISBN 978-1-55791-891-8, Special Study 150.......................................................................$19.95 Utah’s extractive resource industries 2012, by Taylor Boden, Michael Vanden Berg, Ken Krahulec, and Dave Tabet, 29 p., ISBN 978-1-55791-884-0, Circular 116.....................................$9.95 The Pony Express basaltic ash: a stratigraphic marker in Lake Bonneville sediments, Utah, by Charles G. Oviatt and Barbara P. Nash, CD (10 p.), ISBN 978-1-55791-890-1, Miscellaneous Publication 14-1................................................$9.95 The Gilbert episode in the Great Salt Lake Basin, Utah, by Charles G. Oviatt, CD (20 p.), ISBN 978-1-55791-893-2, Miscellaneous Publication 14-3............................................$14.95 Preliminary isostatic residual gravity map of the New- foundland Mountains and east part of the Wells 30’ x 60’ quadrangles, Box Elder County, Utah, by V.E. Langenheim, H. Willis, N.D. Athens, B.A. Chuchel, S.M. Kraushaar, J. Rosario, J. Roza, and C.L. Hardwick, CD (3 p., 1 pl., 3 data files), ISBN 978- 1-55791-879-6, Miscellaneous Publication 13-4................$14.95 Geologic map of the Brian Head quadrangle, Iron County, Utah, by Peter D. Rowley, Robert F. Biek, Edward G. Sable, Jonathan T. Boswell, Garrett S. Vice, Stanley C. Hatfield, David J. Maxwell, and John J. Anderson, CD (38 p., 2 pl. [contains GIS data]), scale 1:24,000, ISBN 978-1-55791-881-9, Map 263DM..............................................................................$24.95 New Publications Geologic map of the Saint John quadrangle, Tooele County, Utah, by Stefan M. Kirby, CD (8 p., 2 pl. [contains GIS data]), scale 1:24,000, ISBN 978-1-55791-885-7, Map 264DM.....$24.95 Geologic map of the Faust quadrangle, Tooele County, Utah, by Stefan M. Kirby, DVD (8 p., 2 pl. [contains GIS data]), scale 1:24,000, ISBN 978-1-55791-886-4, Map 265DM..............$24.95 Geologic map of the Vernon NE quadrangle, Tooele County, Utah, by Stefan M. Kirby, CD (6 p., 2 pl. [contains GIS data]), scale 1:24,000, ISBN 978-1-55791-887-1, Map 266DM......$24.95 Regional groundwater flow and water quality in the Virgin River Basin and surrounding areas, Utah and Arizona, by Paul Inkenbrandt, Kevin Thomas, and J. Lucy Jordan, CD (46 p. + 4 p. appendix), ISBN 978-1-55791-883-3, Report of Investigation 272......................................................................$19.95 Investigation of the December 12, 2013, fatal rock fall at 368 West Main Street, Rockville, Utah, by William R. Lund, Tyler R. Knudsen, and Steve D. Bowman, CD (20 p.), ISBN 978-1-55791-895-6, Report of Investigation 273..........$14.95 Interim geologic map of the Cedar City 7.5-minute quadrangle, Iron County, Utah, by Tyler R. Knudsen, CD (20 p., 2 pl.), scale 1:24,000, Open-File Report 626................$14.95 Interim geologic map of the Cedar City NW quadrangle, Iron County, Utah, by Tyler R. Knudsen and Robert F. Biek, CD (18 p., 2 pl.), scale 1:24,000, Open-File Report 627........$14.95 Interim geologic map of the Enoch quad-rangle, Iron County, Utah, by Tyler R. Knudsen, CD (12 p., 2 pl.), scale 1:24,000, Open-File Report 628............................................................$14.95 The majority of Utah’s electicity generation is produced by coal- fired power plants. This percentage is likely to drop as power plants such as the Intermountain Power Plant convert to cleaner burning natural gas. Data from the U.S. Energy Information Administration. Coal 81% Natural Gas Hydroelectric 1.5% Other 2.5% 15% UTAH’S ELECTRICITY BY SOURCEThe Intermountain Power Plant (IPP) is a large, coal-fired power plant near Delta, Millard County. IPP has a capacity of 1,900 MW, enough to serve roughly 1.5 million households. About 75% of the power produced by IPP is exported to Southern California. Photo by Michael Vanden Berg. MAY 2014  13
  • 16. PRSRT STD U.S. Postage PAID Salt Lake City, UT Permit No. 4728 UTAH GEOLOGICAL SURVEY 1594 W North Temple, Suite 3110 Box 146100 Salt Lake City, UT 84114-6100 Address service requested Survey Notes FOLLOW US! UGS TwitterUGS Blog geology.utah.gov/blog UGS Facebook NATURAL RESOURCES MAP & BOOKSTORE mapstore.utah.gov 1594 W. North Temple Salt Lake City, UT 84116 801.537.3320 or 1.888.UTAHMAP Monday–Friday 8 am–5 pm The Groundwater and Paleontology Program welcomes Nathan Payne as the new GIS analyst. He comes to us from Utah State University where he recently graduated with a Bachelor of Science in Geography. Congratulations to Tom Chidsey who was named the 2013 UGS Employee of the Year. Tom is a senior scientist with the Energy and Minerals Program and has worked at the UGS for 25 years. For 23 of those years, Tom served as Petroleum Section chief. Tom never settles for the minimum required, but always goes above and beyond. He has consistently produced a high volume of superb quality work, having published over 100 technical papers. He has impeccable character and integrity, and has brought praise to the UGS from organizations such as the American Association of Petroleum Geologists and Brigham Young University. Tom is a role-model employee, carrying a heavy workload capably and cheerfully, and is a deserving recipient of the UGS Employee of the Year Award. 2013 UGS Employee of the Year Employee News SURVEY NEWS