SlideShare a Scribd company logo
1 of 9
Units Sold 54000
Column Entry January February March April May June July August September October November December Year to Date Total
Gross Sales Revenue $0 $0 $0 $0 $86,400 $43,200 $129,600 $302,400 $0 $216,000 $172,800 $21,600 $972,000
Gross Monthly Invoice Amounts (ref.) $0 $0 $0 $0 $0 $0 $0 $0 $0 $0 $0 $0 $0
Direct Sales to Superstore Retailer $0 $0 $0 $0 $86,400 $43,200 $129,600 $302,400 $0 $216,000 $172,800 $0 $950,400
Total # Superstore Sales 0 0 0 0 2 1 1 2 0 1 1 0 8
Direct Sales to Distributor $0 $0 $0 $0 $0 $0 $0 $0 $0 $0 $0 $21,600 $21,600
Total # Distributor Sales 0 0 0 0 0 0 0 0 0 0 0 1 1
International Direct Sales to Distributor $0 $0 $0 $0 $0 $0 $0 $0 $0 $0 $0 $0 $0
Total # Intl. Distributor Sales 0 0 0 0 0 0 0 0 0 0 5 0 5
International Royalties in Perpituity $0 $0 $0 $0 $0 $0 $0 $0 $0 $0 $0 $0 $0
Total # Licensse Payments 0 0 0 0 0 0 0 0 0 0 0 0 0
Cust. Paid Ship Out Costs $0 $0 $0 $0 $0 $0 $0 $0 $0 $0 $0 $0 $0
Revenue (Non-Sales Revenue) $300,000 $0 $0 $0 $0 $0 $0 $0 $0 $0 $0 ($150,000) $150,000
Revenue from Interest $0 $0 $0 $0 $0 $0 $0 $0 $0 $0 $0 $0 $0
Revenue from Investments or Loans $300,000 $0 $0 $0 $0 $0 $0 $0 $0 $0 $0 ($150,000) $150,000
Gross Revenue Total $300,000 $0 $0 $0 $86,400 $43,200 $129,600 $302,400 $0 $216,000 $172,800 ($128,400) $1,122,000
Direct Cost of Total Sales $180 $180 $3,180 $180 $45,131 $28,656 $67,607 $169,509 $180 $118,558 $96,082 $11,418 $540,859
COG to Superstore Retailer $0 $0 $0 $0 $43,223 $21,612 $64,835 $151,281 $0 $108,058 $86,446 $0 $475,453
COG to Distributor $0 $0 $0 $0 $0 $0 $0 $0 $0 $0 $0 $10,806 $10,806
COG to International Distributor $0 $0 $0 $0 $0 $0 $0 $0 $0 $0 $0 $0 $0
Landed Costs - Imported Components $0 $0 $3,000 $0 $0 $6,000 $0 $12,000 $0 $6,000 $6,000 $0 $33,000
Purchase Order Factoring Fee $0 $0 $0 $0 $1,728 $864 $2,592 $6,048 $0 $4,320 $3,456 $432 $19,440
Product Liability Insurance $180 $180 $180 $180 $180 $180 $180 $180 $180 $180 $180 $180 $2,160
Outbound Shipping Costs $0 $0 $0 $0 $0 $0 $0 $0 $0 $0 $0 $0 $0
Cost to Replace Damaged / Lost Goods $0 $0 $0 $0 $0 $0 $0 $0 $0 $0 $0 $0 $0
Total Compensation Paid Costs $9,222 $9,222 $9,222 $15,576 $9,222 $9,222 $15,576 $15,576 $21,577 $21,577 $15,399 $21,577 $172,966
Employee Compensation Costs $8,375 $8,375 $8,375 $14,135 $8,375 $8,375 $14,135 $14,135 $19,575 $19,575 $13,975 $19,575 $156,980
Stock Holder Dividends $0 $0 $0 $0 $0 $0 $0 $0 $0 $0 $0 $0 $0
ACP Matched Employee Witholding Costs $641 $641 $641 $1,081 $641 $641 $1,081 $1,081 $1,497 $1,497 $1,069 $1,497 $12,009
ACP Employer Paid Costs $206 $206 $206 $359 $206 $206 $359 $359 $504 $504 $355 $504 $3,977
Sub-Contractor Labor & Comissions $0 $0 $0 $0 $0 $0 $0 $0 $0 $0 $0 $0 $0
Fixed Costs Total $500 $500 $500 $3,100 $500 $1,100 $4,250 $4,250 $4,250 $4,250 $4,250 $4,250 $31,700
Office, Assembly and Warehouse $0 $0 $0 $2,600 $0 $600 $3,750 $3,750 $3,750 $3,750 $3,750 $3,750 $25,700
Remote Office Rent $500 $500 $500 $500 $500 $500 $500 $500 $500 $500 $500 $500 $6,000
Indirect Costs Total $91,295 $1,025 $78,675 $13,976 $8,675 $175 $9,217 $7,159 $7,925 $2,867 $2,867 $1,325 $225,182
Advertising & Promotion $0 $0 $0 $1,901 $0 $0 $100 $0 $100 $0 $0 $0 $2,101
General Supplies $0 $0 $0 $0 $0 $0 $0 $0 $0 $0 $0 $0 $0
Packaging Supplies $0 $0 $0 $500 $0 $0 $1,042 $2,083 $0 $1,042 $1,042 $0 $5,708
Shipping Charges (misc.) $0 $0 $0 $1,400 $0 $0 $0 $0 $0 $0 $0 $0 $1,400
Office Phones $0 $0 $0 $0 $0 $0 $150 $150 $150 $150 $150 $150 $900
Utilities $0 $0 $0 $0 $0 $0 $1,250 $1,750 $1,000 $1,500 $1,500 $1,000 $8,000
Maintenance $0 $0 $0 $0 $0 $0 $0 $0 $0 $0 $0 $0 $0
Internet Services $75 $75 $75 $75 $75 $75 $75 $75 $75 $75 $75 $75 $902
Professional Services (Accounting & Legal) $11,950 $850 $0 $0 $0 $0 $0 $0 $0 $0 $0 $0 $12,800
Bank Fees $0 $0 $0 $0 $0 $0 $0 $0 $0 $0 $0 $0 $0
Interest Paid On Late Payments & Loans $0 $0 $0 $0 $0 $0 $0 $0 $0 $0 $0 $0 $0
Insurance $100 $100 $100 $100 $100 $100 $100 $100 $100 $100 $100 $100 $1,200
Business Licenses and Patent Fees $3,970 $0 $0 $0 $0 $0 $0 $0 $0 $0 $0 $0 $3,970
Tax Fees : Federal, State, and Local $0 $0 $0 $0 $0 $0 $0 $0 $0 $0 $0 $0 $0
Travel Mileage Costs $200.00 $0.00 $0.00 $0.00 $0.00 $0.00 $0.00 $0.00 $0.00 $0.00 $0.00 $0.00 $200
Aprox. Miles Driven 357 0 0 0 0 0 0 0 0 0 0 0 357
Business Meals $0 $0 $0 $0 $0 $0 $0 $0 $0 $0 $0 $0 $0
Travel, Lodging and or Show Event $0 $0 $3,500 $7,000 $8,500 $0 $3,500 $0 $3,500 $0 $0 $0 $26,000
Tools & Equipment (under $250) $0 $0 $0 $0 $0 $0 $0 $0 $0 $0 $0 $0 $0
Tools & Equipment (over $250) $75,000 $0 $75,000 $3,000 $0 $0 $3,000 $3,000 $3,000 $0 $0 $0 $162,000
Net Product Profit Before Costs $300,000 $0 $0 $0 $43,177 $21,589 $64,766 $151,120 $0 $107,943 $86,354 ($139,206) $635,741
Direct Sales to Superstore Retailer $0 $0 $0 $0 $43,177 $21,589 $64,766 $151,120 $0 $107,943 $86,354 $0 $474,947
Direct Sales to Distributor $0 $0 $0 $0 $0 $0 $0 $0 $0 $0 $0 $10,794 $10,794
International Direct Sales to Distributor $0 $0 $0 $0 $0 $0 $0 $0 $0 $0 $0 $0 $0
International Royalties in Perpituity $0 $0 $0 $0 $0 $0 $0 $0 $0 $0 $0 $0 $0
Net Profit After Costs $198,803 ($10,927) ($91,577) ($32,832) $22,872 $4,047 $32,951 $105,907 ($33,932) $68,749 $54,202 ($166,970) $151,294
Net Profit Margin After Cost #DIV/0! #DIV/0! #DIV/0! #DIV/0! 26% 9% 25% 35% #DIV/0! 32% 31% -79% #DIV/0!
Total Units Sold 602400
Column Entry January February March April May June July August September October November December Year to Date Total
Gross Sales Revenue $777,600 $864,000 $820,800 $864,000 $820,800 $864,000 $820,800 $864,000 $820,800 $864,000 $820,800 $864,000 $10,065,600
Gross Monthly Invoice Amounts (ref.) $0 $0 $0 $0 $0 $0 $0 $0 $0 $0 $0 $0 $0
Direct Sales to Superstore Retailer $777,600 $777,600 $777,600 $777,600 $777,600 $777,600 $777,600 $777,600 $777,600 $777,600 $777,600 $777,600 $9,331,200
Total # Superstore Sales 3 3 3 3 6 6 6 6 3 6 6 3 54
Direct Sales to Distributor $0 $86,400 $0 $86,400 $0 $86,400 $0 $86,400 $0 $86,400 $0 $86,400 $518,400
Total # Distributor Sales 0 1 0 1 0 1 0 1 0 1 0 1 6
International Direct Sales to Distributor $0 $0 $43,200 $0 $43,200 $0 $43,200 $0 $43,200 $0 $43,200 $0 $216,000
Total # Intl. Distributor Sales 0 0 1 0 1 0 1 0 1 0 9 0 13
International Royalties in Perpituity $0 $0 $0 $0 $0 $0 $0 $0 $0 $0 $0 $0 $216,000
Total # Licensse Payments 0 0 0 0 0 0 0 0 0 0 0 0 0
Cust. Paid Ship Out Costs $0 $0 $0 $0 $0 $0 $0 $0 $0 $0 $0 $0 $0
Revenue (Non-Sales Revenue) $0 $0 $0 $0 $0 $0 $0 $0 $0 $0 $0 $0 $0
Revenue from Interest $0 $0 $0 $0 $0 $0 $0 $0 $0 $0 $0 $0 $0
Revenue from Investments or Loans $0 $0 $0 $0 $0 $0 $0 $0 $0 $0 $0 $0 $0
Gross Revenue Total $777,600 $864,000 $820,800 $864,000 $820,800 $864,000 $820,800 $864,000 $820,800 $864,000 $820,800 $864,000 $10,065,600
Direct Cost of Total Sales $430,659 $475,610 $453,135 $475,610 $453,135 $475,610 $453,135 $475,610 $453,135 $475,610 $453,135 $475,610 $5,549,992
COG to Superstore Retailer $389,007 $389,007 $389,007 $389,007 $389,007 $389,007 $389,007 $389,007 $389,007 $389,007 $389,007 $389,007 $4,668,084
COG to Distributor $0 $43,223 $0 $43,223 $0 $43,223 $0 $43,223 $0 $43,223 $0 $43,223 $259,338
COG to International Distributor $0 $0 $21,612 $0 $21,612 $0 $21,612 $0 $21,612 $0 $21,612 $0 $108,058
Landed Costs - Imported Components $25,920 $25,920 $25,920 $25,920 $25,920 $25,920 $25,920 $25,920 $25,920 $25,920 $25,920 $25,920 $311,040
Purchase Order Factoring Fee $15,552 $17,280 $16,416 $17,280 $16,416 $17,280 $16,416 $17,280 $16,416 $17,280 $16,416 $17,280 $201,312
Product Liability Insurance $180 $180 $180 $180 $180 $180 $180 $180 $180 $180 $180 $180 $2,160
Outbound Shipping Costs $0 $0 $0 $0 $0 $0 $0 $0 $0 $0 $0 $0 $0
Cost to Replace Damaged / Lost Goods $0 $0 $0 $0 $0 $0 $0 $0 $0 $0 $0 $0 $0
Total Compensation Paid Costs $69,019 $69,019 $69,019 $69,019 $69,019 $69,019 $69,019 $69,019 $69,019 $69,019 $69,019 $69,019 $828,223
Employee Compensation Costs $62,595 $62,595 $62,595 $62,595 $62,595 $62,595 $62,595 $62,595 $62,595 $62,595 $62,595 $62,595 $751,140
Stock Holder Dividends $0 $0 $0 $0 $0 $0 $0 $0 $0 $0 $0 $0 $0
ACP Matched Employee Witholding Costs $4,789 $4,789 $4,789 $4,789 $4,789 $4,789 $4,789 $4,789 $4,789 $4,789 $4,789 $4,789 $57,462
ACP Employer Paid Costs $1,635 $1,635 $1,635 $1,635 $1,635 $1,635 $1,635 $1,635 $1,635 $1,635 $1,635 $1,635 $19,621
Sub-Contractor Labor & Comissions $0 $0 $0 $0 $0 $0 $0 $0 $0 $0 $0 $0 $0
Fixed Costs Total $4,250 $4,250 $4,250 $4,250 $4,250 $4,250 $4,250 $4,250 $4,250 $4,250 $4,250 $4,250 $51,000
Office, Assembly and Warehouse $3,750 $3,750 $3,750 $3,750 $3,750 $3,750 $3,750 $3,750 $3,750 $3,750 $3,750 $3,750 $45,000
Remote Office Rent $500 $500 $500 $500 $500 $500 $500 $500 $500 $500 $500 $500 $6,000
Indirect Costs Total $9,825 $7,325 $10,575 $7,325 $7,075 $7,325 $10,575 $7,325 $10,575 $7,325 $7,075 $7,325 $99,652
Advertising & Promotion $0 $0 $0 $0 $0 $0 $0 $0 $0 $0 $0 $0 $0
General Supplies $0 $0 $0 $0 $0 $0 $0 $0 $0 $0 $0 $0 $0
Packaging Supplies $4,500 $5,000 $4,750 $5,000 $4,750 $5,000 $4,750 $5,000 $4,750 $5,000 $4,750 $5,000 $58,250
Shipping Charges (misc.) $0 $0 $0 $0 $0 $0 $0 $0 $0 $0 $0 $0 $0
Office Phones $150 $150 $150 $150 $150 $150 $150 $150 $150 $150 $150 $150 $1,800
Utilities $2,000 $2,000 $2,000 $2,000 $2,000 $2,000 $2,000 $2,000 $2,000 $2,000 $2,000 $2,000 $24,000
Maintenance $0 $0 $0 $0 $0 $0 $0 $0 $0 $0 $0 $0 $0
Internet Services $75 $75 $75 $75 $75 $75 $75 $75 $75 $75 $75 $75 $902
Professional Services (Accounting & Legal) $0 $0 $0 $0 $0 $0 $0 $0 $0 $0 $0 $0 $0
Bank Fees $0 $0 $0 $0 $0 $0 $0 $0 $0 $0 $0 $0 $0
Interest Paid On Late Payments & Loans $0 $0 $0 $0 $0 $0 $0 $0 $0 $0 $0 $0 $0
Insurance $100 $100 $100 $100 $100 $100 $100 $100 $100 $100 $100 $100 $1,200
Business Licenses and Patent Fees $0 $0 $0 $0 $0 $0 $0 $0 $0 $0 $0 $0 $0
Tax Fees : Federal, State, and Local $0 $0 $0 $0 $0 $0 $0 $0 $0 $0 $0 $0 $0
Travel Mileage Costs $0.00 $0.00 $0.00 $0.00 $0.00 $0.00 $0.00 $0.00 $0.00 $0.00 $0.00 $0.00 $0
Aprox. Miles Driven 0 0 0 0 0 0 0 0 0 0 0 0 0
Business Meals $0 $0 $0 $0 $0 $0 $0 $0 $0 $0 $0 $0 $0
Travel, Lodging and or Show Event $0 $0 $3,500 $0 $0 $0 $3,500 $0 $3,500 $0 $0 $0 $10,500
Tools & Equipment (under $250) $0 $0 $0 $0 $0 $0 $0 $0 $0 $0 $0 $0 $0
Tools & Equipment (over $250) $3,000 $0 $0 $0 $0 $0 $0 $0 $0 $0 $0 $0 $3,000
Net Product Profit Before Costs $388,593 $431,770 $410,182 $431,770 $410,182 $431,770 $410,182 $431,770 $410,182 $431,770 $410,182 $431,770 $5,030,121
Direct Sales to Superstore Retailer $388,593 $388,593 $388,593 $388,593 $388,593 $388,593 $388,593 $388,593 $388,593 $388,593 $388,593 $388,593 $4,663,116
Direct Sales to Distributor $0 $43,177 $0 $43,177 $0 $43,177 $0 $43,177 $0 $43,177 $0 $43,177 $259,062
International Direct Sales to Distributor $0 $0 $21,589 $0 $21,589 $0 $21,589 $0 $21,589 $0 $21,589 $0 $107,943
International Royalties in Perpituity $0 $0 $0 $0 $0 $0 $0 $0 $0 $0 $0 $0 $0
Net Profit After Costs $263,847 $307,796 $283,822 $307,796 $287,322 $307,796 $283,822 $307,796 $283,822 $307,796 $287,322 $307,796 $3,536,733
Net Profit Margin After Cost 34% 36% 35% 36% 35% 36% 35% 36% 35% 36% 35% 36% 35%
Location :
3,000 Sqf. Needed
$1.25 Cost per Sqf. NNN
Department Area Requirement
Aproximate
Area Size
Sqf.
Needed
Administration
Office1 - President - Product Developer 10'x20' 200
Office2 - Operations Manager 10'x15' 150
Office3 - Bookkeeping 10'x15' 150
Media Dept.
Office4a - PR Media Rep - Domestic 10'x8' 80 2 11,185 22,370
Office4b - PR Media Rep - International 10'x8' 80
2 11,185 22,370
Sales Dept. Monthly Mfg. Capacity : 44,740
Office4c - Sales Rep - Domestic 10'x8' 80
Office4d - Sales Rep - International 10'x8' 80
Assembly and QC Area
Office5 - Production Manager 10'x10' 100
(1) 10K Unit Monthly Shift Team 10'x20' 200
Product Packaging Area
Supports (1) 10K Unit Monthly Shift Team 10'x8' 80
Shipping and Receiving Dept.
Shipping and Receiving Bench and Area 10'x20' 200
Warehouse
Receiving - CounterWatch Parts/Components 10'x20' 200
General Inventory Stock 10'x20' 200
Pending Domestic Dispatch 10'x20' 200
Pending International Dispatch 10'x20' 200
TOTAL : 2,480 Sqf. Workspace Area
CounterWatch™
Manufacturing Facility
Mfg. Facility Specifics
TBD - Low Cost Area
Desk and Shelving.
Desk and Shelving.
CounterWatch™
Monthly Production Capacity
CounterWatch™ Employee Facilities
$3,750.00CounterWatch™ : AVG MFG FACILITY Cost :
Night Shift Teams
Day Shift Teams
(1) 3'x5' Bench
Assembly & QC Depts.
Packaging Dept.
Desk and Shelving.
(4) 3'x5' Tech Benches
(1) 3'x5' Bench
Storage Racks-Shelves.
Desk and Shelving.
Desk and Shelving.
Desk and File Cabinets.
Furnishings and Equipment
Large "L" Desk and Shelving.
Front Office
Media & Sales Depts.
Desk and Shelving.
Storage Racks-Shelves.
(1) 6'x8' Bench and Shelving.
Shipping Dept. & Warehouse
CounterWatch™ : AVG MFG Cost per Unit : $9.00
CounterWatch™ : DIST. Cost per Unit : $18.00 50% MFG GM Selling to DIST.
CounterWatch™ : DLR Cost per Unit : $21.25 15% DIST GM Selling Wholesale to Retailer
CounterWatch™ : MSRP : $46.95 55% Retailer GM Selling MSRP to Customer
Part or Component
Source
Country Vendor Name
1k-10K Unit
Cost
Unit Cost @
10k-50K
Unit Cost @
50k-100K
Electronic Components - China
1) DC Motor - Gear Reduction China Various $3.00 $2.00 $1.75
2) Integrated Electronics PCB China TBD $2.50 $2.25 $1.85
- Landed Costs of Imported Components
1) SGS, Shipping, Duties & Brokerage Fees China Port Landed Under MOQ $0.60 $0.50
cost of imported goods @ 25%
TOTAL : Under MOQ $4.85 $4.10
Plastic Injected Parts - Outside Contractor
1) Lower Chassis USA Mold House Under MOQ $0.69 $0.50
2) Top Cover Housing USA Mold House Under MOQ $0.69 $0.50
3) Spray Fluid Reservior Assy. USA Mold House Under MOQ $0.52 $0.50
4) Spray Fluid Pump Assy. USA Mold House Under MOQ $0.14 $0.10
TOTAL : Under MOQ $2.04 $1.60
Plastic Injected Parts - Outside Contractor
1) Spray Fluid Nozzle Assy. USA Delta Industries Under MOQ $0.30 $0.20
Miscellaneous Parts - Vendors
1) O-Ring Type Seals (Piston & Nozzle) USA Parker Seals $0.0020 $0.0017 $0.0015
2) Fluid Pickup Tube & Filter USA McMaster Carr $0.0020 $0.0017 $0.0015
3) Check Valve Spring USA McMaster Carr $0.0020 $0.0017 $0.0015
4) Check Valve Balls USA McMaster Carr $0.0020 $0.0017 $0.0015
5) Fastener Screws USA Various $0.0020 $0.0017 $0.0015
TOTAL : Under MOQ $0.0085 $0.0075
Assembly Labor - Labor
1) Labor - Assemble and QC Test USA Self or Various $0.85 $0.85 $0.85
Packaging Cost
1) Clamshell Packaging for CounterWatch USA Impact Mfg Under MOQ $0.75 $0.70
2) Pack in Clamshell Packaging USA Self or Various $0.15 $0.10 $0.05
TOTAL Cost per Unit : Under MOQ $9.75 $8.26
Possible to cut cost up to 15%.
CounterWatch™
Manufacturing Cost - COG Per Assembled & Packaged Unit
Channel Gross Margins
Notes
Possible to cut cost up to 10%.
Possible to cut cost up to 25%.
Possible to cut cost up to 15%.
CounterWatch™ : AVG MFG Cost per Unit : $9.00
CounterWatch™ : DIST. Cost per Unit : $18.00 50% MFG GM Selling to DIST.
CounterWatch™ : DLR Cost per Unit : $21.25 15% DIST GM Selling Wholesale to Retailer
CounterWatch™ : MSRP : $46.95 55% Retailer GM Selling MSRP to Customer
Produciton Shift Team
Employee
Wage
Time Needed
in Minutes
Product Step
Cost
Assembly Tech - Assembly Labor $14.50 - -
UPPER TOP COVER HOUSING
1) Install Electronic Component PCB $14.50 0.15 $0.04
2) Install Voice Module Speaker $14.50 0.15 $0.04
3) Install Battery Contact Rails & Cover $14.50 0.15 $0.04$14.50
LOWER CHASSIS $14.50
1) Install Voice Module Mic & Switches $14.50 0.15 $0.04 Assy Tech1 23 173
2) Install Spray Fluid Pump $14.50 0.15 $0.04 Assy Tech2 23 173
3) Install DC Motor Gear Reduction Motor $14.50 0.15 $0.04 Assy Tech3 23 173
4) Install Spray Reservior Pickup Tube and Filter $14.50 0.10 $0.02 TOTAL : 519
$14.50
SPRAY FLUID RESERVOIR NOZZLE $14.50
1) Assemble Spray Nozzle $14.50 0.20 $0.05 QC Tech1 69 520
2) Affix Spray Nozzle to Housing $14.50 0.15 $0.04
$14.50
SPRAY FLUID RESERVOIR $14.50
1) Bond Spray Fluid Reservior to Lower Chassis $14.50 0.60 $0.15 Units
2) Install O-Ring to Fill Plug Screw to Reservior $14.50 0.15 $0.04 Weekly Production 2,601
ASSEMBLE TOP COVER TO LOWER CHASSIS Monthly Production 11,185
1) Connect Wire Harness $14.50 0.10 $0.02
2) Connect Spray Nozzle Tube to Pump $14.50 0.10 $0.02 Monthly
3) Affix Top Cover to Lower Chassis (4) Screws 0.20 $0.05 Mfg. to DIST. Profit $100,611
4) Affix Rubber Feet Pads atop (4) Screws 0.10 $0.02 Mfg. Labor Cost Total $24,768
$14.50
TOTAL Assembly Time & Cost : 2.6 $0.63 $75,843
QC Tech - Quality Control Labor $15.50
TEST COUNTERWATCH FOR OPERATION
Test for Leakage and Operation $15.50 0.9 $0.22
TOTAL QC Time & Cost : 0.87 $0.22
TOTAL Production Labor : 3.465 min @ $0.85 Mfg. Labor Cost
Monthly Shift Team Nets :
Per Shift Team
CounterWatch™
Manufacturing Production Labor Cost - 10K Units Monthly Shift Team
Channel Gross Margins
(3) Assy. Techs & (1) QC Tech
CounterWatch™ Units Built
Per Shift Team
Employee
Units per
Hour
Units per
Shift
Shift Hours 7.5
Short-Term Investment Loan Fund up to $300,000
Product Launch to Market Phase or for Startup Year Manufacturing
________________________________________________________________________________________________________________________________________________________
Type Date
Funded
Loan
Amount
Loan Term
In Years
APR % ROI Amount
(P&I)
1 2 22.50% $0
2 2 22.50% $0
3 2 22.50% $0
4 2 22.50% $0
5 2 22.50% $0
6 2 22.50% $0
7 2 22.50% $0
8 2 22.50% $0
9 2 22.50% $0
10 2 22.50% $0
11 2 22.50% $0
12 2 22.50% $0
13 2 22.50% $0
14 2 22.50% $0
15 2 22.50% $0
16 2 22.50% $0
17 2 22.50% $0
18 2 22.50% $0
19 2 22.50% $0
20 2 22.50% $0
21 2 22.50% $0
22 2 22.50% $0
23 2 22.50% $0
24 2 22.50% $0
25 2 22.50% $0
Total Amount of Loans : $0 Term Interest : $0
Level 1 - $1,000+
Level 2 - $25,000+
Level 3 - $50,000+
Investor Name
List of Foreign Exclusive Manufacturing and or Distribution Licensees
________________________________________________________________________________________________________________________________________________________
Country -
Licensee Name
Date of
License
Licensing Fee
Royalty Advance
Term of License Royalty Paid
to Licensor
Canada
Multi-Vet Ltd.
TBA $100,000
Non-Refundable
5 years
Renewable
5% of Gross
Annual Sales
CounterWatch™
AUTOMATIC SPRAY DETERRENT SYSTEM
USPTO Private PAIR Registered; Inventor #126527
Current IP Status of Utility Patent
PATENT PENDING
Reg. No. 14486090
Filed 09/15/14
Current IP Status of Design Patent
PATENT PENDING
Reg. No. 29507159
Filed 10/24/14
Current IP Status of USPTO PCT Foreign Filing
Awaiting Investor Capital Infusion.
Reg. No. TBA
To be Filed TBA
Current Registered Trademark Status
Reg. No. TBA
To be Filed 10/30/14 CounterWatch™
Sentry
Emerge Products, LLC
Seattle, WA USA
Website :
TBA
Contact Info :
Shawn Tait
ShawnT98027@live.com
425.753.0802

More Related Content

Viewers also liked

Ultrasonidos y Ecografos Portátiles (HUMAN)
Ultrasonidos y Ecografos Portátiles (HUMAN)Ultrasonidos y Ecografos Portátiles (HUMAN)
Ultrasonidos y Ecografos Portátiles (HUMAN)Guillermo Uribe
 
Textos recreativos2.
Textos recreativos2. Textos recreativos2.
Textos recreativos2. anggie1233
 
Intranet & Digital Workplace Transformation
Intranet & Digital Workplace TransformationIntranet & Digital Workplace Transformation
Intranet & Digital Workplace TransformationThomas Maeder
 
Common mistakes by beginners in Programming
Common mistakes by beginners in ProgrammingCommon mistakes by beginners in Programming
Common mistakes by beginners in ProgrammingDejan Toteff
 
Alibaba le géant du e-commerce chinois
Alibaba le géant du e-commerce chinoisAlibaba le géant du e-commerce chinois
Alibaba le géant du e-commerce chinoisMbark Cherguia
 
Best practices in business development
Best practices in business developmentBest practices in business development
Best practices in business developmentDavid Fatlowitz
 

Viewers also liked (9)

VOEUX 2015
VOEUX 2015 VOEUX 2015
VOEUX 2015
 
Ultrasonidos y Ecografos Portátiles (HUMAN)
Ultrasonidos y Ecografos Portátiles (HUMAN)Ultrasonidos y Ecografos Portátiles (HUMAN)
Ultrasonidos y Ecografos Portátiles (HUMAN)
 
Textos recreativos2.
Textos recreativos2. Textos recreativos2.
Textos recreativos2.
 
Intranet & Digital Workplace Transformation
Intranet & Digital Workplace TransformationIntranet & Digital Workplace Transformation
Intranet & Digital Workplace Transformation
 
Introduction to shell
Introduction to shellIntroduction to shell
Introduction to shell
 
Common mistakes by beginners in Programming
Common mistakes by beginners in ProgrammingCommon mistakes by beginners in Programming
Common mistakes by beginners in Programming
 
Outsourcing administrative tasks
Outsourcing administrative tasksOutsourcing administrative tasks
Outsourcing administrative tasks
 
Alibaba le géant du e-commerce chinois
Alibaba le géant du e-commerce chinoisAlibaba le géant du e-commerce chinois
Alibaba le géant du e-commerce chinois
 
Best practices in business development
Best practices in business developmentBest practices in business development
Best practices in business development
 

CounterWatch™ - Investor Presentation Financial Forecast 2015-2016

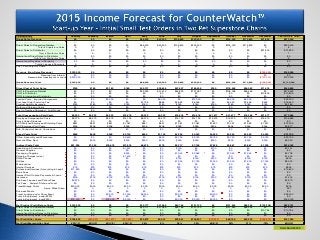
  • 1. Units Sold 54000 Column Entry January February March April May June July August September October November December Year to Date Total Gross Sales Revenue $0 $0 $0 $0 $86,400 $43,200 $129,600 $302,400 $0 $216,000 $172,800 $21,600 $972,000 Gross Monthly Invoice Amounts (ref.) $0 $0 $0 $0 $0 $0 $0 $0 $0 $0 $0 $0 $0 Direct Sales to Superstore Retailer $0 $0 $0 $0 $86,400 $43,200 $129,600 $302,400 $0 $216,000 $172,800 $0 $950,400 Total # Superstore Sales 0 0 0 0 2 1 1 2 0 1 1 0 8 Direct Sales to Distributor $0 $0 $0 $0 $0 $0 $0 $0 $0 $0 $0 $21,600 $21,600 Total # Distributor Sales 0 0 0 0 0 0 0 0 0 0 0 1 1 International Direct Sales to Distributor $0 $0 $0 $0 $0 $0 $0 $0 $0 $0 $0 $0 $0 Total # Intl. Distributor Sales 0 0 0 0 0 0 0 0 0 0 5 0 5 International Royalties in Perpituity $0 $0 $0 $0 $0 $0 $0 $0 $0 $0 $0 $0 $0 Total # Licensse Payments 0 0 0 0 0 0 0 0 0 0 0 0 0 Cust. Paid Ship Out Costs $0 $0 $0 $0 $0 $0 $0 $0 $0 $0 $0 $0 $0 Revenue (Non-Sales Revenue) $300,000 $0 $0 $0 $0 $0 $0 $0 $0 $0 $0 ($150,000) $150,000 Revenue from Interest $0 $0 $0 $0 $0 $0 $0 $0 $0 $0 $0 $0 $0 Revenue from Investments or Loans $300,000 $0 $0 $0 $0 $0 $0 $0 $0 $0 $0 ($150,000) $150,000 Gross Revenue Total $300,000 $0 $0 $0 $86,400 $43,200 $129,600 $302,400 $0 $216,000 $172,800 ($128,400) $1,122,000 Direct Cost of Total Sales $180 $180 $3,180 $180 $45,131 $28,656 $67,607 $169,509 $180 $118,558 $96,082 $11,418 $540,859 COG to Superstore Retailer $0 $0 $0 $0 $43,223 $21,612 $64,835 $151,281 $0 $108,058 $86,446 $0 $475,453 COG to Distributor $0 $0 $0 $0 $0 $0 $0 $0 $0 $0 $0 $10,806 $10,806 COG to International Distributor $0 $0 $0 $0 $0 $0 $0 $0 $0 $0 $0 $0 $0 Landed Costs - Imported Components $0 $0 $3,000 $0 $0 $6,000 $0 $12,000 $0 $6,000 $6,000 $0 $33,000 Purchase Order Factoring Fee $0 $0 $0 $0 $1,728 $864 $2,592 $6,048 $0 $4,320 $3,456 $432 $19,440 Product Liability Insurance $180 $180 $180 $180 $180 $180 $180 $180 $180 $180 $180 $180 $2,160 Outbound Shipping Costs $0 $0 $0 $0 $0 $0 $0 $0 $0 $0 $0 $0 $0 Cost to Replace Damaged / Lost Goods $0 $0 $0 $0 $0 $0 $0 $0 $0 $0 $0 $0 $0 Total Compensation Paid Costs $9,222 $9,222 $9,222 $15,576 $9,222 $9,222 $15,576 $15,576 $21,577 $21,577 $15,399 $21,577 $172,966 Employee Compensation Costs $8,375 $8,375 $8,375 $14,135 $8,375 $8,375 $14,135 $14,135 $19,575 $19,575 $13,975 $19,575 $156,980 Stock Holder Dividends $0 $0 $0 $0 $0 $0 $0 $0 $0 $0 $0 $0 $0 ACP Matched Employee Witholding Costs $641 $641 $641 $1,081 $641 $641 $1,081 $1,081 $1,497 $1,497 $1,069 $1,497 $12,009 ACP Employer Paid Costs $206 $206 $206 $359 $206 $206 $359 $359 $504 $504 $355 $504 $3,977 Sub-Contractor Labor & Comissions $0 $0 $0 $0 $0 $0 $0 $0 $0 $0 $0 $0 $0 Fixed Costs Total $500 $500 $500 $3,100 $500 $1,100 $4,250 $4,250 $4,250 $4,250 $4,250 $4,250 $31,700 Office, Assembly and Warehouse $0 $0 $0 $2,600 $0 $600 $3,750 $3,750 $3,750 $3,750 $3,750 $3,750 $25,700 Remote Office Rent $500 $500 $500 $500 $500 $500 $500 $500 $500 $500 $500 $500 $6,000 Indirect Costs Total $91,295 $1,025 $78,675 $13,976 $8,675 $175 $9,217 $7,159 $7,925 $2,867 $2,867 $1,325 $225,182 Advertising & Promotion $0 $0 $0 $1,901 $0 $0 $100 $0 $100 $0 $0 $0 $2,101 General Supplies $0 $0 $0 $0 $0 $0 $0 $0 $0 $0 $0 $0 $0 Packaging Supplies $0 $0 $0 $500 $0 $0 $1,042 $2,083 $0 $1,042 $1,042 $0 $5,708 Shipping Charges (misc.) $0 $0 $0 $1,400 $0 $0 $0 $0 $0 $0 $0 $0 $1,400 Office Phones $0 $0 $0 $0 $0 $0 $150 $150 $150 $150 $150 $150 $900 Utilities $0 $0 $0 $0 $0 $0 $1,250 $1,750 $1,000 $1,500 $1,500 $1,000 $8,000 Maintenance $0 $0 $0 $0 $0 $0 $0 $0 $0 $0 $0 $0 $0 Internet Services $75 $75 $75 $75 $75 $75 $75 $75 $75 $75 $75 $75 $902 Professional Services (Accounting & Legal) $11,950 $850 $0 $0 $0 $0 $0 $0 $0 $0 $0 $0 $12,800 Bank Fees $0 $0 $0 $0 $0 $0 $0 $0 $0 $0 $0 $0 $0 Interest Paid On Late Payments & Loans $0 $0 $0 $0 $0 $0 $0 $0 $0 $0 $0 $0 $0 Insurance $100 $100 $100 $100 $100 $100 $100 $100 $100 $100 $100 $100 $1,200 Business Licenses and Patent Fees $3,970 $0 $0 $0 $0 $0 $0 $0 $0 $0 $0 $0 $3,970 Tax Fees : Federal, State, and Local $0 $0 $0 $0 $0 $0 $0 $0 $0 $0 $0 $0 $0 Travel Mileage Costs $200.00 $0.00 $0.00 $0.00 $0.00 $0.00 $0.00 $0.00 $0.00 $0.00 $0.00 $0.00 $200 Aprox. Miles Driven 357 0 0 0 0 0 0 0 0 0 0 0 357 Business Meals $0 $0 $0 $0 $0 $0 $0 $0 $0 $0 $0 $0 $0 Travel, Lodging and or Show Event $0 $0 $3,500 $7,000 $8,500 $0 $3,500 $0 $3,500 $0 $0 $0 $26,000 Tools & Equipment (under $250) $0 $0 $0 $0 $0 $0 $0 $0 $0 $0 $0 $0 $0 Tools & Equipment (over $250) $75,000 $0 $75,000 $3,000 $0 $0 $3,000 $3,000 $3,000 $0 $0 $0 $162,000 Net Product Profit Before Costs $300,000 $0 $0 $0 $43,177 $21,589 $64,766 $151,120 $0 $107,943 $86,354 ($139,206) $635,741 Direct Sales to Superstore Retailer $0 $0 $0 $0 $43,177 $21,589 $64,766 $151,120 $0 $107,943 $86,354 $0 $474,947 Direct Sales to Distributor $0 $0 $0 $0 $0 $0 $0 $0 $0 $0 $0 $10,794 $10,794 International Direct Sales to Distributor $0 $0 $0 $0 $0 $0 $0 $0 $0 $0 $0 $0 $0 International Royalties in Perpituity $0 $0 $0 $0 $0 $0 $0 $0 $0 $0 $0 $0 $0 Net Profit After Costs $198,803 ($10,927) ($91,577) ($32,832) $22,872 $4,047 $32,951 $105,907 ($33,932) $68,749 $54,202 ($166,970) $151,294 Net Profit Margin After Cost #DIV/0! #DIV/0! #DIV/0! #DIV/0! 26% 9% 25% 35% #DIV/0! 32% 31% -79% #DIV/0!
  • 2. Total Units Sold 602400 Column Entry January February March April May June July August September October November December Year to Date Total Gross Sales Revenue $777,600 $864,000 $820,800 $864,000 $820,800 $864,000 $820,800 $864,000 $820,800 $864,000 $820,800 $864,000 $10,065,600 Gross Monthly Invoice Amounts (ref.) $0 $0 $0 $0 $0 $0 $0 $0 $0 $0 $0 $0 $0 Direct Sales to Superstore Retailer $777,600 $777,600 $777,600 $777,600 $777,600 $777,600 $777,600 $777,600 $777,600 $777,600 $777,600 $777,600 $9,331,200 Total # Superstore Sales 3 3 3 3 6 6 6 6 3 6 6 3 54 Direct Sales to Distributor $0 $86,400 $0 $86,400 $0 $86,400 $0 $86,400 $0 $86,400 $0 $86,400 $518,400 Total # Distributor Sales 0 1 0 1 0 1 0 1 0 1 0 1 6 International Direct Sales to Distributor $0 $0 $43,200 $0 $43,200 $0 $43,200 $0 $43,200 $0 $43,200 $0 $216,000 Total # Intl. Distributor Sales 0 0 1 0 1 0 1 0 1 0 9 0 13 International Royalties in Perpituity $0 $0 $0 $0 $0 $0 $0 $0 $0 $0 $0 $0 $216,000 Total # Licensse Payments 0 0 0 0 0 0 0 0 0 0 0 0 0 Cust. Paid Ship Out Costs $0 $0 $0 $0 $0 $0 $0 $0 $0 $0 $0 $0 $0 Revenue (Non-Sales Revenue) $0 $0 $0 $0 $0 $0 $0 $0 $0 $0 $0 $0 $0 Revenue from Interest $0 $0 $0 $0 $0 $0 $0 $0 $0 $0 $0 $0 $0 Revenue from Investments or Loans $0 $0 $0 $0 $0 $0 $0 $0 $0 $0 $0 $0 $0 Gross Revenue Total $777,600 $864,000 $820,800 $864,000 $820,800 $864,000 $820,800 $864,000 $820,800 $864,000 $820,800 $864,000 $10,065,600 Direct Cost of Total Sales $430,659 $475,610 $453,135 $475,610 $453,135 $475,610 $453,135 $475,610 $453,135 $475,610 $453,135 $475,610 $5,549,992 COG to Superstore Retailer $389,007 $389,007 $389,007 $389,007 $389,007 $389,007 $389,007 $389,007 $389,007 $389,007 $389,007 $389,007 $4,668,084 COG to Distributor $0 $43,223 $0 $43,223 $0 $43,223 $0 $43,223 $0 $43,223 $0 $43,223 $259,338 COG to International Distributor $0 $0 $21,612 $0 $21,612 $0 $21,612 $0 $21,612 $0 $21,612 $0 $108,058 Landed Costs - Imported Components $25,920 $25,920 $25,920 $25,920 $25,920 $25,920 $25,920 $25,920 $25,920 $25,920 $25,920 $25,920 $311,040 Purchase Order Factoring Fee $15,552 $17,280 $16,416 $17,280 $16,416 $17,280 $16,416 $17,280 $16,416 $17,280 $16,416 $17,280 $201,312 Product Liability Insurance $180 $180 $180 $180 $180 $180 $180 $180 $180 $180 $180 $180 $2,160 Outbound Shipping Costs $0 $0 $0 $0 $0 $0 $0 $0 $0 $0 $0 $0 $0 Cost to Replace Damaged / Lost Goods $0 $0 $0 $0 $0 $0 $0 $0 $0 $0 $0 $0 $0 Total Compensation Paid Costs $69,019 $69,019 $69,019 $69,019 $69,019 $69,019 $69,019 $69,019 $69,019 $69,019 $69,019 $69,019 $828,223 Employee Compensation Costs $62,595 $62,595 $62,595 $62,595 $62,595 $62,595 $62,595 $62,595 $62,595 $62,595 $62,595 $62,595 $751,140 Stock Holder Dividends $0 $0 $0 $0 $0 $0 $0 $0 $0 $0 $0 $0 $0 ACP Matched Employee Witholding Costs $4,789 $4,789 $4,789 $4,789 $4,789 $4,789 $4,789 $4,789 $4,789 $4,789 $4,789 $4,789 $57,462 ACP Employer Paid Costs $1,635 $1,635 $1,635 $1,635 $1,635 $1,635 $1,635 $1,635 $1,635 $1,635 $1,635 $1,635 $19,621 Sub-Contractor Labor & Comissions $0 $0 $0 $0 $0 $0 $0 $0 $0 $0 $0 $0 $0 Fixed Costs Total $4,250 $4,250 $4,250 $4,250 $4,250 $4,250 $4,250 $4,250 $4,250 $4,250 $4,250 $4,250 $51,000 Office, Assembly and Warehouse $3,750 $3,750 $3,750 $3,750 $3,750 $3,750 $3,750 $3,750 $3,750 $3,750 $3,750 $3,750 $45,000 Remote Office Rent $500 $500 $500 $500 $500 $500 $500 $500 $500 $500 $500 $500 $6,000 Indirect Costs Total $9,825 $7,325 $10,575 $7,325 $7,075 $7,325 $10,575 $7,325 $10,575 $7,325 $7,075 $7,325 $99,652 Advertising & Promotion $0 $0 $0 $0 $0 $0 $0 $0 $0 $0 $0 $0 $0 General Supplies $0 $0 $0 $0 $0 $0 $0 $0 $0 $0 $0 $0 $0 Packaging Supplies $4,500 $5,000 $4,750 $5,000 $4,750 $5,000 $4,750 $5,000 $4,750 $5,000 $4,750 $5,000 $58,250 Shipping Charges (misc.) $0 $0 $0 $0 $0 $0 $0 $0 $0 $0 $0 $0 $0 Office Phones $150 $150 $150 $150 $150 $150 $150 $150 $150 $150 $150 $150 $1,800 Utilities $2,000 $2,000 $2,000 $2,000 $2,000 $2,000 $2,000 $2,000 $2,000 $2,000 $2,000 $2,000 $24,000 Maintenance $0 $0 $0 $0 $0 $0 $0 $0 $0 $0 $0 $0 $0 Internet Services $75 $75 $75 $75 $75 $75 $75 $75 $75 $75 $75 $75 $902 Professional Services (Accounting & Legal) $0 $0 $0 $0 $0 $0 $0 $0 $0 $0 $0 $0 $0 Bank Fees $0 $0 $0 $0 $0 $0 $0 $0 $0 $0 $0 $0 $0 Interest Paid On Late Payments & Loans $0 $0 $0 $0 $0 $0 $0 $0 $0 $0 $0 $0 $0 Insurance $100 $100 $100 $100 $100 $100 $100 $100 $100 $100 $100 $100 $1,200 Business Licenses and Patent Fees $0 $0 $0 $0 $0 $0 $0 $0 $0 $0 $0 $0 $0 Tax Fees : Federal, State, and Local $0 $0 $0 $0 $0 $0 $0 $0 $0 $0 $0 $0 $0 Travel Mileage Costs $0.00 $0.00 $0.00 $0.00 $0.00 $0.00 $0.00 $0.00 $0.00 $0.00 $0.00 $0.00 $0 Aprox. Miles Driven 0 0 0 0 0 0 0 0 0 0 0 0 0 Business Meals $0 $0 $0 $0 $0 $0 $0 $0 $0 $0 $0 $0 $0 Travel, Lodging and or Show Event $0 $0 $3,500 $0 $0 $0 $3,500 $0 $3,500 $0 $0 $0 $10,500 Tools & Equipment (under $250) $0 $0 $0 $0 $0 $0 $0 $0 $0 $0 $0 $0 $0 Tools & Equipment (over $250) $3,000 $0 $0 $0 $0 $0 $0 $0 $0 $0 $0 $0 $3,000 Net Product Profit Before Costs $388,593 $431,770 $410,182 $431,770 $410,182 $431,770 $410,182 $431,770 $410,182 $431,770 $410,182 $431,770 $5,030,121 Direct Sales to Superstore Retailer $388,593 $388,593 $388,593 $388,593 $388,593 $388,593 $388,593 $388,593 $388,593 $388,593 $388,593 $388,593 $4,663,116 Direct Sales to Distributor $0 $43,177 $0 $43,177 $0 $43,177 $0 $43,177 $0 $43,177 $0 $43,177 $259,062 International Direct Sales to Distributor $0 $0 $21,589 $0 $21,589 $0 $21,589 $0 $21,589 $0 $21,589 $0 $107,943 International Royalties in Perpituity $0 $0 $0 $0 $0 $0 $0 $0 $0 $0 $0 $0 $0 Net Profit After Costs $263,847 $307,796 $283,822 $307,796 $287,322 $307,796 $283,822 $307,796 $283,822 $307,796 $287,322 $307,796 $3,536,733 Net Profit Margin After Cost 34% 36% 35% 36% 35% 36% 35% 36% 35% 36% 35% 36% 35%
  • 3. Location : 3,000 Sqf. Needed $1.25 Cost per Sqf. NNN Department Area Requirement Aproximate Area Size Sqf. Needed Administration Office1 - President - Product Developer 10'x20' 200 Office2 - Operations Manager 10'x15' 150 Office3 - Bookkeeping 10'x15' 150 Media Dept. Office4a - PR Media Rep - Domestic 10'x8' 80 2 11,185 22,370 Office4b - PR Media Rep - International 10'x8' 80 2 11,185 22,370 Sales Dept. Monthly Mfg. Capacity : 44,740 Office4c - Sales Rep - Domestic 10'x8' 80 Office4d - Sales Rep - International 10'x8' 80 Assembly and QC Area Office5 - Production Manager 10'x10' 100 (1) 10K Unit Monthly Shift Team 10'x20' 200 (1) 10K Unit Monthly Shift Team 10'x20' 200 Product Packaging Area Supports (1) 10K Unit Monthly Shift Team 10'x8' 80 Supports (1) 10K Unit Monthly Shift Team 10'x8' 80 Shipping and Receiving Dept. Shipping and Receiving Bench and Area 10'x20' 200 Warehouse Receiving - CounterWatch Parts/Components 10'x20' 200 General Inventory Stock 10'x20' 200 Pending Domestic Dispatch 10'x20' 200 Pending International Dispatch 10'x20' 200 TOTAL : 2,480 Sqf. Workspace Area CounterWatch™ Manufacturing Facility Mfg. Facility Specifics TBD - Low Cost Area Desk and Shelving. Desk and Shelving. CounterWatch™ Monthly Production Capacity CounterWatch™ Employee Facilities $3,750.00CounterWatch™ : AVG MFG FACILITY Cost : Night Shift Teams Day Shift Teams (1) 3'x5' Bench Assembly & QC Depts. Packaging Dept. Desk and Shelving. (4) 3'x5' Tech Benches (4) 3'x5' Tech Benches (1) 3'x5' Bench Storage Racks-Shelves. Storage Racks-Shelves. Desk and Shelving. Desk and Shelving. Desk and File Cabinets. Furnishings and Equipment Large "L" Desk and Shelving. Front Office Media & Sales Depts. Desk and Shelving. Storage Racks-Shelves. Storage Racks-Shelves. (1) 6'x8' Bench and Shelving. Shipping Dept. & Warehouse
  • 4. CounterWatch™ : AVG MFG Cost per Unit : $9.00 CounterWatch™ : DIST. Cost per Unit : $18.00 50% MFG GM Selling to DIST. CounterWatch™ : DLR Cost per Unit : $21.25 15% DIST GM Selling Wholesale to Retailer CounterWatch™ : MSRP : $46.95 55% Retailer GM Selling MSRP to Customer Part or Component Source Country Vendor Name 1k-10K Unit Cost Unit Cost @ 10k-50K Unit Cost @ 50k-100K Electronic Components - China 1) DC Motor - Gear Reduction China Various $3.00 $2.00 $1.75 2) Integrated Electronics PCB China TBD $2.50 $2.25 $1.85 - Landed Costs of Imported Components 1) SGS, Shipping, Duties & Brokerage Fees China Port Landed Under MOQ $0.60 $0.50 cost of imported goods @ 25% TOTAL : Under MOQ $4.85 $4.10 Plastic Injected Parts - Outside Contractor 1) Lower Chassis USA Mold House Under MOQ $0.69 $0.50 2) Top Cover Housing USA Mold House Under MOQ $0.69 $0.50 3) Spray Fluid Reservior Assy. USA Mold House Under MOQ $0.52 $0.50 4) Spray Fluid Pump Assy. USA Mold House Under MOQ $0.14 $0.10 TOTAL : Under MOQ $2.04 $1.60 Plastic Injected Parts - Outside Contractor 1) Spray Fluid Nozzle Assy. USA Delta Industries Under MOQ $0.30 $0.20 Miscellaneous Parts - Vendors 1) O-Ring Type Seals (Piston & Nozzle) USA Parker Seals $0.0020 $0.0017 $0.0015 2) Fluid Pickup Tube & Filter USA McMaster Carr $0.0020 $0.0017 $0.0015 3) Check Valve Spring USA McMaster Carr $0.0020 $0.0017 $0.0015 4) Check Valve Balls USA McMaster Carr $0.0020 $0.0017 $0.0015 5) Fastener Screws USA Various $0.0020 $0.0017 $0.0015 TOTAL : Under MOQ $0.0085 $0.0075 Assembly Labor - Labor 1) Labor - Assemble and QC Test USA Self or Various $0.85 $0.85 $0.85 Packaging Cost 1) Clamshell Packaging for CounterWatch USA Impact Mfg Under MOQ $0.75 $0.70 2) Pack in Clamshell Packaging USA Self or Various $0.15 $0.10 $0.05 TOTAL Cost per Unit : Under MOQ $9.75 $8.26 Possible to cut cost up to 15%. CounterWatch™ Manufacturing Cost - COG Per Assembled & Packaged Unit Channel Gross Margins Notes Possible to cut cost up to 10%. Possible to cut cost up to 25%. Possible to cut cost up to 25%. Possible to cut cost up to 15%.
  • 5. CounterWatch™ : AVG MFG Cost per Unit : $9.00 CounterWatch™ : DIST. Cost per Unit : $18.00 50% MFG GM Selling to DIST. CounterWatch™ : DLR Cost per Unit : $21.25 15% DIST GM Selling Wholesale to Retailer CounterWatch™ : MSRP : $46.95 55% Retailer GM Selling MSRP to Customer Produciton Shift Team Employee Wage Time Needed in Minutes Product Step Cost Assembly Tech - Assembly Labor $14.50 - - UPPER TOP COVER HOUSING 1) Install Electronic Component PCB $14.50 0.15 $0.04 2) Install Voice Module Speaker $14.50 0.15 $0.04 3) Install Battery Contact Rails & Cover $14.50 0.15 $0.04$14.50 LOWER CHASSIS $14.50 1) Install Voice Module Mic & Switches $14.50 0.15 $0.04 Assy Tech1 23 173 2) Install Spray Fluid Pump $14.50 0.15 $0.04 Assy Tech2 23 173 3) Install DC Motor Gear Reduction Motor $14.50 0.15 $0.04 Assy Tech3 23 173 4) Install Spray Reservior Pickup Tube and Filter $14.50 0.10 $0.02 TOTAL : 519 $14.50 SPRAY FLUID RESERVOIR NOZZLE $14.50 1) Assemble Spray Nozzle $14.50 0.20 $0.05 QC Tech1 69 520 2) Affix Spray Nozzle to Housing $14.50 0.15 $0.04 $14.50 SPRAY FLUID RESERVOIR $14.50 1) Bond Spray Fluid Reservior to Lower Chassis $14.50 0.60 $0.15 Units 2) Install O-Ring to Fill Plug Screw to Reservior $14.50 0.15 $0.04 Weekly Production 2,601 ASSEMBLE TOP COVER TO LOWER CHASSIS Monthly Production 11,185 1) Connect Wire Harness $14.50 0.10 $0.02 2) Connect Spray Nozzle Tube to Pump $14.50 0.10 $0.02 Monthly 3) Affix Top Cover to Lower Chassis (4) Screws 0.20 $0.05 Mfg. to DIST. Profit $100,611 4) Affix Rubber Feet Pads atop (4) Screws 0.10 $0.02 Mfg. Labor Cost Total $24,768 $14.50 TOTAL Assembly Time & Cost : 2.6 $0.63 $75,843 QC Tech - Quality Control Labor $15.50 TEST COUNTERWATCH FOR OPERATION Test for Leakage and Operation $15.50 0.9 $0.22 TOTAL QC Time & Cost : 0.87 $0.22 TOTAL Production Labor : 3.465 min @ $0.85 Mfg. Labor Cost Monthly Shift Team Nets : Per Shift Team CounterWatch™ Manufacturing Production Labor Cost - 10K Units Monthly Shift Team Channel Gross Margins (3) Assy. Techs & (1) QC Tech CounterWatch™ Units Built Per Shift Team Employee Units per Hour Units per Shift Shift Hours 7.5
  • 6. Short-Term Investment Loan Fund up to $300,000 Product Launch to Market Phase or for Startup Year Manufacturing ________________________________________________________________________________________________________________________________________________________ Type Date Funded Loan Amount Loan Term In Years APR % ROI Amount (P&I) 1 2 22.50% $0 2 2 22.50% $0 3 2 22.50% $0 4 2 22.50% $0 5 2 22.50% $0 6 2 22.50% $0 7 2 22.50% $0 8 2 22.50% $0 9 2 22.50% $0 10 2 22.50% $0 11 2 22.50% $0 12 2 22.50% $0 13 2 22.50% $0 14 2 22.50% $0 15 2 22.50% $0 16 2 22.50% $0 17 2 22.50% $0 18 2 22.50% $0 19 2 22.50% $0 20 2 22.50% $0 21 2 22.50% $0 22 2 22.50% $0 23 2 22.50% $0 24 2 22.50% $0 25 2 22.50% $0 Total Amount of Loans : $0 Term Interest : $0 Level 1 - $1,000+ Level 2 - $25,000+ Level 3 - $50,000+ Investor Name
  • 7. List of Foreign Exclusive Manufacturing and or Distribution Licensees ________________________________________________________________________________________________________________________________________________________ Country - Licensee Name Date of License Licensing Fee Royalty Advance Term of License Royalty Paid to Licensor Canada Multi-Vet Ltd. TBA $100,000 Non-Refundable 5 years Renewable 5% of Gross Annual Sales
  • 8. CounterWatch™ AUTOMATIC SPRAY DETERRENT SYSTEM USPTO Private PAIR Registered; Inventor #126527 Current IP Status of Utility Patent PATENT PENDING Reg. No. 14486090 Filed 09/15/14 Current IP Status of Design Patent PATENT PENDING Reg. No. 29507159 Filed 10/24/14 Current IP Status of USPTO PCT Foreign Filing Awaiting Investor Capital Infusion. Reg. No. TBA To be Filed TBA Current Registered Trademark Status Reg. No. TBA To be Filed 10/30/14 CounterWatch™ Sentry
  • 9. Emerge Products, LLC Seattle, WA USA Website : TBA Contact Info : Shawn Tait ShawnT98027@live.com 425.753.0802