SlideShare a Scribd company logo
1 of 24
The Floods of March 2010Examining Observed and Future Impacts of Increased Rainfall and Flooding David R. ValleeHydrologist-in-ChargeNWS/Northeast River Forecast Centerhttp://weather.gov/nerfc Providence Street – West Warwick, RI at 1030 am Wednesday 3/31/10
The NOAA Hurricane Outlook for the Atlantic  Basin! But first:  A Public Service Announcement! Hurricane Bob – Landfall 8/19/1991 Bonnet Shores after Carol -  8/31/1954
What is forecast for the 2011 Season? ACE Index Estimate Conditions Setup	 Named Storms:		12-18Hurricanes:			6-10Major Hurricanes: 		3-6 (Cat 3, 4 or 5)
Active Season = Greater Threat? Consider the following regarding hurricanes which   made landfall on the coast of southern New England: 1938                         Season storm total =  8      (Cat 3)  1944         	              Season storm total = 11       (Cat 3)  Carol/Edna ‘54      Season storm total = 10    (2 Cat 3’s)  Donna/1960            Season storm total =  7	(Cat 2)  Gloria 1985            Season storm total = 11	(Cat 2)  Bob 1991                  Season storm total =  8	(Cat 2)
The theme of the prevailing summer weather pattern ultimately determines our vulnerability Point at which New Englanders needs to take action!
The Floods of March 2010Examining Observed and Future Impacts of Increased Rainfall and Flooding Outline * A bit about the Northeast River Forecast Center * What ingredients brought us to such a remarkable   flood event in March 2010? * Historical Perspective * What does this all mean in light of climate    change?  Providence Street – West Warwick, RI at 1030 am Wednesday 3/31/10
River Forecast Center Responsibilities Calibrate and implement a variety of hydrologic and hydraulic models to provide: River flow and stage forecasts at 180 locations Guidance on the rainfall needed to produce Flash Flooding Ensemble streamflow predictions Ice Jam and Dam Break support  Water Supply forecasts Partner with NOAA Line Offices to address issues relating to Hazard Resiliency, Water Resource Services, Ecosystem Health and Management, and Climate Change Moderate flooding - Connecticut River at Portland, CT.
http://www.weather.gov/nerfc Click on “Self Brief Page” NERFC Hydromet Self-briefing Page
So what brought us to the tipping point during the last week of March 2010? It was not caused by One single Nor’easter or one Coastal Storm Snowmelt Improper water management
So what brought us to the tipping point? It was caused by: The atmospheric river – “energized” by El Nino Blocking high pressure over Greenland A sequence of heavy rainfall events over 5 weeks Record monthly rainfall totaling 12-18 inches Axis of each event over Pawcatuck & Pawtuxet Valleys Saturated ground A “chuck-full” Scituate Reservoir  Designed for Water Supply not Flood Control! Swollen streams and ponds running well above normal The lack of nature’s grasses, flowers and trees Pre-growing season – no Evapo-transpiration to help us out
Major to Record flooding across southeast New England
The Blackstone ResponseDodged a huge bullet – as heaviest rains stayed south of the basin        Considerable flooding on mainstem and many small streams
The Pawtuxet’s Record Response Dramatic “urban response” in the lower basin followed by record reservoir flows from Scituate Reservoir
Pawcatuck Basin – similar responses Pawcatuck River – Wood River Junction Pawcatuck River – Westerly, RI
Historical Footnotes Extremely rare to set two record flood elevations in two weeks – as was done on the Pawtuxet Consider this fact: The storms in March 2010 dumped over 16 inches of rain The record Flood for the Blackstone in 1955 was the result of over 10 inches in ONE DAY with over 14 to 16 inches of rain in 1 week in Woonsocket northward through the head waters in Worcester. Fits pattern of more intense heavy rainfall events which have been impacting the Northeast since the mid 1990s. Merrimack Oct’96,  Hurricane Floyd flooding Sept ‘99,  Connecticut, Merrimack, Blackstone Oct’05,  Mother’s Day 2006 Merrimack valley, May 2007, and now March 2010 An accumulation of “change”
The Basin itself…many twists/turns and tremendous urbanization of the lower watershed post 1968 – which corresponds to the jump in flood frequencies Natic Dam Royal Mill Dam Arctic Dam
Pawtuxet River Flood Frequency Post Mall and I-95 construction
Blackstone River Flood History Post USACE Flood Control Product Construction
Rhode Island Temperature Trend Annual TemperatureProvidence, RI 1933-2010 * Trend line: y=1/61x +18.65 * Prediction for 2020= 51.8F Courtesy of Ryan ValleeClass of 2015 NCMS
Rhode Island Precipitation Trend Annual PrecipitationProvidence, RI 1933-2010 * * Courtesy of Ryan ValleeClass of 2015 NCMS
Rhode Island Snowfall Trend Seasonal SnowfallProvidence, RI 1933-2010 * * Courtesy of Ryan ValleeClass of 2015 NCMS
Climate Change Scenarios:Shorter snow season – less days with snow on the groundMore  precipitation falling as rain prior to spring “green-up” Burakowski et al., 2008, JGR
Climate Change Scenarios:Increase in 1 inch and 2 inch rainfall events 1 inch events (1947-2007) 2 inch events (1947-2007) Spierre et al., 2008 Spierre et al., 2008
There has been a shift in Return Frequency Most significant in the 25 to 100 yr recurrence interval.

More Related Content

What's hot

Physical Systems Revision Hobart High 2008
Physical Systems Revision Hobart High 2008Physical Systems Revision Hobart High 2008
Physical Systems Revision Hobart High 2008dunjggr
 
Eops 2016 07_20
Eops 2016 07_20Eops 2016 07_20
Eops 2016 07_20EOPS EOPS
 
2009 ATL Floods - GAFM Annual Meeting 2010
2009 ATL Floods - GAFM Annual Meeting 20102009 ATL Floods - GAFM Annual Meeting 2010
2009 ATL Floods - GAFM Annual Meeting 2010mtuttlecarr
 
Ok Amt Study Tour Climate Change In Craven
Ok   Amt Study Tour   Climate Change In CravenOk   Amt Study Tour   Climate Change In Craven
Ok Amt Study Tour Climate Change In Cravensammayadams
 
Enso cycle La Nina & El Nino
Enso cycle La Nina & El NinoEnso cycle La Nina & El Nino
Enso cycle La Nina & El Ninoamadabbott
 
6.5 - El Nino
6.5 - El Nino6.5 - El Nino
6.5 - El NinoEcumene
 
Impacts of the Atlanta Floods, September 2009
Impacts of the Atlanta Floods, September 2009Impacts of the Atlanta Floods, September 2009
Impacts of the Atlanta Floods, September 2009mtuttlecarr
 
RiverStream Initiative 2014
RiverStream Initiative 2014RiverStream Initiative 2014
RiverStream Initiative 2014Mike Roberts
 
El nino - The arrival of Warm water
El nino - The arrival of Warm waterEl nino - The arrival of Warm water
El nino - The arrival of Warm waterUniversity of Mumbai
 
El nino & its effects
El nino & its effectsEl nino & its effects
El nino & its effectsSiddharth S
 
Global warming, its consequences and possible steps
Global warming, its consequences and possible stepsGlobal warming, its consequences and possible steps
Global warming, its consequences and possible stepsNecsoi Sorin
 
AS GEOGRAPHY - ATMOSPHERE AND WEATHER - EL NINO AND LA NINA
AS GEOGRAPHY - ATMOSPHERE AND WEATHER - EL NINO AND LA NINAAS GEOGRAPHY - ATMOSPHERE AND WEATHER - EL NINO AND LA NINA
AS GEOGRAPHY - ATMOSPHERE AND WEATHER - EL NINO AND LA NINAGeorge Dumitrache
 

What's hot (20)

Physical Systems Revision Hobart High 2008
Physical Systems Revision Hobart High 2008Physical Systems Revision Hobart High 2008
Physical Systems Revision Hobart High 2008
 
Climate Change Impacts on SIDS
Climate Change Impacts on SIDSClimate Change Impacts on SIDS
Climate Change Impacts on SIDS
 
Eops 2015 8_4
Eops 2015 8_4Eops 2015 8_4
Eops 2015 8_4
 
Eops 2015 9_21
Eops 2015 9_21Eops 2015 9_21
Eops 2015 9_21
 
Eops 2016 07_20
Eops 2016 07_20Eops 2016 07_20
Eops 2016 07_20
 
Cafe sci
Cafe sciCafe sci
Cafe sci
 
Eops 2013 08_21
Eops 2013 08_21Eops 2013 08_21
Eops 2013 08_21
 
Eops 2013 08_21
Eops 2013 08_21Eops 2013 08_21
Eops 2013 08_21
 
2009 ATL Floods - GAFM Annual Meeting 2010
2009 ATL Floods - GAFM Annual Meeting 20102009 ATL Floods - GAFM Annual Meeting 2010
2009 ATL Floods - GAFM Annual Meeting 2010
 
Ok Amt Study Tour Climate Change In Craven
Ok   Amt Study Tour   Climate Change In CravenOk   Amt Study Tour   Climate Change In Craven
Ok Amt Study Tour Climate Change In Craven
 
El nino
El ninoEl nino
El nino
 
Climate Change and Extreme Precipitation
Climate Change and Extreme PrecipitationClimate Change and Extreme Precipitation
Climate Change and Extreme Precipitation
 
Enso cycle La Nina & El Nino
Enso cycle La Nina & El NinoEnso cycle La Nina & El Nino
Enso cycle La Nina & El Nino
 
6.5 - El Nino
6.5 - El Nino6.5 - El Nino
6.5 - El Nino
 
Impacts of the Atlanta Floods, September 2009
Impacts of the Atlanta Floods, September 2009Impacts of the Atlanta Floods, September 2009
Impacts of the Atlanta Floods, September 2009
 
RiverStream Initiative 2014
RiverStream Initiative 2014RiverStream Initiative 2014
RiverStream Initiative 2014
 
El nino - The arrival of Warm water
El nino - The arrival of Warm waterEl nino - The arrival of Warm water
El nino - The arrival of Warm water
 
El nino & its effects
El nino & its effectsEl nino & its effects
El nino & its effects
 
Global warming, its consequences and possible steps
Global warming, its consequences and possible stepsGlobal warming, its consequences and possible steps
Global warming, its consequences and possible steps
 
AS GEOGRAPHY - ATMOSPHERE AND WEATHER - EL NINO AND LA NINA
AS GEOGRAPHY - ATMOSPHERE AND WEATHER - EL NINO AND LA NINAAS GEOGRAPHY - ATMOSPHERE AND WEATHER - EL NINO AND LA NINA
AS GEOGRAPHY - ATMOSPHERE AND WEATHER - EL NINO AND LA NINA
 

Similar to Floods of 2010: Examining Observed and Future Impacts of Increased Rainfall and Flooding

EOPS_2018_05_22.pdf
EOPS_2018_05_22.pdfEOPS_2018_05_22.pdf
EOPS_2018_05_22.pdfEOPS EOPS
 
EOPS_2020_09_28.pdf
EOPS_2020_09_28.pdfEOPS_2020_09_28.pdf
EOPS_2020_09_28.pdfEOPS EOPS
 
EOPS_2021_03_11.pdf
EOPS_2021_03_11.pdfEOPS_2021_03_11.pdf
EOPS_2021_03_11.pdfEOPS EOPS
 
Eops 2016 05_02
Eops 2016 05_02Eops 2016 05_02
Eops 2016 05_02EOPS EOPS
 
Severe Canadian Weather
Severe Canadian WeatherSevere Canadian Weather
Severe Canadian Weathercconrad
 
Examining The Impacts of Hurricane Sandy on Rhode Island: A serious wake up ...
Examining The Impacts of Hurricane Sandy on Rhode Island: A serious wake up ...Examining The Impacts of Hurricane Sandy on Rhode Island: A serious wake up ...
Examining The Impacts of Hurricane Sandy on Rhode Island: A serious wake up ...riseagrant
 
Montecito Debris Flows - Professor Ed Keller, UCSB
Montecito Debris Flows - Professor Ed Keller, UCSBMontecito Debris Flows - Professor Ed Keller, UCSB
Montecito Debris Flows - Professor Ed Keller, UCSBSBPLibrary
 
Nichi.11 12-13.nasa.cynthia rosenzweig
Nichi.11 12-13.nasa.cynthia rosenzweigNichi.11 12-13.nasa.cynthia rosenzweig
Nichi.11 12-13.nasa.cynthia rosenzweigNICHI_USA
 
EOPS_2019_10_30.pdf
EOPS_2019_10_30.pdfEOPS_2019_10_30.pdf
EOPS_2019_10_30.pdfEOPS EOPS
 
EOPS_2021_02_03.pdf
EOPS_2021_02_03.pdfEOPS_2021_02_03.pdf
EOPS_2021_02_03.pdfEOPS EOPS
 
Presentation: Unit 1 Introduction to the hydrological cycle
Presentation: Unit 1 Introduction to the hydrological cyclePresentation: Unit 1 Introduction to the hydrological cycle
Presentation: Unit 1 Introduction to the hydrological cycleSERC at Carleton College
 
EOPS_06_17_2021.pdf
EOPS_06_17_2021.pdfEOPS_06_17_2021.pdf
EOPS_06_17_2021.pdfEOPS EOPS
 
Projected Climate Change Impacts for Rhode Island’s Coast: A Summary of the S...
Projected Climate Change Impacts for Rhode Island’s Coast: A Summary of the S...Projected Climate Change Impacts for Rhode Island’s Coast: A Summary of the S...
Projected Climate Change Impacts for Rhode Island’s Coast: A Summary of the S...riseagrant
 
Final Project Summary Dwr6
Final Project Summary Dwr6Final Project Summary Dwr6
Final Project Summary Dwr6diggermole7873
 
Eops 2016 06_27
Eops 2016 06_27Eops 2016 06_27
Eops 2016 06_27EOPS EOPS
 
Queensland flood, Australia
Queensland flood, AustraliaQueensland flood, Australia
Queensland flood, AustraliaWasif Jalal
 
Lake Ontario Unleashed: An Analysis of a February 2007 Lake Effect Event
Lake Ontario Unleashed: An Analysis of a February 2007 Lake Effect EventLake Ontario Unleashed: An Analysis of a February 2007 Lake Effect Event
Lake Ontario Unleashed: An Analysis of a February 2007 Lake Effect Eventmlanza
 
Ontario Siphon Hug Project3
Ontario Siphon Hug Project3Ontario Siphon Hug Project3
Ontario Siphon Hug Project3roaudet
 

Similar to Floods of 2010: Examining Observed and Future Impacts of Increased Rainfall and Flooding (20)

EOPS_2018_05_22.pdf
EOPS_2018_05_22.pdfEOPS_2018_05_22.pdf
EOPS_2018_05_22.pdf
 
Butler
ButlerButler
Butler
 
EOPS_2020_09_28.pdf
EOPS_2020_09_28.pdfEOPS_2020_09_28.pdf
EOPS_2020_09_28.pdf
 
EOPS_2021_03_11.pdf
EOPS_2021_03_11.pdfEOPS_2021_03_11.pdf
EOPS_2021_03_11.pdf
 
Eops 2016 05_02
Eops 2016 05_02Eops 2016 05_02
Eops 2016 05_02
 
Severe Canadian Weather
Severe Canadian WeatherSevere Canadian Weather
Severe Canadian Weather
 
Examining The Impacts of Hurricane Sandy on Rhode Island: A serious wake up ...
Examining The Impacts of Hurricane Sandy on Rhode Island: A serious wake up ...Examining The Impacts of Hurricane Sandy on Rhode Island: A serious wake up ...
Examining The Impacts of Hurricane Sandy on Rhode Island: A serious wake up ...
 
Montecito Debris Flows - Professor Ed Keller, UCSB
Montecito Debris Flows - Professor Ed Keller, UCSBMontecito Debris Flows - Professor Ed Keller, UCSB
Montecito Debris Flows - Professor Ed Keller, UCSB
 
Nichi.11 12-13.nasa.cynthia rosenzweig
Nichi.11 12-13.nasa.cynthia rosenzweigNichi.11 12-13.nasa.cynthia rosenzweig
Nichi.11 12-13.nasa.cynthia rosenzweig
 
EOPS_2019_10_30.pdf
EOPS_2019_10_30.pdfEOPS_2019_10_30.pdf
EOPS_2019_10_30.pdf
 
EOPS_2021_02_03.pdf
EOPS_2021_02_03.pdfEOPS_2021_02_03.pdf
EOPS_2021_02_03.pdf
 
Presentation: Unit 1 Introduction to the hydrological cycle
Presentation: Unit 1 Introduction to the hydrological cyclePresentation: Unit 1 Introduction to the hydrological cycle
Presentation: Unit 1 Introduction to the hydrological cycle
 
EOPS_06_17_2021.pdf
EOPS_06_17_2021.pdfEOPS_06_17_2021.pdf
EOPS_06_17_2021.pdf
 
Sandy and the Big Climate Change Picture- Nickitas Georgas
Sandy and the Big Climate Change Picture- Nickitas GeorgasSandy and the Big Climate Change Picture- Nickitas Georgas
Sandy and the Big Climate Change Picture- Nickitas Georgas
 
Projected Climate Change Impacts for Rhode Island’s Coast: A Summary of the S...
Projected Climate Change Impacts for Rhode Island’s Coast: A Summary of the S...Projected Climate Change Impacts for Rhode Island’s Coast: A Summary of the S...
Projected Climate Change Impacts for Rhode Island’s Coast: A Summary of the S...
 
Final Project Summary Dwr6
Final Project Summary Dwr6Final Project Summary Dwr6
Final Project Summary Dwr6
 
Eops 2016 06_27
Eops 2016 06_27Eops 2016 06_27
Eops 2016 06_27
 
Queensland flood, Australia
Queensland flood, AustraliaQueensland flood, Australia
Queensland flood, Australia
 
Lake Ontario Unleashed: An Analysis of a February 2007 Lake Effect Event
Lake Ontario Unleashed: An Analysis of a February 2007 Lake Effect EventLake Ontario Unleashed: An Analysis of a February 2007 Lake Effect Event
Lake Ontario Unleashed: An Analysis of a February 2007 Lake Effect Event
 
Ontario Siphon Hug Project3
Ontario Siphon Hug Project3Ontario Siphon Hug Project3
Ontario Siphon Hug Project3
 

More from Rhode Island Emergency Management Agency

More from Rhode Island Emergency Management Agency (20)

2017 Preparedness Grants Roll-out
2017 Preparedness Grants Roll-out2017 Preparedness Grants Roll-out
2017 Preparedness Grants Roll-out
 
Introduction to the National Flood Insurance Program
Introduction to the National Flood Insurance ProgramIntroduction to the National Flood Insurance Program
Introduction to the National Flood Insurance Program
 
National Flood Insurance Program: Overview and Updates
National Flood Insurance Program: Overview and UpdatesNational Flood Insurance Program: Overview and Updates
National Flood Insurance Program: Overview and Updates
 
National Flood Insurance Program: Overview and Updates
National Flood Insurance Program: Overview and UpdatesNational Flood Insurance Program: Overview and Updates
National Flood Insurance Program: Overview and Updates
 
RIEMA HMA Presentation
RIEMA HMA PresentationRIEMA HMA Presentation
RIEMA HMA Presentation
 
National Flood Insurance Program: The New FEMA Guidelines
National Flood Insurance Program: The New FEMA GuidelinesNational Flood Insurance Program: The New FEMA Guidelines
National Flood Insurance Program: The New FEMA Guidelines
 
Webeoc resource manager
Webeoc resource managerWebeoc resource manager
Webeoc resource manager
 
Building Disaster Behavioral Health Recovery Skills
Building Disaster Behavioral Health Recovery SkillsBuilding Disaster Behavioral Health Recovery Skills
Building Disaster Behavioral Health Recovery Skills
 
Preparedness
PreparednessPreparedness
Preparedness
 
Multiple Lines of Defense from Hurricanes
Multiple Lines of Defense from HurricanesMultiple Lines of Defense from Hurricanes
Multiple Lines of Defense from Hurricanes
 
Building Codes and Zoning
Building Codes and ZoningBuilding Codes and Zoning
Building Codes and Zoning
 
RIEMA Exercise Conference 2011 Power Pt.
RIEMA Exercise Conference 2011 Power Pt.RIEMA Exercise Conference 2011 Power Pt.
RIEMA Exercise Conference 2011 Power Pt.
 
RIEMA 2010 Active Shooter Training Power Pt.
RIEMA 2010 Active Shooter Training Power Pt.RIEMA 2010 Active Shooter Training Power Pt.
RIEMA 2010 Active Shooter Training Power Pt.
 
Fpc business prep 7 oct 2 final
Fpc business prep 7 oct 2 finalFpc business prep 7 oct 2 final
Fpc business prep 7 oct 2 final
 
Hurricane conference local response by R Seltzer
Hurricane conference local response by R SeltzerHurricane conference local response by R Seltzer
Hurricane conference local response by R Seltzer
 
State Response to Floods of 2010
State Response to Floods of 2010State Response to Floods of 2010
State Response to Floods of 2010
 
The Role of Property/Casualty Insurance in Catastrophic Events
The Role of Property/Casualty Insurance in Catastrophic EventsThe Role of Property/Casualty Insurance in Catastrophic Events
The Role of Property/Casualty Insurance in Catastrophic Events
 
The Interdependencies of Events and Their Effect on Supply Chains
The Interdependencies of Events and Their Effect on Supply ChainsThe Interdependencies of Events and Their Effect on Supply Chains
The Interdependencies of Events and Their Effect on Supply Chains
 
Hurricane Forecast 2010
Hurricane Forecast 2010 Hurricane Forecast 2010
Hurricane Forecast 2010
 
Infrastructure Interdependencies: Connections that Alter Consequences
Infrastructure Interdependencies: Connections that Alter ConsequencesInfrastructure Interdependencies: Connections that Alter Consequences
Infrastructure Interdependencies: Connections that Alter Consequences
 

Floods of 2010: Examining Observed and Future Impacts of Increased Rainfall and Flooding

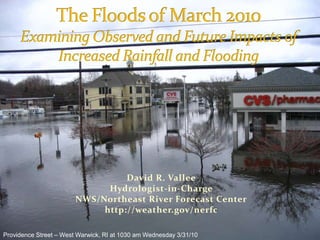
  • 1. The Floods of March 2010Examining Observed and Future Impacts of Increased Rainfall and Flooding David R. ValleeHydrologist-in-ChargeNWS/Northeast River Forecast Centerhttp://weather.gov/nerfc Providence Street – West Warwick, RI at 1030 am Wednesday 3/31/10
  • 2. The NOAA Hurricane Outlook for the Atlantic Basin! But first: A Public Service Announcement! Hurricane Bob – Landfall 8/19/1991 Bonnet Shores after Carol - 8/31/1954
  • 3. What is forecast for the 2011 Season? ACE Index Estimate Conditions Setup Named Storms: 12-18Hurricanes: 6-10Major Hurricanes: 3-6 (Cat 3, 4 or 5)
  • 4. Active Season = Greater Threat? Consider the following regarding hurricanes which made landfall on the coast of southern New England: 1938 Season storm total = 8 (Cat 3) 1944 Season storm total = 11 (Cat 3) Carol/Edna ‘54 Season storm total = 10 (2 Cat 3’s) Donna/1960 Season storm total = 7 (Cat 2) Gloria 1985 Season storm total = 11 (Cat 2) Bob 1991 Season storm total = 8 (Cat 2)
  • 5. The theme of the prevailing summer weather pattern ultimately determines our vulnerability Point at which New Englanders needs to take action!
  • 6. The Floods of March 2010Examining Observed and Future Impacts of Increased Rainfall and Flooding Outline * A bit about the Northeast River Forecast Center * What ingredients brought us to such a remarkable flood event in March 2010? * Historical Perspective * What does this all mean in light of climate change? Providence Street – West Warwick, RI at 1030 am Wednesday 3/31/10
  • 7. River Forecast Center Responsibilities Calibrate and implement a variety of hydrologic and hydraulic models to provide: River flow and stage forecasts at 180 locations Guidance on the rainfall needed to produce Flash Flooding Ensemble streamflow predictions Ice Jam and Dam Break support Water Supply forecasts Partner with NOAA Line Offices to address issues relating to Hazard Resiliency, Water Resource Services, Ecosystem Health and Management, and Climate Change Moderate flooding - Connecticut River at Portland, CT.
  • 8. http://www.weather.gov/nerfc Click on “Self Brief Page” NERFC Hydromet Self-briefing Page
  • 9. So what brought us to the tipping point during the last week of March 2010? It was not caused by One single Nor’easter or one Coastal Storm Snowmelt Improper water management
  • 10. So what brought us to the tipping point? It was caused by: The atmospheric river – “energized” by El Nino Blocking high pressure over Greenland A sequence of heavy rainfall events over 5 weeks Record monthly rainfall totaling 12-18 inches Axis of each event over Pawcatuck & Pawtuxet Valleys Saturated ground A “chuck-full” Scituate Reservoir Designed for Water Supply not Flood Control! Swollen streams and ponds running well above normal The lack of nature’s grasses, flowers and trees Pre-growing season – no Evapo-transpiration to help us out
  • 11. Major to Record flooding across southeast New England
  • 12. The Blackstone ResponseDodged a huge bullet – as heaviest rains stayed south of the basin Considerable flooding on mainstem and many small streams
  • 13. The Pawtuxet’s Record Response Dramatic “urban response” in the lower basin followed by record reservoir flows from Scituate Reservoir
  • 14. Pawcatuck Basin – similar responses Pawcatuck River – Wood River Junction Pawcatuck River – Westerly, RI
  • 15. Historical Footnotes Extremely rare to set two record flood elevations in two weeks – as was done on the Pawtuxet Consider this fact: The storms in March 2010 dumped over 16 inches of rain The record Flood for the Blackstone in 1955 was the result of over 10 inches in ONE DAY with over 14 to 16 inches of rain in 1 week in Woonsocket northward through the head waters in Worcester. Fits pattern of more intense heavy rainfall events which have been impacting the Northeast since the mid 1990s. Merrimack Oct’96, Hurricane Floyd flooding Sept ‘99, Connecticut, Merrimack, Blackstone Oct’05, Mother’s Day 2006 Merrimack valley, May 2007, and now March 2010 An accumulation of “change”
  • 16. The Basin itself…many twists/turns and tremendous urbanization of the lower watershed post 1968 – which corresponds to the jump in flood frequencies Natic Dam Royal Mill Dam Arctic Dam
  • 17. Pawtuxet River Flood Frequency Post Mall and I-95 construction
  • 18. Blackstone River Flood History Post USACE Flood Control Product Construction
  • 19. Rhode Island Temperature Trend Annual TemperatureProvidence, RI 1933-2010 * Trend line: y=1/61x +18.65 * Prediction for 2020= 51.8F Courtesy of Ryan ValleeClass of 2015 NCMS
  • 20. Rhode Island Precipitation Trend Annual PrecipitationProvidence, RI 1933-2010 * * Courtesy of Ryan ValleeClass of 2015 NCMS
  • 21. Rhode Island Snowfall Trend Seasonal SnowfallProvidence, RI 1933-2010 * * Courtesy of Ryan ValleeClass of 2015 NCMS
  • 22. Climate Change Scenarios:Shorter snow season – less days with snow on the groundMore precipitation falling as rain prior to spring “green-up” Burakowski et al., 2008, JGR
  • 23. Climate Change Scenarios:Increase in 1 inch and 2 inch rainfall events 1 inch events (1947-2007) 2 inch events (1947-2007) Spierre et al., 2008 Spierre et al., 2008
  • 24. There has been a shift in Return Frequency Most significant in the 25 to 100 yr recurrence interval.
  • 25. Implications: Impacts on the floodplain, land use, infrastructure, dam spillway requirements, drainage requirements, non-point source runoff, bridge clearances, “hardening” of critical facilities in the floodplain, property values etc… Flood Insurance – work to increase participation How much risk are we willing to insure and accept? Graphic courtesy of Cameron Wake University of New Hampshire
  • 26. The Floods of March 2010Examining Observed and Future Impacts of Increased Rainfall and Flooding David R. ValleeHydrologist-in-ChargeNWS/Northeast River Forecast Centerhttp://weather.gov/nerfc Providence Street – West Warwick, RI at 1030 am Wednesday 3/31/10