1. Page 1 of 5
Market Review and Outlook QE Index and Volume
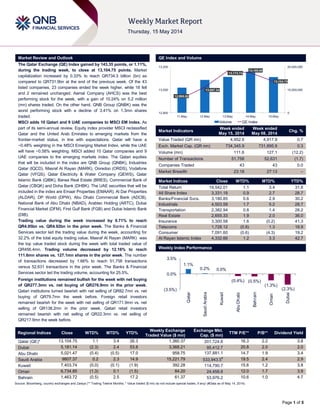
The Qatar Exchange (QE) Index gained by 143.35 points, or 1.11%,
during the trading week, to close at 13,104.75 points. Market
capitalization increased by 0.33% to reach QR734.3 billion (bn) as
compared to QR731.9bn at the end of the previous week. Of the 43
listed companies, 23 companies ended the week higher, while 18 fell
and 2 remained unchanged. Aamal Company (AHCS) was the best
performing stock for the week, with a gain of 10.24% on 5.2 million
(mn) shares traded. On the other hand, QNB Group (QNBK) was the
worst performing stock with a decline of 3.41% on 1.3mn shares
traded.
MSCI adds 10 Qatari and 9 UAE companies to MSCI EM Index. As
part of its semi-annual review, Equity index provider MSCI reclassified
Qatar and the United Arab Emirates to emerging markets from the
frontier-market status, in line with expectations. Qatar will have a
~0.48% weighting in the MSCI Emerging Market Index, while the UAE
will have ~0.58% weighting. MSCI added 10 Qatar companies and 9
UAE companies to the emerging markets index. The Qatari equities
that will be included in the index are QNB Group (QNBK), Industries
Qatar (IQCD), Masraf Al Rayan (MARK), Ooredoo (ORDS), Vodafone
Qatar (VFQS), Qatar Electricity & Water Company (QEWS), Qatar
Islamic Bank (QIBK), Barwa Real Estate (BRES), Commercial Bank of
Qatar (CBQK) and Doha Bank (DHBK). The UAE securities that will be
included in the index are Emaar Properties (EMAAR), Al Dar Properties
(ALDAR), DP World (DPW), Abu Dhabi Commercial Bank (ADCB),
National Bank of Abu Dhabi (NBAD), Arabtec Holding (ARTC), Dubai
Financial Market (DFM), First Gulf Bank (FGB) and Dubai Islamic Bank
(DIB).
Trading value during the week increased by 0.71% to reach
QR4.95bn vs. QR4.92bn in the prior week. The Banks & Financial
Services sector led the trading value during the week, accounting for
32.2% of the total equity trading value. Masraf Al Rayan (MARK) was
the top value traded stock during the week with total traded value of
QR456.4mn. Trading volume decreased by 12.16% to reach
111.6mn shares vs. 127.1mn shares in the prior week. The number
of transactions decreased by 1.66% to reach 51,758 transactions
versus 52,631 transactions in the prior week. The Banks & Financial
Services sector led the trading volume, accounting for 25.5%.
Foreign institutions remained bullish for the week with net buying
of QR277.3mn vs. net buying of QR276.9mn in the prior week.
Qatari institutions turned bearish with net selling of QR82.7mn vs. net
buying of QR79.7mn the week before. Foreign retail investors
remained bearish for the week with net selling of QR171.9mn vs. net
selling of QR138.2mn in the prior week. Qatari retail investors
remained bearish with net selling of QR22.3mn vs. net selling of
QR217.9mn the week before.
Market Indicators
Week ended
May 15, 2014
Week ended
May 08, 2014
Chg. %
Value Traded (QR mn) 4,952.6 4,917.9 0.7
Exch. Market Cap. (QR mn) 734,345.9 731,895.9 0.3
Volume (mn) 111.6 127.1 (12.2)
Number of Transactions 51,758 52,631 (1.7)
Companies Traded 43 43 0.0
Market Breadth 23:18 27:13 –
Market Indices Close WTD% MTD% YTD%
Total Return 19,542.01 1.1 3.4 31.8
All Share Index 3,331.18 0.9 2.7 28.7
Banks/Financial Svcs. 3,180.85 0.6 2.9 30.2
Industrials 4,503.58 1.7 5.2 28.7
Transportation 2,382.94 0.8 1.4 28.2
Real Estate 2,655.33 1.9 2.0 36.0
Insurance 3,300.58 1.6 (0.2) 41.3
Telecoms 1,728.12 (0.8) 1.3 18.9
Consumer 7,091.60 (0.6) (4.3) 19.2
Al Rayan Islamic Index 4,332.66 1.2 3.3 42.7
Market Indices
Weekly Index Performance
Regional Indices Close WTD% MTD% YTD%
Weekly Exchange
Traded Value ($ mn)
Exchange Mkt.
Cap. ($ mn)
TTM P/E** P/B** Dividend Yield
Qatar (QE)* 13,104.75 1.1 3.4 26.3 1,360.37 201,724.8 16.3 2.2 3.8
Dubai 5,181.14 (2.3) 2.4 53.8 3,368.21 95,412.7 20.8 2.0 2.0
Abu Dhabi 5,021.47 (0.4) (0.5) 17.0 958.75 137,881.1 14.7 1.9 3.4
Saudi Arabia 9807.37 0.2 2.3 14.9 15,221.79 533,943.5#
19.5 2.4 2.9
Kuwait 7,403.74 (0.0) (0.1) (1.9) 392.28 114,790.7 15.6 1.2 3.8
Oman 6,734.85 (1.3) 0.1 (1.5) 84.20 24,458.8 12.0 1.7 3.9
Bahrain 1,463.72 (0.5) 2.5 17.2 61.37 53,976.2 10.6 1.0 4.7
Source: Bloomberg, country exchanges and Zawya (** Trailing Twelve Months; * Value traded ($ mn) do not include special trades, if any) (#Data as of May 14, 2014)
12,995.05
13,067.34
13,174.74
13,160.60
13,104.75
0
15,000,000
30,000,000
12,900
13,050
13,200
11-May 12-May 13-May 14-May 15-May
Volume QE Index
1.1%
0.2% 0.0%
(0.4%) (0.5%)
(1.3%)
(2.3%)(3.5%)
0.0%
3.5%
Qatar
SaudiArabia
Kuwait
AbuDhabi
Bahrain
Oman
Dubai
2. Page 2 of 5
News
Market & Corporate News
MSCI adds 10 Qatari and 9 UAE companies to MSCI EM
Index – As part of its semi-annual review, Equity index provider
MSCI reclassified Qatar and the United Arab Emirates to
emerging markets from the frontier-market status, in line with
expectations. Qatar will have a ~0.48% weighting in the MSCI
Emerging Market Index, while the UAE will have ~0.58%
weighting. MSCI added 10 Qatar companies and 9 UAE
companies to the emerging markets index. The Qatari equities
that will be included in the index are QNB Group (QNBK),
Industries Qatar (IQCD), Masraf Al Rayan (MARK), Ooredoo
(ORDS), Vodafone Qatar (VFQS), Qatar Electricity & Water
(QEWS), Qatar Islamic Bank (QIBK), Barwa Real Estate
(BRES), Commercial Bank of Qatar (CBQK) and Doha Bank
(DHBK). The UAE securities that will be included in the index
are Emaar Properties (EMAAR), Al Dar Properties (ALDAR),
DP World (DPW), Abu Dhabi Commercial Bank (ADCB),
National Bank of Abu Dhabi (NBAD), Arabtec Holding (ARTC),
Dubai Financial Market (DFM), First Gulf Bank (FGB) and
Dubai Islamic Bank (DIB). All changes will be implemented as
of the close on May 30, 2014. (Reuters, Zawya)
Qatari bourse plans two ETFs – The Qatar Exchange’s (QE)
CEO Rashid Al Mansoori disclosed that the bourse is working
toward launching two exchange-traded funds (ETFs) over the
next six months. One ETF will be based on government fixed
income risk from an Asian borrower, while the second product
is likely to be an ETF based on a representative Qatar-country
index. Last week, QE, in collaboration with QNB Financial
Services and Bank of America Merrill Lynch, concluded a week-
long roadshow in London and New York to enhance investor
relations between international investment institutions and
Qatari-listed companies. The forthcoming inclusion of Qatar in
the MSCI Emerging Market Index has provided a unique
opportunity for the country to showcase its market-leading listed
companies. (Peninsula Qatar)
Ashghal signs QR38.52bn deals for expressways - The
Public Work Authority (Ashghal) has signed deals worth
QR38.52bn so far to build expressways across the country.
Eleven of these projects worth QR18.21bn are under
construction and are scheduled to be completed in 2014.
(Peninsula Qatar)
Ashghal to build flyovers in Doha – The Public Works
Authority (Ashghal) has called on specialized companies to
submit pre-qualification applications for designing and building
pedestrian flyovers. The authority plans to build multi-layer
flyovers at different locations in the country, aimed at providing
pedestrians easy and safe access to schools, shopping centers
and bus stops. The proposed flyovers will have escalators and
covered air-conditioned passages. (Gulf-Times.com)
Project Qatar to discuss $200bn projects - The Project Qatar
2014 expo hosted different ministries, government sector
officials, embassies, decision-makers and industry
professionals from the construction sector on its first day. The
event is expected to see discussions on various business deals
for projects worth around $200bn that are in the pipeline in
Qatar in the run-up to the 2022 FIFA World Cup as well as
achieving the Qatar National Vision 2030. (Bloomberg)
ERES buys 20% stake in QIGD – Ezdan Holding Group
(ERES) has acquired more than 20% stake in Qatari Investors
Group (QIGD), its second acquisition in a month. ERES’ Deputy
Chairman Sheikh Abdullah bin Thani bin Abdullah al-Thani said
that the QIGD stake purchase is a significant move towards
diversifying ERES’ investments. QIGD, operates through 12
companies and 23 subsidiaries in different sectors such as
industry, trade and services. However, details of total
acquisition cost or the funding for this acquisition was not
disclosed by the group. (Gulf-Times.com)
QATI chosen sole insurance bond carrier for HIA – The
Qatar Civil Aviation Authority announced that the Qatar
Insurance Company (QATI) has been appointed as the
insurance bond carrier for the Hamad International Airport
(HIA). The state-of-the-art, world-class airport facility is fully
insured for a value of QR45.97bn. The Civil Aviation Authority
said QATI will be the sole insurance provider of the HIA. (Gulf-
Times.com)
CBQK hires banks for $500mn bond sale – According to
sources, the Commercial Bank of Qatar (CBQK), has hired
banks to help arrange a potential dollar-denominated bond
sale. CBQK – Qatar’s second-largest lender by assets – has
picked Bank of America Corp, Morgan Stanley and HSBC
Holdings for a possible sale within the next month. The lender
is seeking to raise at least $500mn. Qatari banks are selling
bonds as the country raises funds to develop infrastructure
projects in preparation for the 2022 Soccer World Cup. Earlier
in October 2013, QNB – the country’s biggest lender – had
raised $1.5bn from a two-part bond sale. (Gulf-Times.com)
QGMD reports net loss of QR2.8mn in 1Q2014 – Qatar
German Company for Medical Devices (QGMD) reported a net
loss of QR2.8mn in 1Q2014 as compared to a net loss of
QR2.7mn in 1Q2013, despite robust revenue. Revenue for
1Q2014 almost tripled to QR5.3mn on a YoY basis. As a result,
the company was able to report a gross profit of QR0.5mn in
1Q2014 compared to a gross loss of QR0.1mn in 1Q2013. The
company’s Loss per Share (LPS) amounted to QR0.24 in
1Q2014 vs. LPS of QR0.23 in 1Q2013. (QE)
QFMA approves slashing face value of listed shares to
QR1 – The Qatar Financial Markets Authority (QFMA) has
approved a proposal to reduce the face value of listed shares to
QR1.00 from QR10.00. According to a QFMA report for 2013,
this reduction will help in increasing liquidity, investor base and
the share turnover ratio as well as attract a new genre of
investors. The QFMA's board approving the proposal does not
mean the nominal value of shares listed on the Qatar Exchange
would be reduced to QR1.00 from QR10.00. However, the
corporate law needs to be amended to implement the move
and QFMA is required to approach the Ministry of Economy &
Commerce for approval. (Peninsula Qatar)
Century 21 Qatar: Real estate market remains stable –
Qatar’s real estate market remained firm in April 2014 with
rents and transactions maintaining their upward trend.
According to the Century 21 Qatar’s monthly report, upmarket
West Bay witnessed the highest rentals with the average
monthly rental price for villas ranging between QR20,000 and
QR35,000. The Qatari real estate market recorded QR4.7bn
worth of real estate deals in 935 transactions during April. Al
Waab area remained the most popular area for the medium to
high-income bracket with villa rentals ranging between
QR14,000 and QR26,000. The lowest villa rental could be
found in Al Dhakhira and Al Khor where rentals ranged between
QR6,000 and QR12,000. (Peninsula Qatar)
3. Page 3 of 5
Qatar Exchange
Top 5 Gainers Top 5 Decliners
Source: Qatar Exchange (QE) Source: Qatar Exchange (QE)
Most Active Shares by Value (QR Million) Most Active Shares by Volume (Million)
Source: Qatar Exchange (QE) Source: Qatar Exchange (QE)
Investor Trading Percentage to Total Value Traded Net Traded Value by Nationality (QR Million)
Source: Qatar Exchange (QE) Source: Qatar Exchange (QE)
10.2%
9.1%
7.5%
6.2%
4.5%
0.0%
4.0%
8.0%
12.0%
Aamal Qatar Islamic
Bank
Gulf
International
Services
Widam Food
Co.
Dlala Holding
-3.4% -3.3%
-2.6% -2.5%
-2.2%
-6.0%
-4.0%
-2.0%
0.0%
QNB Group Qatari Investors
Group
Qatar German
Co. for Medical
Devices
Mazaya Qatar Al Meera
Consumer
Goods
456.4
429.6
321.4
293.1 287.7
0.0
200.0
400.0
600.0
Masraf Al
Rayan
Qatar Fuel Vodafone
Qatar
Barwa Real
Estate
Gulf
International
Services
17.3
11.0
10.0
9.1
7.7
0.0
6.0
12.0
18.0
Vodafone Qatar Qatar Gas
Transport
(Nakilat)
Ezdan Real
Estate
Masraf Al Rayan Barwa Real
Estate
0%
20%
40%
60%
80%
100%
Buy Sell
44.58% 45.03%
18.86% 20.53%
15.07%
18.54%
21.50% 15.90%
Qatari Individuals Qatari Institutions
Non-Qatari Individuals Non-Qatari Institutions
3,142
1,811
3,247
1,706
(105)
105
(500) - 500 1,000 1,500 2,000 2,500 3,000 3,500
Qatari
Non-Qatari
Net Investment Total Sold Total Bought
4. Page 4 of 5
TECHNICAL ANALYSIS OF THE QE INDEX
Source: Bloomberg
The QE Index extended its impressive rally for the second consecutive week, closing at a record new high. The index started the first three trading sessions
on a bullish note. However, traders opted to book profits on Wednesday and Thursday which trimmed its gains. The index’s short-term and long-term
uptrend remains intact. We believe as long as the index trades above its support near the 13,000.0 psychological level it may further continue its rally
tagging new highs. However, a penetration below the 13,000.0 level may result in a further pullback and the index may test its next strong support near
12,940.0, followed by the 21-day moving average (currently at 12,879.89). Buyers could get an opportunity to re-enter at this level. Meanwhile, the RSI is
drifting down from the overbought territory, while the MACD is diverging away from the signal line in a bearish manner indicating that the index may be due
for a likely retracement. Thus, traders are advised to exercise caution and follow strict stop losses as volatility is likely to continue.
DEFINITIONS OF KEY TERMS USED IN TECHNICAL ANALYSIS
RSI (Relative Strength Index) indicator – RSI is a momentum oscillator that measures the speed and change of price movements. The RSI oscillates
between 0 to 100. The index is deemed to be overbought once the RSI approaches the 70 level, indicating that a correction is likely. On the other hand, if
the RSI approaches 30, it is an indication that the index may be getting oversold and therefore likely to bounce back.
MACD (Moving Average Convergence Divergence) indicator – The indicator consists of the MACD line and a signal line. The divergence or the
convergence of the MACD line with the signal line indicates the strength in the momentum during the uptrend or downtrend, as the case may be. When the
MACD crosses the signal line from below and trades above it, it gives a positive indication. The reverse is the situation for a bearish trend.
Candlestick chart – A candlestick chart is a price chart that displays the high, low, open, and close for a security. The ‘body’ of the chart is portion between
the open and close price, while the high and low intraday movements form the ‘shadow’. The candlestick may represent any time frame. We use a one-day
candlestick chart (every candlestick represents one trading day) in our analysis.
Doji candlestick pattern – A Doji candlestick is formed when a security's open and close are practically equal. The pattern indicates indecisiveness, and
based on preceding price actions and future confirmation, may indicate a bullish or bearish trend reversal.
Shooting Star/Inverted Hammer candlestick patterns – These candlestick patterns have a small real body (open price and close price are near to each
other), and a long upper shadow (large intraday movement on the upside). The Shooting Star is a bearish reversal pattern that forms after a rally. The
Inverted Hammer looks exactly like a Shooting Star, but forms after a downtrend. Inverted Hammers represent a potential bullish trend reversal.
5. Contacts
Saugata Sarkar Keith Whitney Sahbi Kasraoui
Head of Research Head of Sales Manager - HNWI
Tel: (+974) 4476 6534 Tel: (+974) 4476 6533 Tel: (+974) 4476 6544
saugata.sarkar@qnbfs.com.qa keith.whitney@qnbfs.com.qa sahbi.alkasraoui@qnbfs.com.qa
QNB Financial Services SPC
Contact Center: (+974) 4476 6666
PO Box 24025, Doha, Qatar
DISCLAIMER: This publication has been prepared by QNB Financial Services SPC (“QNBFS”) a wholly-owned subsidiary of Qatar National Bank (“QNB”). QNBFS is regulated by the Qatar
Financial Markets Authority and the Qatar Exchange; QNB is regulated by the Qatar Central Bank. This publication expresses the views and opinions of QNBFS at a given time only. It is not an
offer, promotion or recommendation to buy or sell securities or other investments, nor is it intended to constitute legal, tax, accounting, or financial advice. We therefore strongly advise potential
investors to seek independent professional advice before making any investment decision. Although the information in this report has been obtained from sources that QNBFS believes to be
reliable, we have not independently verified such information and it may not be accurate or complete. While this publication has been prepared with the utmost degree of care by our analysts,
QNBFS does not make any representations warranties as to the accuracy and completeness of the information it may contain, and declines any liability in that respect. QNBFS reserves the right
to amend the views and opinions expressed in this publication at any time. It may also express viewpoints or make investment decisions that differ significantly from, or even contradict, the views
and opinions included in this report.
COPYRIGHT: No part of this document may be reproduced without the explicit written permission of QNBFS.
Page 5 of 5
Source: Bloomberg
Company Name
Price
(May 15)
% Change
5-Day
% Change
YTD
Market Cap.
QR Million TTM P/E P/B Div. Yield
Qatar National Bank 190.00 (3.41) 10.47 132,949 13.6 2.6 3.7
Qatar Islamic Bank 95.70 9.12 38.70 22,613 16.5 2.0 4.2
Commercial Bank of Qatar 69.00 0.73 16.95 20,489 12.5 1.3 2.4
Doha Bank 65.40 0.77 12.37 16,898 11.9 1.6 6.9
Al Ahli Bank 52.90 (0.19) 25.04 8,739 16.1 2.3 N/A
Qatar International Islamic Bank 87.70 0.92 42.14 13,275 17.3 2.7 4.3
Masraf Al Rayan 50.80 3.89 62.30 38,100 22.0 3.9 3.0
Al Khaliji Bank 23.29 0.91 16.51 8,384 15.9 1.5 4.3
National Leasing 31.25 2.97 3.65 1,546 24.7 1.2 4.8
Dlala Holding 40.85 4.48 84.84 907 N/M 4.0 N/A
Qatar & Oman Investment 14.50 (1.63) 15.81 457 20.9 1.4 4.1
Islamic Holding Group 69.80 (1.13) 51.74 279 28.2 4.7 2.4
Banking and Financial Services 264,635
Zad Holding 77.00 0.00 10.79 1,007 9.4 0.7 4.5
Qatar German Co. for Medical Devices 14.19 (2.61) 2.45 164 N/M 0.9 N/A
Salam International Investment 14.25 (0.35) 9.53 1,629 12.6 1.0 7.0
Medicare Group 87.50 (1.57) 66.67 2,463 24.8 3.2 2.1
Qatar Cinema & Film Distribution 42.10 1.45 4.99 240 20.8 1.7 N/A
Qatar Fuel 232.00 (0.64) 6.16 19,595 16.3 3.3 3.3
Qatar Meat and Livestock 63.10 6.23 22.05 1,136 21.2 4.5 3.3
Al Meera Consumer Goods 184.00 (2.18) 38.03 3,680 16.8 2.9 4.3
Consumer Goods and Services 29,913
Qatar Industrial Manufacturing 46.60 (1.79) 10.51 2,214 10.7 1.5 N/A
Qatar National Cement 143.00 (2.05) 20.17 7,021 15.7 2.7 4.2
Industries Qatar 188.50 0.00 11.60 114,043 16.2 4.0 5.8
Qatari Investors Group 67.30 (3.30) 54.00 8,367 37.0 4.0 1.1
Qatar Electricity and Water 188.00 1.40 13.69 20,680 14.0 3.6 3.6
Mannai Corp. 119.20 (1.49) 32.59 5,438 10.7 3.0 4.6
Aamal 17.76 10.24 18.40 10,656 20.0 1.5 N/A
Gulf International Services 98.90 7.50 102.66 18,380 25.2 6.2 1.6
Mesaieed Petrochemical Holding 34.35 (1.86) N/A 43,155 N/M 3.2 1.0
Industrials 229,953
Qatar Insurance 77.20 2.25 45.11 12,394 15.4 2.4 2.6
Doha Insurance 25.15 0.60 0.60 1,258 9.4 1.2 8.0
Qatar General Insurance & Reinsurance 44.30 0.68 10.98 3,064 1.4 0.6 2.8
Al Khaleej Takaful Insurance 38.60 1.58 37.48 857 11.6 1.3 N/A
Qatar Islamic Insurance 71.00 (1.39) 22.63 1,065 16.7 3.9 5.3
Insurance 18,638
United Development 26.00 0.58 20.74 9,206 19.8 0.9 3.7
Barw a Real Estate 38.75 3.33 30.03 15,079 10.2 1.1 5.2
Ezdan Real Estate 28.20 2.36 65.88 74,800 N/M 2.5 1.1
Mazaya Qatar Real Estate Development 19.79 (2.51) 77.01 1,979 12.9 1.6 3.8
Real Estate 101,064
Qatar Telecom 145.40 (1.69) 5.98 46,575 17.8 1.8 2.8
Vodafone Qatar 18.73 2.35 74.88 15,834 N/M 2.7 N/A
Telecoms 62,409
Qatar Navigation (Milaha) 98.00 1.14 18.07 11,223 11.7 0.9 5.1
Gulf Warehousing 55.00 (0.90) 32.53 2,616 23.8 3.4 2.7
Qatar Gas Transport (Nakilat) 24.81 0.85 22.52 13,894 18.1 3.8 4.4
Transportation 27,733
Qatar Exchange 734,346