Reduce Order Fulfillment Costs with Algorithm Verification
1. 1
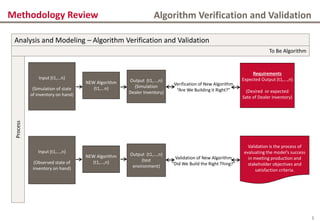
Analysis and Modeling – Algorithm Verification and Validation
To Be Algorithm
Process
Input (t1,...n)
(Simulation of state
of inventory on hand)
NEW Algorithm
(t1,...n)
Output (t1,...,n)
(Simulation
Dealer Inventory)
Requirements
Expected Output (t1,...,n)
(Desired or expected
Sate of Dealer Inventory)
Verification of New Algorithm
“Are We Building it Right?”
Input (t1,...,n)
(Observed state of
inventory on hand)
NEW Algorithm
(t1,...,n)
Output (t1,...,n)
(test
environment)
Validation is the process of
evaluating the model’s success
in meeting production and
stakeholder objectives and
satisfaction criteria.
Validation of New Algorithm
“Did We Build the Right Thing?”
Algorithm Verification and ValidationMethodology Review
2. 2
The lifecycle of the CRISP
(CRoss-Industry Standard Process)
data mining life is shown. The cycle
consists of six phases which align
with the major deliverable of each
phase:
Phase 1 - Business Understanding
Phase 2 - Data Understanding
Phase 3 – Data Preparation
Phase 4 - Modeling
Phase 5 - Evaluation of Model
Phase 6 – Deployment (not within scope)
CRISP Data Mining Process ModelMethodology Review
3. 3
Project
Wrap Up
EvaluationModeling
Data
Preparation
Data
Understanding
Business
Understanding
Collect
Initial Data
Explore
Data
Describe
Data
Verify
Data Quality
Select
Data
Construct/Transform
Data
Clean/Format
Data
Integrate
Data
Select Modeling
Technique
Build
Model
Generate
Test Design
Assess
Model
Plan
Deployment
Produce
Final Report
Produce Final Report
Review
Project
Determine
Business Objectives
Modeling/Simulation
Planning
Allocation
Methodology
Produce
Project Plan
Evaluate
Algorithm
(Verification)
Produce
Interim Report
Evaluate
Objectives
(Validation)
Determine
Next Steps
Work Breakdown Structure ChartMethodology Review
4. 4
Involvement level in hrs
Supplier HISNA HISNA CLIENT
Week Project Phase # Hrs # Hrs
Resource
Function* # Hrs
Resource
Function
1
Project Planning
80 40
BA, Tech-BA
60
BL, OE, DM
2 80 40 60
3
Sales and Inventory
80 40 60
4 60 40 60
5 60 40 60
6 60 40 60
7
Constraint
Management/Order Banks
60 40 60
8 60 40 60
9 60 40 60
10 60 40 60
11
Volume and Spec
Allocation
60 40 60
12 60 40 60
13 60 40 60
14 60 40 60
15
Post Allocation Dealer
Trades, Spec Changes,
Avail. Pools
60 40 60
16 60 40 60
17 60 40 60
18 60 40 60
19
Distribution / Assignment
Swaps
60 40 60
20 60 40 60
21 60 40 60
22 60 40 60
23 Project Wrap up 80 40 60
23 Validation Simulation complete
Total hours 1460 920 1380
BL = Business Leader
BA = Business Analyst
OE = Operations/Systems Expert
Tech-BA = Technical Business Analyst
DM = Data Manager
*Assumptions can be found in Appendix B
Resource Utilization ChartProject Plan Walkthrough
5. Mile-
stone Task Name Days Deliverable
Allocation/Production Ordering Algorithm Validation Project 110
Business Objectives Review 1
Review/Verify Background, Terminology, Objectives and Success Criteria
Review/Verify Requirements, Scope and Deliverables
Review Assumptions and Constraints
Review Risks, Contingencies
Verify Resources and Stakeholder Management Plan
Allocation Methodology 7
Review Allocation/Production Ordering Process (AS IS/TO BE) 3 Client Allocation /Production As Is & To Be Documentation
Review Allocation/Production Ordering Algorithms and Systems (AS IS/TO BE) 3
Business and Modeling Understanding Summary 1 Client Allocation /Production As Is & To Be Documentation
Modeling/Simulation Planning 2
Verify Modeling/Simulation Goals and Success Criteria Modeling and Simulation Requirements and Scope V0.1
Data Collection Requirements Modeling and Simulation Requirements and Scope (Data Dictionary V0.1)
Collect Initial Data (Input and Outputs) Modeling and Simulation Requirements and Scope (Model Construction V0.1)
Verify Data Quality and Data Dictionary Version Modeling and Simulation Requirements and Scope (Data Dictionary V1.0)
Data Exploration Iteration Model Evaluation V0.1
Data Summary Statistics and Reports Model Evaluation V0.2
Business and Modeling Understanding Summary
Allocation/Production Ordering Algorithm Verification and Validation Report V1.0;
Modeling Project Plan V1.0
Sales and Inventory Sprint 20
Business and Data Understanding 5 Sales and Inventory Algorithm Verification Report V0.1
Data Preparation 5 Sales and Inventory Algorithm Verification Report V0.2
Data Modeling 5 Sales and Inventory Algorithm Verification Report V0.3
Evaluation 5 Sales and Inventory Algorithm Verification and Validation Report V0.4
Sales and Inventory Algorithm Readiness Review Sales and Inventory Algorithm Verification and Validation Report V1.0
Modules 2 - 5
Constraint Management 20 Constraint Management Verification and Validation Report V1.0
Volume and Spec Allocation 20 Volume and Spec Allocation Verification and Validation Report V1.0
Post Allocation Dealer Trades 20 Post Allocation Dealer Trades Verification and Validation Report V1.0
Distribution/Assignment Swaps 20 Distribution/Assignment Swaps Verification and Validation Report V1.0
Project Wrap up 5 Allocation/Production Ordering Algorithm Verification and Validation Report V6.0
Algorithm Implementation Readiness Review
5
Timeline, Key Milestones & DeliverablesProject Plan Walkthrough
6. Project Plan Walkthrough
Various dynamic systems modeling tools exist. Our experience suggests the final selection should follow
a formal evaluation of the data and algorithms, which will be completed in the project planning phase.
6
Product Description License Type Cost
MATLAB 7.14/Simulink1 Engineering and Scientist centric tool with largest set of
mathematical functions and tools.
Commercial Single
License
$5,4002
AnyLogic 6.8.1
System Dynamics, Discrete Events and Agent Based
Modeling Tool. Output to Java applets and Applications.
Commercial Version $6,1993
GoldSim Pro
A General Purpose Modeling Tool with Continuous
(Dynamic Modeling) and Discrete Simulator capability.
Commercial Version $3,950
Vensim 6.0.0.1
Icon based Systems Dynamic Modeling Tool with OBDC
connectivity and ability to import MATLAB models.
DSS Commercial
Version4 $1,995
Stella 9.1 Professional
Education and Research based Systems Dynamic
Modeling Tool with Icon based Modeling environment.
Commercial Version $1,899
1. Simulink is the dynamic modeling component of MATLAB.
2. SimEvents and StateFlow add on Tools incur additional charges of $3000 per Tool.
3. License and support for 1 year.
4. Allows the use of external functions and compiled simulations from mdl.
Sample Tools
7. Case Study Walkthrough
Webvan - An online grocery retailer offering ordering and home delivery.
Business Objective: Reduce order handling and fulfillment costs per order, 2/3 of which went directly on
the delivery process.
Phase 1 - Business Understanding. Identify the specific business objectives, the possible solutions and
the necessary data, statistical model(s), technical tools and subject matter experts.
Webvan: Can a travel path sequence and product storage pattern be constructed in the
Distribution Center that will allow the faster order picking?
HMA Relevance: Allocation methodology and algorithms to be constructed that deliver the right
vehicles to the right customer at the right time. Simulation of algorithms under varying
conditions and constraints will demonstrate the appropriateness and optimal parameters of the
methods.
Phase 2 - Data Understanding. Initial data selection, including format and attributes; data collection;
description and summary exploration.
Webvan: Current grocery or product layout; travel times for orders of N items or less.
HMA Relevance: Order bank quantities, dealer quantities, process steps and timing; algorithm
parameters and timing.
7
Reduce Order Handling & Fulfillment
8. Phase 3 – Data Preparation. Selection of data elements and transformations to confirm or verify the
business objectives necessary to account for operational and system functions. Data analysis and
evaluation of all potential interpretations and limitations of the possible results.
Webvan: Sorting by most ordered products was ineffective. Solution required grouping highest
correlated products. Correlation matrix exceeded one million records. Technique required to
identify groups of correlated products and grocery orders.
HMA Relevance: Collect the necessary data components of algorithms and operational
measures required to demonstrate order allocation effectiveness.
Phase 4 – Modeling. Selection of model and simulation design. Review of model assumptions,
constraints and validity. Performed a succession of model runs on a prepared dataset. Removed non-
informative outliers and spurious data elements.
Webvan: Singular Value Decomposition of Product and Order Correlation Matrixes. Dimensions:
order size or cost; convenience or metro ticket. Ran model against historical data to remove the
time of day, day of week, day of month outliers.
HMA Relevance: Construct a representation of the timing of data and event flows. Create sub-
blocks, modules, algorithm components. Select analytic or dynamic technique and tools for
simulation and analysis across parameters and constraints.
8
Case Study Walkthrough Reduce Order Handling & Fulfillment
9. Phase 5 - Evaluation of Model. Presented the statistical measures of the model’s predictive and/or
descriptive performance. Re-stated business impact of model’s ability to reliably answer the Question
identified in Phase 1.
Webvan: Successive runs of selected products against historical orders used to ‘optimize’ the
number of necessary products to place in ‘Convenience’ section, allowing for most number of
complete orders of N or less items. Measured start to end picking time and resource cost.
HMA Relevance: Direct comparison of simulation results with quantified business requirements.
Verification & Validation Process, i.e. expected quantities and timing against test or historical
data.
Phase 6 – Deployment (not within the scope of this project plan/RFP). Deployed software and/or
process changes.
Webvan: Algorithm deployed to collate groups of convenience orders and co-locate
convenience products; triage team to ‘complete’ orders.
HMA Relevance : Algorithm implementation readiness review.
9
Case Study Walkthrough Reduce Order Handling & Fulfillment
10. Our Understanding of the Requirements
10
Model, Simulate and Verify Algorithm
Specification and Performance
Allocation/Production Ordering System and
Algorithms Requirements and Scope
Client Objectives for This Project:
Maximize sales “via right car to the right dealer at the right time” to ensure market
competitiveness and to meet demands of customer/pre-sold orders.
Faster dealer delivery from plant/VPC via increased distribution flexibility and timely
and accurate shipping forecasts to GLOVIS.
Dealers understand and prefer HMA’s allocation over competitors’ methods.
Increased vehicle pipeline visibility to dealers.
Stabilized dealer estimated time of arrival.
Raise HMA to top tier in dealer ordering and allocation.