1. DEMAND, SUPPLY AND ELASTICITY DIAGRAMS
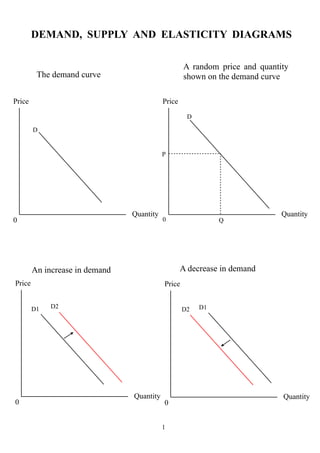
A random price and quantity
The demand curve shown on the demand curve
Price Price
D
D
P
Quantity Quantity
0 0 Q
An increase in demand A decrease in demand
Price Price
D1 D2 D2 D1
Quantity Quantity
0 0
1
2. An increase in demand: at any given A decrease in demand: at any given
price, more is demanded price, less is demanded
Price Price
D2 D2 D1
D1
P P
Quantity Quantity
0 Q1 Q2 0 Q2 Q1
The supply curve A random price and quantity
shown on the supply curve
Price Price
S S
P
Quantity Quantity
0 0 Q
2
3. An increase in supply A decrease in supply
Price Price
S1 S2 S2 S1
Quantity Quantity
0 0
An increase in supply: at any given price, A decrease in supply: at any given
more is supplied price, less is supplied
Price Price
S1 S2 S2 S1
P P
Quantity Quantity
0 Q1 Q2 0 Q2 Q1
3
4. Price equilibrium - the quantity demanded
just equals the quantity supplied
Price
D S
P
Quantity
0 Q
The effects of an increase in demand The effects of a decrease in demand
Price Price
S S
D1 D2 D1
D2
P1
P2 P2
P1
Quantity Quantity
0 Q1 Q2 0 Q2 Q1
The increase in demand leads to The decrease in demand leads to
a new equilibrium position: price increases as does a new equilibrium position: price falls as
the quantity supplied does the quantity supplied
4
5. An increase in supply A decrease in supply
Price Price
S1 S2 S2 S1
P1
P2
P2
P1
Quantity Quantity
0 Q1 Q2 0 Q1 Q2
The increase in supply leads to a fall in The decrease in supply leads to an
price and an increase in the quantity increase in price and a fall in the quantity
supplied supplied
5
6. The different elasticities of demand
1. Price elasticity (we also have cross-elasticity and income elasticity of demand)
Relatively elastic demand Relatively inelastic demand
(Quantity stretches more than price) (Quantity stretches less than price)
Price Price
D
D P1
P1
Quantity Quantity
0 Q1
Q Q2
0 Q1Q2
Perfectly inelastic demand Perfectly elastic demand
(A limiting case) (A limiting case)
Price D Price
P P D
Quantity Quantity
0 0
6
7. Unit elastic demand (% ∆ in P = % ∆ in Q)
Price
The curve is asymptotic, it approaches but never
reaches either axis (sorry - that's as good as I can
P
draw it!).
Quantity
0
Perfectly inelastic supply Perfectly elastic supply
Price S Price
P P S
Quantity Quantity
0 0
7
8. Relatively inelastic supply Relatively elastic supply
(Quantity stretches less than price) (Quantity stretches more than price)
Price
Price
S
P2 P2 S
P1
P1
Quantity Quantity
0 Q1 Q2
0 Q1 Q2
Unit elastic supply - any straight line S curve that
goes through the origin (as slide along curve, the
ratio between P and Q is unchanged)
Price
S
S
S
Quantity
0
8
9. 2. Cross-elasticity of demand (the change in the quantity demanded of good A
when the price of a different good, B, changes)
When the demand for good B increases and this causes a fall in demand for good A, it means that the two goods
are substitutes. People are switching from A to B
An increase in demand for good B A decrease in demand for good A
Price Price
S S
D1 D2 D2 D1
P1
P2 P2
P1
Quantity Quantity
0 Q1 Q2 0 Q2 Q1
The opposite case: when the demand for good B increases and this causes an
increase in demand for good A, it means that the two goods are complements.
People need more of good A to use with the extra quantity of good B being consumed.
An increase in demand for good B An increase in demand for good A
Price
S D2 S
D1 D2 D1
P2 P2
P1 P1
Quantity Quantity
0 0 Q1 Q2
Q1 Q2
9
10. 3. Income elasticity
If the good or service is income elastic, a given percentage change in income causes a greater percentage
change in demand
An increase in demand
Price D2
D1 S
P2
Assuming a small increase in income,
demand increases more than
proportionately
P1
Quantity
0 Q1 Q2
The opposite case: if the good or service is income inelastic, a given percentage change in income causes a
smaller percentage change in demand
If the good or service is income unit inelastic, a given percentage change
in income causes exactly the same percentage change in demand
If the good or service is income negative elastic, a given percentage increase in income causes a decrease in
demand (and vice-versa)
10
11. Negative income elasticity was at the heart of the Giffen Paradox; Sir Robert Giffen noticed that in
Ireland during the great famine of the Nineteenth Century as the price of potatoes fell, people bought
fewer of them, an apparent reversal of the usual demand curve! Could it be a perverse demand curve,
one that resembled a supply curve?
Price
D ??
Quantity
0
In fact, what was happening was that as the supply of potatoes increased, their price fell. Many
people were surviving the famine by eating potatoes, and not much else, at every meal. As potatoes
finally began to become cheaper, it meant people spent less on them, so real incomes increased. The
extra income then went on anything but potatoes! This meant that the demand curve for potatoes
shifted sharply down and to the left. So the initial fall in price led to an eventual fall in the number of
potatoes consumed.
Price
S
D1
D2
P1
P2
Quantity
0 Q2 Q1
11
12. It was not a perverse demand curve after all, but the result of the income effect dominating the
consumption effect, in this unusual situation. The income effect means that the increase in
income was so great that it allowed people to buy other and nicer things and reduce their demand
for potatoes (which means a shift in the demand curve). The consumption effect means that as a
good or service fall in price, more is consumed (we slide down and out along an existing demand
curve); in this case it was smaller than the income effect.
Three elements are needed for this rare event to occur:
· The good must be inferior
· It must make up a large proportion of the consumers' income
· There must be no reasonable substitutes for the good
A WORD OF ADVICE
It is possible to insert diagrams such as these into your essays by searching for diagrams online
and copying the image electronically, or downloading and editing PDF files, or perhaps simply
scanning a textbook. This is not recommended if you wish to learn economics. At best such
behaviour allows you to learn and polish your skills in the computer or scanning programs you
are using. To learn economics you need to practise drawing the diagrams for yourself. When you
are under exam conditions you will probably have to do this in essays and even for multiple
choice questions it can sometimes help you to get the right answer if you are able to draw a quick
diagram for yourself.
The author’s latest book is Going to University: the Secrets of
Success, Second Edition, revised and expanded. This aims to help
students at high school or in a sixth form college to improve
results in essays and exams and in this way to improve their
chances of getting into the university of their first choice. It is also
designed to make the transition from high-school to university
both easier and more enjoyable. It can be obtained from
Amazon.co.uk or it can ordered in any bookshop.
For more details please go to www.keweipress.com
12