1. Provinces
must
fulfill
the
following
criteria
to
receive
the
Canada
Health
Transfer
(CHT):
n
The
shi<
to
an
equal
per
capita
basis
funding
formula
for
the
CHT
in
2014
may
affect
the
universality
of
health
care
due
to
the
different
health
care
spending
needs
of
each
province.
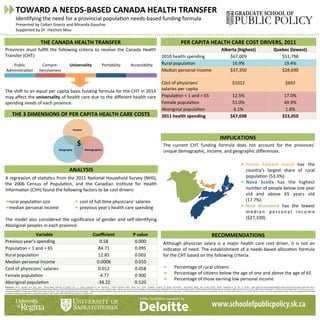
PER
CAPITA
HEALTH
CARE
COST
DRIVERS,
2011
Alberta
(highest)
Quebec
(lowest)
2010
health
spending
$67,009
$51,798
Rural
populaOon
16.9%
19.4%
Median
personal
income
$37,350
$28,690
Cost
of
physicians’
salaries
per
capita
$1012
$692
PopulaOon
<
1
and
>
65
12.5%
17.0%
Female
populaOon
51.0%
49.9%
Aboriginal
populaOon
6.1%
1.8%
2011
health
spending
$67,698
$53,050
TOWARD
A
NEEDS-‐BASED
CANADA
HEALTH
TRANSFER
IdenOfying
the
need
for
a
provincial
populaOon
needs-‐based
funding
formula
Presented
by
Colten
Goertz
and
Miranda
Gouchie
Supported
by
Dr.
Haizhen
Mou
RECOMMENDATIONS
THE
CANADA
HEALTH
TRANSFER
ANALYSIS
A
regression
of
staOsOcs
from
the
2011
NaOonal
Household
Survey
(NHS),
the
2006
Census
of
PopulaOon,
and
the
Canadian
InsOtute
for
Health
InformaOon
(CIHI)
found
the
following
factors
to
be
cost
drivers:
rural
populaOon
size
median
personal
income
The
model
also
considered
the
significance
of
gender
and
self-‐idenOfying
Aboriginal
peoples
in
each
province.
IMPLICATIONS
References:
Birch,
Stephen
and
John
Eyles.
“Needs-‐Based
Planning
of
Health
Care:
A
CriOcal
Appraisal
of
the
Literature.”
CHEPA
Working
Paper
Series
91-‐5.
1991.
Canadian
InsOtute
of
Health
InformaOon.
“QuickStats:
Public
and
Private
Sector
Health
Expenditures
by
Use
of
Funds.”
hip://apps.cihi.ca/mstrapp/asp/Main.aspx?Server=apmstrextprd_i&project=Quick
+Stats&uid=pce_pub_en&pwd=&evt=2048001&visualizaOonMode=0&documentID=9D0E83BC4BACDADE9D4938B338C6B6D5.
Dwyer,
JusOn
and
Kathy
Eager.
“OpOons
for
reform
of
Commonwealth
and
State
governance
responsibiliOes
for
the
Australian
health
system.”
Na8onal
Health
and
Hospitals
Reform
Commission.
2008.
Government
of
Canada.
“2006
Census
of
PopulaOon.”
StaOsOcs
Canada.
hips://www12.statcan.gc.ca/census-‐
recensement/2006/rt-‐td/index-‐eng.cfm#tab5.
Government
of
Canada.
“2011
NaOonal
Household
Survey:
Data
tables.”
StaOsOcs
Canada.
hip://www12.statcan.gc.ca/nhs-‐enm/2011/dp-‐pd/dt-‐td/index-‐eng.cfm.
Marchildon,
Gregory
and
Haizhen
Mou.
“A
Needs-‐Based
AllocaOon
for
the
Canada
Health
Transfer.
Canadian
Public
Policy
40,
no.
3
(2014):
209-‐223.
Penno,
Erin,
Robin
Gauld
and
Rick
Audas.
“How
are
populaOon-‐based
funding
formulae
for
healthcare
composed?
A
comparaOve
analysis
of
seven
models.”
BMC
Health
Services
Research
13
(2013):
470.
Prince
Edward
Island
has
the
country’s
largest
share
of
rural
populaOon
(53.3%).
Nova
ScoYa
has
the
highest
number
of
people
below
one
year
old
and
above
65
years
old
(17.7%).
New
Brunswick
has
the
lowest
m e d i a n
p e r s o n a l
i n c o m e
($27,330).
THE
3
DIMENSIONS
OF
PER
CAPITA
HEALTH
CARE
COSTS
Although
physician
salary
is
a
major
health
care
cost
driver,
it
is
not
an
indicator
of
need.
The
establishment
of
a
needs-‐based
allocaOon
formula
for
the
CHT
based
on
the
following
criteria:
Percentage
of
rural
ciOzens
Percentage
of
ciOzens
below
the
age
of
one
and
above
the
age
of
65
Percentage
of
those
earning
low
personal
income
Public
AdministraOon
Compre-‐
hensiveness
Universality
Portability
Accessibility
The
current
CHT
funding
formula
does
not
account
for
the
provinces’
unique
demographic,
income,
and
geographic
differences.
Variable
Coefficient
P
value
Previous
year’s
spending
0.58
0.000
PopulaOon
<
1
and
>
65
84.71
0.095
Rural
populaOon
12.85
0.002
Median
personal
income
0.0008
0.010
Cost
of
physicians’
salaries
0.012
0.058
Female
populaOon
-‐4.77
0.900
Aboriginal
populaOon
-‐34.22
0.520
Income
Geography
Demographics
$
cost
of
full-‐Ome
physicians’
salaries
previous
year’s
health
care
spending
Poster Competition sponsored by: