2. Although C. striata has a wide-ranging native distribution throughout Southeast Asia, there is little population genetic
information on the species, particularly the strains located in remote regions. The few reports available include investigations
of the genetics of Malaysian populations (Ambak et al., 2006; Tan et al., 2012) and a genetic survey of the Mekong drainage
(Adamson et al., 2010). Within Peninsular Malaysia, the western populations (Perak and Perlis) are differentiated from the
eastern populations (Terengganu and Johore), as inferred by the Random Amplified Polymorphic DNA (RAPD) fingerprinting
method (Ambak et al., 2006) and mitochondrial DNA (mtDNA) ND5 gene (Tan et al., 2012). The study based on mtDNA cy-
tochrome b gene and microsatellite markers in fish along the Mekong basin indicated differentiation between each popu-
lation, even between adjacent locations (Adamson et al., 2010). These findings highlighted C. striata as a relatively non-
migratory species, which would necessitate independent fisheries management at different sites.
The present study focused on the populations of Peninsular Malaysia and Sarawak and Sabah, the Malaysian portion of
Borneo, as well as three populations from Sumatra, Indonesia. These areas form a major part of the Sundaland. This study
characterized genetic diversity of each sampling locality inferred from the mtDNA cytochrome c oxidase subunit 1 (CO1) gene
and defined population structuring with respect to natural physical barriers. The initial hypothesis sought to prove that
adjacent populations share common haplotypes, yet populations may be significantly structured according to prominent
geographical barriers.
2. Materials and methods
2.1. Human and animal rights
Live specimens were collected from local fishermen and wet markets. Interviews with the procurers of the samples
confirmed their origin from a single locality. Fin clips were excised from the dorsal or caudal fin rays (approximately
0.2 cm  2 cm) and preserved one set in 1.5 ml tubes containing 95% ethanol and another set in TNES-Urea (100 mM TriseHCl
pH 7.5, 125 mM NaCl, 10 mM EDTA pH 7.5, 1% SDS, 3 M Urea) (modified from Valles-Jimenez et al., 2004). Samples were stored
at room temperature (~25 C) until use. We returned the fish to the dealers or transported them to the Aquatic Research
Centre at Universiti Sains Malaysia (USM), Penang for further research. The USM Ethics Committee approved this research. All
practical steps to ameliorate suffering of specimens were taken throughout this study.
2.2. Samples collection and mtDNA extraction
We conducted field sampling from 2007 to 2010. Random samples of individuals were collected from a total of 25 wild C.
striata populations throughout its distribution in Peninsular Malaysia, Malaysian Borneo (Sarawak and Sabah) and Sumatra
Island of Indonesia (Fig 1). Sampling locations were divided into six regions, following Tan et al. (2012): 1. Northwest
Peninsular 2. Central west Peninsular 3. Southern Peninsular 4. East Peninsular 5. Malaysian Borneo and 6. Sumatra (Table 1).
DNA template was isolated using an AQUAGENOMIC™ kit (MultiTarget Pharmaceuticals, Salt Lake City, Utah 84116) according
to the manufacturer's protocol.
2.3. Polymerase chain reaction (PCR) optimization
Genomic DNA was PCR amplified with mtDNA CO1 primer pair: L6154 (50-AYC ARC AYY TRT TYT GRT TCT-30) and H6556
(50-TGR AAR TGI GCI ACW ACR TA-30) (Teletchea et al., 2006). The PCR reaction mixture consisted of 50e100 ng of genomic
DNA, 0.6 mM of each primer, 0.2 mM of dNTP (iNtRON), 1Â PCR buffer (iNtRON), 4.2 mM MgCl2 (ÀiNtRON) and 0.08 U of Taq
polymerase (iNtRON). We amplified each PCR in a 25 ml reaction volume in an MJ PTC-200 Thermal Cycler (MJ Research,
Waltham, MA, USA). Amplification conditions were initial denaturation at 98 C (1 min); 35 cycles of 95 C (1 min), 55 C
(1 min), 72 C (2 min) and a final extension at 72 C (1 min) before termination of the reaction at 10 C. PCR products were
visualized on 1.7% agarose gels stained with ethidium bromide and purified (QIAGEN Sciences, Maryland 20874, USA) ac-
cording to the manufacturer's instruction. Purified products were sent for DNA sequencing (First BASE Laboratories Sdn Bhd,
Selangor, Malaysia) using forward primer only.
2.4. Genetic diversity
Multiple CO1 sequences were aligned and all unambiguous operational taxa units were compiled for editing using
ClustalW implemented in MEGA v. 4.0 (Tamura et al., 2007). DNA sequences were translated into protein to ensure ac-
curate alignment and detection of nuclear mitochondrial DNA (numt), if present. The aligned sequences were exported to
Collapse v. 1.2 (Posada, 2004) to construct a haplotype datasheet. The complete aligned dataset were analyzed for
nucleotide variable sites, parsimony informative sites and number of haplotypes in MEGA v. 4.0. Using the same program,
genetic divergence within population based on Kimura 2-parameter genetic distance was calculated. We calculated three
estimations of diversity measurement to describe DNA polymorphism at each sampling site using Arlequin v. 3.1
(Excoffier et al., 2005). The first, haplotype/gene diversity (Hd), measures the probability of uniqueness of a haplotype in a
given population. The second, nucleotide diversity (p), is the mean number of pairwise nucleotide differences among
M.P. Tan et al. / Biochemical Systematics and Ecology 60 (2015) 99e105100
3. individuals in a sample. The third, theta S (qs) (Watterson, 1975), is a measure of the number of segregating sites among
haplotypes in a sample.
To evaluate the contribution of each population to the total diversity, as measured by the allelic richness with rarefaction
technique (CTR), we used CONTRIB v.1.02 (Petit et al.,1998; Kalinowski, 2005). Rarefaction technique was used to standardize
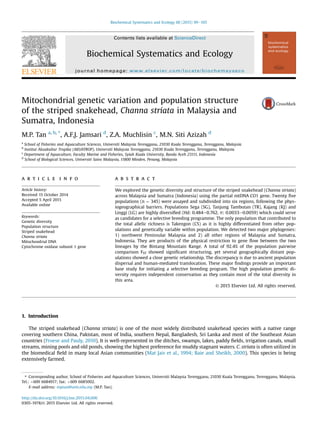
Fig. 1. Clustering of C. striata populations into two major phylogenies, as defined in SAMOVA: Group 1, discontinuous round circle and Group 2, the rest of the
populations. a) Map of Malaysia and populations from Sumatra, Indonesia. b) Enlarged map of Malaysia: 1-Timah Tasoh (TT) 2-Kuala Nerang (KN) 3-Jeniang (JN)
4-Seberang Prai (SP) 5-Teluk Kumbar (TK) 6-Kerian (KR) 7-Tanjung Rambutan (TR) 8-Tapah (TP) 9-Kajang (KJ) 10-Linggi (LG) 11- Yong Peng (YP) 12-Mersing (MS)
13-Kota Bahru (KB) 14-Binjai (BJ) 15-Kubang Bujuk (KT) 16-Kuala Krau (KK) 17-Sega (SG) 18-Tanjung Lumpur (TL) 19-Kota Belud (SB) 20-Kampung Kesapang (KS)
21-Sungai Sibuti (SS) 22-Serian (SW) and Sumatra populations: 23-Takengon (CS) 24-Sibreh (AB) 25-Kampar (KP). A indicates Titiwangsa Mountain Ranges, B
indicates Bintang Mountain Range.
Table 1
Sampling locality, coordinate, collection date and sample size of C. striata populations in this study.
Region Population Latitude (North) Longitude (East) Date collected Sample size (N)
Northwest Peninsular 1) Timah Tasoh (TT), Perlis 6
350
0800
100
130
1400
7.10.2008 7
2) Kuala Nerang (KN), Kedah 6
140
3800
100
360
2200
13.5.2008 15
3) Jeniang (JN), Kedah 5
480
3900
100
370
2700
21.7.2008 10
4) Seberang Prai (SP), P. Pinang 5
220
0800
100
230
0300
8.8.2008 21
5) Teluk Kumbar (TK), P. Pinang 5
170
0400
100
140
2700
18.9.2008 15
6) Kerian (KR), Perak 4
590
2200
100
320
4900
Sept 2007 31
Central west Peninsular 7) Tanjung Rambutan (TR), Perak 4
400
2300
101
080
5200
Sept 2007 20
8) Tapah (TP), Perak 4
110
5000
101
150
4800
Oct 2007 20
9) Kajang (KJ), K. Lumpur 2
590
4200
101
470
5100
24.9.2008 14
Southern Peninsular 10) Linggi (LG), N. Sembilan 2
350
0700
102
020
1500
5.4.2008 13
11) Yong Peng (YP), Johor 2
140
3900
103
020
2800
5.4.2008 15
12) Mersing (MS), Johor 2
300
2100
103
490
0600
6.5.2008 14
East Peninsular 13) Kota Bahru (KB), Kelantan 6
070
0500
102
140
2300
10.1.2009 16
14) Binjai (BJ), Terengganu 4
130
4300
103
220
0300
13.6.2008 14
15) Kubang Bujuk, Marang (KT), Terengganu 5
160
3800
103
020
5500
31.7.2009 16
16) Kuala Krau, Mentakap (KK), Pahang 3
370
1700
102
230
0700
30.7.2009 12
17) Sega, Raub (SG), Pahang 4
000
5800
101
530
5500
30.7.2009 7
18) Tanjung Lumpur, Kuantan (TL), Pahang 3
470
4600
103
200
0900
1.8.2009 7
Malaysian Borneo 19) Kota Belud (SB), Sabah 6
210
0300
116
250
5800
1.2.2009 14
20) Kampung Kesapang (KS), Sabah 6
210
5500
116
260
5000
23.8.2009 13
21) Sungai Sibuti, Miri (SS), Sarawak 4
000
4300
113
460
3100
30.10.2009 18
22) Serian (SW), Sarawak 1
020
4300
110
450
0300
13.5.2009 15
Sumatra 23) Takengon (CS), Aceh 4
360
5300
96
500
4500
18.2.2009 7
24) Sibreh (AB), Aceh Besar 5
240
5100
95
250
2000
18.2.2009 2
25) Kampar (KP), Riau 0
180
1200
101
220
0100
17.2.2009 18
Total 345
M.P. Tan et al. / Biochemical Systematics and Ecology 60 (2015) 99e105 101
4. the allelic richness across populations by correcting variation in sample sizes, ensuring that the rarefaction size should not be
larger than the smallest sample size (Petit et al., 1998). The contribution of each population to the total diversity was divided
into two categories: 1) due to the variation of the population (Crs) and 2) due to the differences to other populations (Crd)
(Petit et al., 1998).
2.5. Population structure and phylogenetic study
A spatial analysis of molecular variance was conducted using Spatial Analysis of Molecular Variance (SAMOVA) SAMOVA v.
1.0 (Dupanloup et al., 2002) to identify similar groups of populations and to evaluate the amount of genetic variation among
the partitions. The optimal number of groups (k) was determined based on the highest value of variances among groups (FCT)
in the analysis, incorporating information on haplotype divergence and geographical proximity. Population pairwise com-
parison FST that calculates genetic differentiation within and among sites based on the k was determined in Arlequin v. 3.1, to
evaluate the level of differences among populations and spatial population structuring. The analysis used the Kimura 2-
Parameter distance method and statistically significant pairwise comparisons were tested with 10,000 permutations pro-
cedure. Significant probability values were adjusted by performing the False Discovery Rate Procedure (FDR) at a ¼ 0.05,
which controls the family wise error rate (FWER), a conservative type I error rate that originates from multiplicity (Benjamini
and Hochberg, 1995).
Phylogenetic relationships among haplotypes were constructed using Neighbor-Joining (NJ) (Saitou and Nei, 1987) and
Maximum Parsimony (MP) (Eck and Dayhoff, 1966) in MEGA v. 4.0. The phylogenetic trees were produced with the least
evolutionary steps or with the least total branch length. Kimura 2-Parameter (Kimura, 1980) evolutionary distance was
implemented for the NJ method and confidence level at each node was assessed by 1000 bootstrap replications (Felsenstein,
1985). The close-neighbor-interchange (CNI) search option with search level of three and an initial tree by random addition of
sequences at 20 replicates was used to search for maximum parsimony tree. We calculated the MP consensus tree, with 50%
cut-off value, in the same program to view the most frequently occurring topology.
3. Results
3.1. Genetic diversity
The 369 bp segment of the 345 CO1 gene sequences from 25 localities revealed 14 segregating sites defining 18 haplotypes.
All unique sequences have been deposited in GenBank with accession number HQ384435eHQ384452. Of the 14 variable sites
occurring at only the first and third codon positions with a ratio of 1:6, eight (57.1%) were parsimony informative. Population
SG recorded the highest mean genetic divergence within population (0.6%), followed by TR (0.6%), KJ (0.4%), LG (0.3%) and KK
(0.3%), while the rest recorded 0.3% divergence (Table 2). Ten populations proved to be monomorphic. Within each pop-
ulation, the number of nucleotide variable sites varied from 0 to 7, generating 1 to 6 haplotypes in each population with an
average of 2.12 haplotypes per population. The three diversity estimations consistently showed SG, TR and LG among the
populations that harbored the highest genetic variation. No specific region showed extreme low or high genetic diversity.
We excluded AB population from the evaluation on the contribution to the total allelic richness (CTR) due to the small
sample size (n ¼ 2), as specifying rarefaction size at 2 yields the same estimation as Nei's gene diversity (Nei, 1973), and thus
did not permit standardization of allelic richness across unequal-sized samples (Petit et al., 1998). Only CS contributed
significantly to CTR as it is strongly differentiated from other populations and genetically diversified within population.
Although it exhibited a low percentage, it indicated a positive contribution. Other populations fell into two categories; a)
differentiated from other populations but not genetically diverse within (SW, SP and TP) and b) not differentiated but
genetically diversified (TR, LG, SG, KK and KJ).
3.2. Population structure and phylogenetic study
By defining groups of populations that are geographically homogenous and maximally differentiated with SAMOVA,
important insights of genetic barriers between these groups could be identified (Dupanloup et al., 2002). The Neighbor-
Joining tree in the previous section had revealed two lineages. Using this information, we initially set SAMOVA analysis at
k ¼ 2. This resulted in the six northwest Peninsular populations grouping together (labeled as group 1) while all the rest
formed group 2 (k ¼ 2, FCT ¼ 59.9%) (Fig 1). Further simulations revealed that FCT increased proportionately with k (2 k 20)
(data not shown). The SAMOVA simulations attempted to maximize the contribution of total genetic variance among groups
of populations. Increasing FCT values with higher k suggested that C. striata is a non-migratory species. Each disconnected
population differentiated from each other. We accepted the optimal number of groups for SAMOVA at k ¼ 2, based on the
phylogenetic NJ tree analysis in the earlier section.
We excluded AB population from the population pairwise comparisons for genetic differentiation estimates due to its very
small sample size (n ¼ 2). The population pairwise FST analysis showed an average high genetic differentiation, ranging from
0 to 100%. A total of 92.4% of the population pairwise comparisons FST showed significant structuring after FDR correction at
a ¼ 0.05 (data not shown). The results demonstrated several unexpected findings, yet are consistent with the SAMOVA
analysis. Several geographically distant populations proved to be genetically closely related. For instance, we found KP to be
M.P. Tan et al. / Biochemical Systematics and Ecology 60 (2015) 99e105102
5. not differentiated from BJ, KT and KB (FST: 0.000e0.008). Similarly, we found KJ to be not differentiated from SS, SB and KS
(FST: 0.107e0.180).
Both neighbor-joining and maximum parsimony returned the same tree topology (MP tree not shown). A weak NJ tree still
revealed two lineages (Fig 2). Clade I represented haplotypes common throughout all regions except the northwest Penin-
sular. We found clade II clustered haplotypes solely in the northwest Peninsular populations except Hap02 and 05. Hap02 was
found in all regions in Malaysia but mainly in Malaysian Borneo and the central west Peninsular. Hap05 was found in TP and
TR in the central west Peninsular.
4. Discussion
4.1. Genetic diversity
We observed a relatively high haplotype diversity in some of the C. striata populations (Hd ¼ 0.000e0.762), a phenomenon
often noted in freshwater fish inhabiting non-glaciated regions (during past glaciations era) or temperate regions (Bernatchez
and Wilson,1998; Roos, 2004). Various diversity measurements consistently indicated SG, TR, KJ and LG to be the most highly
diversified populations and significantly contributed to the total genetic diversity within the studied regions, in agreement
with our earlier works (Tan et al., 2012). Thus, these populations are highly recommended as potential broodstock for se-
lective breeding programs in Malaysia. In contrast, ten populations showed a total absence of genetic variation, possibly due
to a small effective population size. This could be a consequence of one or several likely factors, such as inbreeding possibly
caused by a genetic bottleneck (Newman and Pilson, 1997), sample overexploitation (Hauser et al., 2002), habitat frag-
mentation (Luikart et al., 1998) or habitat loss due to environmental perturbation, including human activities (Wang et al.,
2006), which threatened the genetic variability of this species. We found population and regional specific haplotypes,
respectively, in 38.9 and 66.7%, suggesting local adaptation and independent evolutionary paths due to the limited con-
nectivity between populations/regions.
4.2. Population structure and phylogenetic study
We observed two genetically distinct clusters of C. striata in this study, separated significantly by the Bintang Mountain
Range which lies at Perak state, suggesting it as an effective geographical barrier to gene flow between these two Peninsular
regions. In our earlier study (Tan et al., 2012), we found three genetic clusters, inferred from the mtDNA ND5 gene. Two
separate clusters formed group 2 in the current study, where populations from the central west Peninsular (TR, TP and KJ) and
populations from Malaysian Borneo (SB, KS and SS) combined (Tan et al., 2012). The partial mtDNA CO1 gene used in this
Table 2
Genetic diversity for CO1 sequences in C. striata showing sample size (N), number of variable sites (#V), number of haplotypes (H), haplotype diversity (Hd),
nucleotide diversity (p) and theta (S) for each population and each group.
No Pop N #V H Genetic diversity
Hd p Theta(S)
1 TT 7 1 2 0.286 0.0008 0.408
2 KN 15 0 1 0 0 0
3 JN 10 3 2 0.200 0.0016 1.060
4 TK 15 0 1 0 0 0
5 SP 12 1 2 0.167 0.0005 0.331
6 KR 31 5 5 0.299 0.0027 1.252
7 TR 20 7 6 0.737 0.0056 1.973
8 TP 20 5 2 0.100 0.0014 1.409
9 KJ 14 4 3 0.484 0.0038 1.258
10 LG 13 4 4 0.756 0.0033 1.289
11 YP 15 0 1 0 0 0
12 MS 14 1 2 0.528 0.0014 0.314
13 BJ 14 0 1 0 0 0
14 KB 16 2 3 0.242 0.0007 0.603
15 TL 7 1 2 0.476 0.0013 0.408
16 SG 7 4 3 0.762 0.0059 1.633
17 KT 16 0 1 0 0 0
18 KK 12 3 3 0.546 0.0030 0.993
19 SW 15 0 1 0 0 0
20 SS 18 2 2 0.425 0.0023 0.581
21 SB 14 0 1 0 0 0
22 KS 13 0 1 0 0 0
23 CS 7 1 2 0.476 0.0013 0.408
24 KP 18 0 1 0 0 0
25 AB 2 0 1 0 0 0
Group 1 90 7 8 0.615 0.0026 1.380
Group 2 255 10 13 0.794 0.0042 1.798
M.P. Tan et al. / Biochemical Systematics and Ecology 60 (2015) 99e105 103
6. study proved less informative in elucidating phylogenetic signals in this species. The probable cause is its relatively low
mutation rate compared to the ND5 gene, where the former, more conservative (Miya et al., 2006), accumulated less genetic
differentiation between individuals and populations.
A high level of genetic structuring appeared among the C. striata populations in this study, based on the population
pairwise FST analysis. We expected high genetic structuring, particularly in freshwater fish, as their distribution ability de-
pends solely on waterway connections. We observed several unexpected results when genetic closeness appeared in
geographically distant populations. KP proved to be similar to populations of the east Peninsular. Unexpectedly, KJ showed no
genetic differentiation from populations of Malaysian Borneo. We observed these aberrant results in our earlier study,
inferred from the mtDNA ND5 gene (Tan et al., 2012). The genetic proximity between KP and populations of the east
Peninsular is most likely due to ancient long-range dispersal, through palaeo-river connectivity, of both regions through the
last deglaciation period, when sea level rise submerged the river interconnectivity.
To explain the lack of genetic differentiation between KJ and populations from Malaysian Borneo, after evaluating C.
striata's native range and ancient river connectivity, we believe the genetic similarities are due to human-mediated trans-
location, either intentional or unintentional. C. striata did not occur originally in the eastern part of Malaysian Borneo (USGS,
2011). Additionally, there was no river connection between these two regions (Voris, 2000). C. striata is commonly trans-
ported inter-regionally due to its high economic value (Schuster, 1952) and its ability to air-breathe and stay alive during
shipping (Courtenay et al., 2004).
The landscape highly influenced the genetic diversity of C. striata in the Sundaland, suggesting independent evolutionary
paths of respective regions in concordance with the disconnected geographical relationship. Our most significant finding is
the segregation of this obligate freshwater species into two highly structured and significant phylogenetic groups, limited by
effective geographical barriers and, thus, low gene flow between each population/phylogenetic region. Anthropogenic ac-
tivity possibly played a major part in the probable translocation of this species from the central west Peninsular to as far as
Malaysian Borneo, as detected by the maternal lineage markers. Ancient dispersal, through the palaeo river system running
across two presently isolated regions, indicates the Pleistocene glacial signature of the typical genetic structure of freshwater
fishes in the Sundaland. This indirectly revealed the dispersal power of C. striata, given dispersal limitations and its high
adaptability into a newly colonized area. The current population genetics study has provided a good platform for future
projection of an aquaculture programme and the conservation and management of this species.
Acknowledgements
Thanks are due to Dr Geoffrey K Chambers from Victoria University of Wellington, New Zealand, Prof Peter Mather and Dr
David Hurwood from Queensland University of Technology, Australia for their helpful guidance and advice. Our appreciation
also goes to Dr Muchlisin Zainal Abidin for his help in getting samples from Sumatra. Universiti Sains Malaysia funded this
project under Research University Grant (1001/PBIOLOGI/8150123).
References
Adamson, E.A.S., Hurwood, D.A., Mather, P.B., 2010. A reappraisal of the evolutionary of Asian snakehead fishes (Pisces, Channidae) using molecular data
from multiple genes and fossil calibration. Mol. Phylogenetics Evol. 56 (2), 707e717.
Fig. 2. The evolutionary tree of C. striata inferred from CO1 gene using NJ method. MP/NJ bootstrap value denoted at each branch (value 50% not shown).
M.P. Tan et al. / Biochemical Systematics and Ecology 60 (2015) 99e105104
7. Ambak, M.A., Ambok, B.A.M., Ismail, P., Bui, M.T., 2006. Genetic variation of snakehead (Channa striata) populations using random amplified polymorphic
DNA. Biotechnology 5 (1), 104e110.
Baie, S.H., Sheikh, K.A., 2000. The wound healing properties of Channa striatus cetrimide cream: tensile strength measurement. J. Ethnopharmacol. 71 (1e2),
93e100.
Benjamini, Y., Hochberg, Y., 1995. Controlling the false discovery rate: a practical and powerful approach to multiple testing. J. R. Stat. Soc. B 57 (1), 289e300.
Bernatchez, L., Wilson, C.C., 1998. Comparative phylogeography of Neartic and Paleartic fishes. Mol. Ecol. 7 (4), 431e452.
Courtenay Jr., W.R., Williams, J.D., Britz, R., Yamamoto, M.N., Loiselle, P.V., 2004. Identity of introduced snakeheads (Pisces, Channidae) in Hawai'i and
Madagascar, with comments on ecological concerns. Bish. Mus. Occas. Pap. 77, 13.
Dupanloup, Schneider, S., Excoffier, L., 2002. A simulated annealing approach to define the genetic structure of populations. Mol. Ecol. 11, 2571e2581.
Eck, R.V., Dayhoff, M.O., 1966. Atlas of Protein Sequence and Structure. National Biomedical Research Foundation, Silver Springs, Maryland.
Excoffier, L., Laval, G., Schneider, S., 2005. Arlequin ver. 3.0: an integrated software package for population genetics data analysis. Evol. Bioinforma. Online 1,
47e50.
Felsenstein, J., 1985. Confidence limits on phylogenies: an approach using the bootstrap. Evolution 39, 783e791.
Froese, R., Pauly, D. (Eds.), 2010. FishBase. World Wide Web electronic publication. www.fishbase.org. version (01/2010).
Hauser, L., Adcock, G.J., Smith, P.J., Bernal Ramirez, J.H., Carvalho, G.R., 2002. Loss of microsatellite diversity and low effective population size in an over-
exploited population of New Zealand snapper (Pagrus auratus). Proc. Natl. Acad. Sci. U. S. A. 99 (18), 11742e11747.
Kalinowski, S.T., 2005. HP-RARE 1.0: a computer program for performing rarefaction on measures of allelic richness. Mol. Ecol. Notes 5, 187e189.
Kimura, M., 1980. A simple method for estimating evolutionary rate of base substitutions through comparative studies of nucleotide sequences. J. Mol. Evol.
16, 111e120.
Luikart, G., Sherwin, W.B., Steele, B.M., Allendorf, F.W., 1998. Usefulness of molecular markers for detecting population bottlenecks via monitoring genetic
change. Mol. Ecol. 7, 963e974.
Mat Jais, A.M., McCulloch, R., Croft, K., 1994. Fatty acid and amino acid composition in haruan as a potential role in wound healing. General Pharmacol. 25
(5), 947e950.
Miya, M., Saitoh, K., Wood, R., Nishida, M., Mayden, R.L., 2006. New primers for amplifying and sequencing the mitochondrial ND4/ND5 gene region of the
Cypriniformes (Actinopterygii: Ostariophysi). Ichthyol. Res. 53, 75e81.
Nei, M., 1973. Analysis of gene diversity in subdivided populations. Proc. Natl. Acad. Sci. U. S. A. 70 (12), 3321e3323. Part I.
Newman, D., Pilson, D., 1997. Increased probability of extinction due to decreased genetic effective population size: experimental populations of Clarkia
pulchella. Evolution 51 (2), 354e362.
Petit, R.J., El Mousadik, A., Pons, O., 1998. Identifying populations for conservation on the basis of genetic markers. Conserv. Biol. 12, 844e855.
Posada, D., 2004. Collapse Ver. 1.2. A Tool for Collapsing Sequences to Haplotypes [Online] Available from: http://darwin.uvigo.es.
Roos, H., 2004. Genetic Diversity in the Anabantids Sandelia capensis and S. bainsii: a Phylogeography and Phylogenetic Investigation. MSc thesis. University
of Pretoria.
Saitou, N., Nei, M., 1987. The neighbor-joining method: a new method for reconstructing phylogenetic trees. Mol. Biol. Evol. 4 (4), 406e425.
Schuster, W.H., 1952. A Provisional Survey of the Introduction and Transplantation of Fish throughout the Indo-Pacific Region. Third IPFC Fisheries Sym-
posium, pp. 187e196.
Tamura, K., Dudley, J., Nei, M., Kumar, S., 2007. MEGA4: molecular evolutionary genetics analysis (MEGA) software version 4.0. Mol. Biol. Evol. http://dx.doi.
org/10.1093/molbev/msm092.
Tan, M.P., Jamsari, A.F.J., Siti Azizah, M.N., 2012. Phylogeography pattern of the striped snakehead, Channa striata in Sundaland: ancient river connectivity,
geographical and anthropological signatures. PLoS One 7 (12), e52089. http://dx.doi.org/10.1371/journal.pone.0052089.
Teletchea, F., Laudet, V., H€anni, C., 2006. Phylogeny of the Gadidae (sensu Svetovidov, 1984) based on their morphology and two mitochondrial genes. Mol.
Phylogenetics Evol. 38, 189e199.
USGS, 2011. Channa striata (Bloch, 1793) Chevron snakehead (Online), (accessed 19.02.11.). Available from: World Wide Web. http://fl.biology.usgs.gov/
Snakehead_circ_1251/html/channa_striata.html.
Valles-Jimenez, R., Cruz, P., Perez-Enrique, R., 2004. Population genetic structure of Pacific white shrimp (Litopenaeus vannamei) from Mexico to Panama:
microsatellite DNA variation. Mar. Biotechnol. 6, 475e484.
Voris, H.K., 2000. Map of Pleistocene sea levels in Southeast Asia: shorelines, river systems and time duration. J. Biogeogr. 27, 1153e1167.
Wang, Z.W., Zhou, J.F., Ye, Y.Z., Wei, Q.W., Wu, Q.J., 2006. Genetic structure and low genetic diversity suggesting the necessity for conservation of the Chinese
longsnout catfish, Leiocassis longirostris (Pisces: Bagriidae). Environ. Biol. Fish 75 (4), 455e463.
Watterson, G.A., 1975. On the number of segregating sites in genetic models without recombination. Theor. Popul. Biol. 7, 256e276.
M.P. Tan et al. / Biochemical Systematics and Ecology 60 (2015) 99e105 105