Summary of glycolysis and the krebs cycle medical images for power point
1. Summary of glycolysis and the Krebs cycle
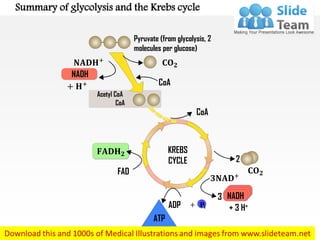
Pyruvate (from glycolysis, 2
molecules per glucose)
𝐍𝐀𝐃𝐇+
+ 𝐇+
𝐅𝐀𝐃𝐇 𝟐
+ 𝐏𝐢
FAD
NADH
ADP
ATP
NADH
Acetyl CoA
CoA
CoA
CoA
𝐂𝐎 𝟐
𝐂𝐎 𝟐
𝟑𝐍𝐀𝐃+
+ 3 H+
2
3
KREBS
CYCLE
3. Summary of glycolysis and the Krebs cycle – With Labels Removed
Pyruvate (from glycolysis, 2
molecules per glucose)
𝐍𝐀𝐃𝐇+
+ 𝐇+
𝐅𝐀𝐃𝐇 𝟐
FAD
NADH
ADP
ATP
NADH
Acetyl CoA
CoA
CoA
CoA
𝐂𝐎 𝟐
𝐂𝐎 𝟐
𝟑𝐍𝐀𝐃+
+ 3 H+
2
3
KREBS
CYCLE
+ 𝐏𝐢
Pyruvate
Download this awesome diagram.
Bring your presentation to life.
Capture your audience’s
attention. Pitch your ideas
convincingly. Bring your
presentation to life.
Capture your audience’s
attention. All images are 100%
editable in PowerPoint. Download
this awesome diagram. Pitch your
ideas convincingly. Download this
awesome diagram. Bring your
presentation to life.
4. Summary of glycolysis and the Krebs cycle – With Labels Removed
Pyruvate (from glycolysis, 2
molecules per glucose)
𝐍𝐀𝐃𝐇+
+ 𝐇+
𝐅𝐀𝐃𝐇 𝟐
FAD
NADH
ADP
ATP
NADH
Acetyl CoA
CoA
CoA
CoA
𝐂𝐎 𝟐
𝐂𝐎 𝟐
𝟑𝐍𝐀𝐃+
+ 3 H+
2
3
KREBS
CYCLE
+ 𝐏𝐢
Acetyl CoA
Download this awesome diagram.
Bring your presentation to life.
Capture your audience’s
attention. Pitch your ideas
convincingly. Bring your
presentation to life.
Capture your audience’s
attention. All images are 100%
editable in PowerPoint. Download
this awesome diagram. Pitch your
ideas convincingly. Download this
awesome diagram. Bring your
presentation to life.
5. " Add your Own Lables and Highlight Any section"
Pyruvate (from glycolysis,
2 molecules per glucose
7. Add Text
1) Open the PowerPoint Slide in which you have to insert the Text Box. Then click on the “Insert
Tab’ in the Ribbon and then inside the Insert Tab, in the ‘Text’ category click on the “Text Box”
icon.
2) Now to insert the Text box, click on the Portion of the Slide where you want the Text box to be
inserted. Once you click, the Text box will be inserted. You can change the size and the shape of
the Text box as per your requirements.
3) Now click on the Text box to enter data into it.
1 2
3
8. 1. Select the shape to change the color and Right click the object( click any object which you
want to change color)
2. Choose Format Shape in the dialog box.
3. Choose “Fill” in the Format Shape box then “Solid” or “Gradient” depending on the
appearance of the object. Change colour as shown in the picture.
Change Color
1
2 3
9. 1. Select the shape to change the size.
2. Click the mouse in the corner of the shape and drag the mouse.
Change Size
1
2