20111123 mwa2011-marc smith
•Download as PPTX, PDF•
4 likes•1,062 views

Presentation to Mobile Web Africa 2011 in Johannesburg, South Africa.

Recommended
Recommended
More Related Content
What's hot
What's hot (20)
Viewers also liked
Viewers also liked (20)
Similar to 20111123 mwa2011-marc smith
Similar to 20111123 mwa2011-marc smith (20)
More from Marc Smith
More from Marc Smith (9)
Recently uploaded
Recently uploaded (20)
20111123 mwa2011-marc smith
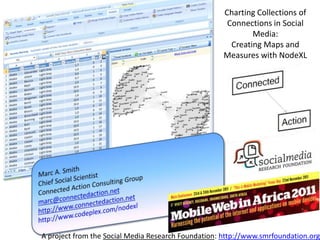
- 1. Charting Collections of Connections in Social Media: Creating Maps and Measures with NodeXL A project from the Social Media Research Foundation: http://www.smrfoundation.org
- 2. About Me Introductions Marc A. Smith Chief Social Scientist Connected Action Consulting Group Marc@connectedaction.net http://www.connectedaction.net http://www.codeplex.com/nodexl http://www.twitter.com/marc_smith http://delicious.com/marc_smith/Paper http://www.flickr.com/photos/marc_smith http://www.facebook.com/marc.smith.sociologist http://www.linkedin.com/in/marcasmith http://www.slideshare.net/Marc_A_Smith http://www.smrfoundation.org
- 4. Network of connections among “SharePoint” mentioning Twitter users Position, Position, Position
- 5. Hardin, Garrett. 1968/1977. “The tragedy of the commons.” Science 162: 1243- 48. Pp. 16-30 in Managing the Commons, edited by G. Hardin and J. Baden. San Francisco: Freeman. Wellman, Barry. 1997. “An electronic group is virtually a social network.” In S. Kiesler (Ed.), The Culture of the Internet. Hillsdale, NJ: Lawrence Erlbaum. 5
- 6. Collective Action Dilemma Theory • Central tenet – Individual rationality leads to collective disaster • Phenomena of interest – Provision and/or sustainable consumption of collective resources – Public Goods, Common Property, "Free Rider” Problems, Tragedies – Signaling intent • Methods – Surveys, interviews, participant observation, log file analysis, computer modeling (Axelrod, 1984; Hess, 1995; Kollock & Smith, 1996) Community Computer Mediated Collective Action
- 7. Common goods that require controlled consumption http://flickr.com/photos/himalayan-trails/275941886/
- 8. Common goods that require collective contribution http://flickr.com/photos/jose1jose2jose3/241450368/
- 9. Interactionist Sociology • Central tenet – Focus on the active effort of accomplishing interaction • Phenomena of interest – Presentation of self – Claims to membership – Juggling multiple (conflicting) roles – Frontstage/Backstage – Strategic interaction – Managing one’s own and others’ “face” • Methods – Ethnography and participant observation (Goffman, 1959; Hall, 1990)
- 11. Whyte, William H. 1971. City: Rediscovering the Center. New York: Anchor Books.
- 12. Y’all. Youse. Yes, youse. 12
- 13. I wish I knew you I like your picture You are cool I was paid to link to you I want your reflected glory Everybody else links to you I’d vote for you Can I date you? Are you my friend? We met at a conference and it seemed like the thing to do. yes no I like you I kind of like you I really like you I know you I feel socially obligated to link to you I beat you on Xbox Live Hi, Mom I have fake alter egos
- 14. 14
- 15. Tag Ecologies I Adamic et al. WWW 2008
- 16. Networks reveal patterns HUB-AND-SPOKE OF DECEIT: When Enron employees communicated about legitimate projects, e-mails were reciprocal and information was shared widely (right), but communications about an illicit project (left) reveal a sparse network with a central, informed clique and isolated external players. Brandy Aven, CMU http://www.sciencenews.org/view/generic/id/330731/title/Information_flow_can_reveal_d irty_deeds
- 17. Social Media (email, Facebook, Twitter, YouTube, and more) is all about connections from people to people. 17
- 18. Patterns are left behind 18
- 19. There are many kinds of ties…. Like, Link, Reply, Rate, Review, Favorite, Friend, Follow, Forward, Edit, Tag, Comment, Check-in… http://www.flickr.com/photos/stevendepolo/3254238329
- 20. Each contains one or more social networks World Wide Web
- 21. Hubs
- 22. Bridges
- 26. 20111122-NodeXL-Twitter-mwa11 OR mwa2011 OR mwebafrica OR mobilewebafrica
- 29. #teaparty 15 November 2011 #occupywallstreet 15 November 2011 http://www.newscientist.com/blogs/onepercent/2011/11/occupy-vs-tea-party-what-their.html
- 31. Won Soon Park, New Mayor of Seoul Korea
- 32. Social Network Theory http://en.wikipedia.org/wiki/Social_network • Central tenet – Social structure emerges from – the aggregate of relationships (ties) – among members of a population • Phenomena of interest – Emergence of cliques and clusters – from patterns of relationships – Centrality (core), periphery (isolates), Source: Richards, W. – betweenness (1986). The NEGOPY • Methods network analysis program. Burnaby, BC: – Surveys, interviews, observations, Department of Communication, Simon log file analysis, computational Fraser University. pp.7- analysis of matrices 16 (Hampton &Wellman, 1999; Paolillo, 2001; Wellman, 2001)
- 33. SNA 101 • Node A – “actor” on which relationships act; 1-mode versus 2-mode networks • Edge B – Relationship connecting nodes; can be directional C • Cohesive Sub-Group – Well-connected group; clique; cluster A B D E • Key Metrics – Centrality (group or individual measure) D • Number of direct connections that individuals have with others in the group (usually look at incoming connections only) E • Measure at the individual node or group level – Cohesion (group measure) • Ease with which a network can connect • Aggregate measure of shortest path between each node pair at network level reflects average distance – Density (group measure) • Robustness of the network • Number of connections that exist in the group out of 100% possible – Betweenness (individual measure) F G • # shortest paths between each node pair that a node is on • Measure at the individual node level • Node roles – Peripheral – below average centrality C H – Central connector – above average centrality D I – Broker – above average betweenness E
- 37. Welser, Howard T., Eric Gleave, Danyel Fisher, and Marc Smith. 2007. Visualizing the Signatures of Social Roles in Online Discussion Groups. The Journal of Social Structure. 8(2). Experts and “Answer People” Discussion people, Topic setters Discussion starters, Topic setters
- 38. Answer Person Signatures Discussion People
- 39. Discussion Starter Spammer Reply oriented Discussion Flame Warrior 39
- 40. Now Available
- 41. Analogy: Clusters Are Occluded Hard to count nodes, clusters
- 42. Separate Clusters Are More Comprehensible
- 43. Twitter Network for “Microsoft Research” *BEFORE*
- 44. Twitter Network for “Microsoft Research” *AFTER*
- 45. Goal: Make SNA easier • Existing Social Network Tools are challenging for many novice users • Tools like Excel are widely used • Leveraging a spreadsheet as a host for SNA lowers barriers to network data analysis and display
- 46. Who we are People Disciplines Institutions University Computer Science University of Maryland Faculty Students HCI, CSCW Oxford Internet Institute Industry Machine Learning Stanford University Independent Information Visualization Microsoft Research Researchers UI/UX Illinois Institute of Technology Developers Social Science/Sociology Connected Action Network Analysis Cornell Collective Action Morningside Analytics
- 47. Social Media Research Foundation http://smrfoundation.org
- 48. What we are trying to do: Open Tools, Open Data, Open Scholarship • Build the “Firefox of GraphML” – open tools for collecting and visualizing social media data • Connect users to network analysis – make network charts as easy as making a pie chart • Connect researchers to social media data sources • Archive: Be the “Allen Very Large Telescope Array” for Social Media data – coordinate and aggregate the results of many user’s data collection and analysis • Create open access research papers & findings • Make “collections of connections” easy for users to manage
- 49. What we have done: Open Tools • NodeXL • Data providers (“spigots”) – ThreadMill Message Board – Exchange Enterprise Email – Voson Hyperlink – SharePoint – Facebook – Twitter – YouTube – Flickr
- 50. What we have done: Open Data • NodeXLGraphGallery.org – User generated collection of network graphs, datasets and annotations – Collective repository for the research community – Published collections of data from a range of social media data sources to help students and researchers connect with data of interest and relevance
- 51. What we have done: Open Scholarship
- 52. What we have done: Open Scholarship
- 54. NodeXL data import sources
- 55. Example NodeXL data importer for Twitter
- 56. NodeXL imports “edges” from social media data sources
- 57. NodeXL Automation makes analysis simple and fast
- 59. NodeXL simplifies mapping data attributes to display attributes
- 60. NodeXL displays subgraph images along with network metadata
- 61. NodeXL enables filtering of networks
- 62. NodeXL Generates Overall Network Metrics
- 63. What we want to do: (Build the tools to) map the social web • Move NodeXL to the web: – Node for Google Doc Spreadsheets! – WebGL Canvas • Connect to more data sources of interest: – RDF, MediaWikis, Gmail, NYT, Citation Networks • Solve hard network manipulation UI problems: – Modal transform, Time series, Automated layouts • Grow and maintain archives of social media network data sets for research use. • Improve network science education: – Workshops on social media network analysis – Live lectures and presentations – Videos and training materials
- 64. Work Items Autofill Group Attribute Merge Edges by Attribute Modal Transform Merge Workbooks Automated Dynamic Filters: Time Series Analysis, contrast Captions and Legends Upload to Graph Gallery++: captions, workbook Graph Gallery++ User Accounts, Reporting, RSS Feeds, Network Visualization Web Canvas Import: RDF, Wiki, SharePoint, Keyword networks from text Metrics: Triad Census Layouts: Force Atlas 2, Lin Log, “Bakshy Plots”, Quality Measures Query-by-example search for network structures
- 65. How you can help • Sponsor a feature • Sponsor Webshop 2012 • Sponsor a student • Schedule training • Sponsor the foundation • Donate your money, code, computation, storage, bandwidth, data or employee’s time • Help promote the work of the Social Media Research Foundation
- 68. Social Network Maps Reveal Key influencers in any topic. Sub-groups. Bridges.
- 69. Why didn’t you just say so? Identify the key influencers in any topic. Netbadges awards badges to influential people and web sites on the Internet. We analyze the social network of connections among all the people or web sites that gather around a topic, issue, or interest and award badges to key people and sites, highlighting their recent content.
- 73. Contact: Marc A. Smith Chief Social Scientist Connected Action Consulting Group Marc@connectedaction.net http://www.connectedaction.net http://www.codeplex.com/nodexl http://www.twitter.com/marc_smith http://delicious.com/marc_smith/Paper http://www.flickr.com/photos/marc_smith http://www.facebook.com/marc.smith.sociologist http://www.linkedin.com/in/marcasmith http://www.slideshare.net/Marc_A_Smith http://www.smrfoundation.org
- 74. Upcoming Full-day social media network analysis workshops This Friday – Hands on with NodeXL Next week Cape Town 28 November 2011 Johannesburg Protea Hotel 30 November 2011 Breakwater Lodge, Gordon Institute Waterfront of Business Science, Illovo Marc Smith Walter Pike
- 75. Charting Collections of Connections in Social Media: Creating Maps and Measures with NodeXL A project from the Social Media Research Foundation: http://www.smrfoundation.org
Editor's Notes
- http://www.flickr.com/photos/library_of_congress/3295494976/sizes/o/in/photostream/
- http://www.flickr.com/photos/amycgx/3119640267/