SlideShare a Scribd company logo
1 of 16
Download to read offline
Population Sector Indicators: Family Planning and 
Reproductive Health 
Population sector activities within PHE programs aim to improve and 
sustain voluntary family planning and reproductive health services and 
use. Population programs need to collect and assess information about two 
broad, sometimes overlapping areas: health facilities and relevant popula-tions. 
The first area is important because facility quality and staff train-ing, 
access, and population use of health facilities all strongly influence 
the overall health of a population. Population programs not only assess 
a population’s physical health, but also that population’s attitudes, knowl-edge, 
and behaviors about a specific health issue, as well as promote gender 
equality and male inclusion in discussions about contraception. An area 
of improving and sustaining voluntary family planning and reproductive 
health services that is particularly relevant to PHE programs’ work is a 
focus on providing access to underserved communities. 
While the ultimate long-term measurement in population programs is the 
total fertility rate, the indicators in this guide focus on measuring vari-ables 
that can be measured for results over a shorter period of time but are 
equally important. Many of the indicators in this section may be valuable 
for population-sector M&E; however, programs that have a focused nature 
or that face limited budgets should concentrate on measuring indicators 
that best fit their needs. 
Table 5 – Population Indicators 
Outputs 
Program-Based 
Outcomes 
Population-Based 
Percent of program staff trained to work with 
or provide reproductive health services to 
adolescents 
Percentage of women of reproductive age 
(15-49) who were clients of a community-based 
contraceptive distributor in the last year 
Couple-years of protection (CYP) 
Average household distance/time to the near-est 
health center 
Percent of skilled health personnel knowl-edgeable 
in obstetric warning signs 
1. 
2. 
3. 
4. 
5. 
Number of acceptors new to modern 
contraception 
Contraceptive prevalence rate 
Percent of deliveries occurring in a health 
facility 
Percent of births attended by skilled health 
personnel 
Percent of women attended at least once 
during pregnancy for reasons related to 
pregnancy 
6. 
7. 
8. 
9. 
10. 
48 Part Three: Indicators
1 Percent of program staff trained to work with or provide 
reproductive health services to adolescents 
Calculation 
# of program staff trained to work with 
or provide reproductive health services to adolescents during the reference period 
total # of health service providers in the target area during the reference period 
x 100 
A Guide for Monitoring and Evaluating Population-Health-Environment Programs 49 
Population 
Level of Measurement: Output. 
Definition: Staff members are considered “youth-friendly” if they have the ability to provide services 
and an environment that targets young audiences. Youth-friendly training generally includes learning 
how to create a service environment that will attract and retain a youth clientele. This includes space 
or rooms dedicated to adolescent reproductive health services; staff who are competent in policies and 
procedures to ensure privacy and confidentiality; peer educators who stay on-site during hours speci-fied 
for provision of services to youth, and use of non-judgmental approaches to providing services to 
youth and accept drop-in clients. A staff member would need to go through specific training for work-ing 
with youth to be counted in this indicator. The denominator should include all staff who work in the 
target area during the reference period (semi-annually or annually), even staff who work part-time. 
Disaggregate: None. 
Purpose: Reproductive health services have traditionally been designed for older, married women. 
Increasing the number of health providers trained to work with youth may increase the chance that 
youth will take advantage of the basic reproductive health services they need. 
Data Sources: Project records. 
Time frame: Semi-annually; annually. 
Data Collection Considerations: Specific topics related to adolescent reproductive health, 
such as sexual health education and peer dynamics, should be covered in the training. Use of a pre-and 
post-test will assist in determining the staff’s level of understanding. 
Strengths & Limitations: This indicator targets the service improvement for an audience that 
has a strong, often unmet need for reproductive health services. However, training does not indicate 
whether or not providers give adequate care.
50 
Population 
2 percent of women of reproductive age (15-49) who were clients 
of a community-based contraceptive distributor in the last year 
Level of Measurement: Output. 
Definition: This indicator measures how well community-based distribution of contraception provides 
coverage of family planning services to an area. In the context of PHE programs, community-based dis-tribution 
means that the contraceptives are sold at a point that is not a traditional health facility, such 
as a clinic or hospital. Community-based distribution is generally through a local store or commercial 
site or an individual at a non-commercial site, as well as other variations that are community-based. As 
measured in this indicator, a client is a woman who receives contraception from the community-based 
distributor (CBD), but does not include a woman who only talks with the CBD about contraceptive 
methods. The method of contraception here can include any method – modern or traditional. 
total # of women clients 
age 15-49 of community-based distributors in the target area in the last year 
total # of women age 15-49 living in the target area in the last year 
Disaggregate: By target community. 
Purpose: The aims of the CBD program are to increase contraceptive use by increasing access and rais-ing 
demand through information, education, and communication (EIC) activities. For PHE programs, 
community volunteers are usually recruited to be community-based distributors, making CBD pro-grams 
especially effective in rural and isolated communities where demand is limited and access to 
alternative methods is low. 
Data Sources: Population-based survey or project records. 
Time frame: Annually for project records and every three to five years for surveys. 
Data Collection Considerations: The questionnaire for surveying women in the target area 
should include the type of commodities/methods received in the previous time period year. 
Strengths & Limitations: CBDs tend to be low-volume independent distributors in isolated and 
sometimes difficult-to-reach areas, creating the need for field-workers to re-supply these posts fre-quently 
and provide supervision and continuous training in contraceptive methods use and risks. 
Part Three: Indicators 
Calculation 
x 100
3 Couple-years of protection 
A Guide for Monitoring and Evaluating Population-Health-Environment Programs 51 
Population 
Level of Measurement: Output. 
Definition: Couple-years of protection (CYP) is the estimated protection provided by family planning 
services during a one-year period based upon the volume of all contraceptives sold or distributed to 
clients during that period. 
Table 6: How to Calculate CYP 
Calculation: Multiply the quantity of each method distributed to clients by the conversion factor 
below to obtain a CYP per method. Then sum each CYP to obtain a total CYP figure. 
Method Units per CYP Conversion Factor 
Oral contraceptives 15 cycles per CYP ¹/₁₅ 
Condoms 120 units per CYP ¹/₁₂₀ 
Female condoms 120 units per CYP ¹/₁₂₀ 
Vaginal foaming tablets 120 units per CYP ¹/₁₂₀ 
Depo Provera injectable 4 doses per CYP ¹/₄ 
Noristerat Injectable 6 doses per CYP ¹/₆ 
Cyclofem monthly injectable 13 doses per CYP ¹/₁₃ 
Emergency contraceptive pills 20 doses per CYP ¹/₂₀ 
Copper-T380-A IUD 3.5 CYP per IUD inserted 3.5 
Norplant implant 3.5 CYP per Implant 3.5 
Implanon implant 2 CYP per Implant 2 
Jadelle implant 3.5 CYP per Implant 3.5 
Natural family planning 
2 CYP per trained, confirmed 
2 
(i.e. standard days method) 
adopter 
Lactational amenorrhea method 
(LAM) 
4 active users per CYP (or 0.25 
CYP per user) 
0.25 
Sterilization (male & female) 
Asia 
Latin America 
Africa 
Near East/North Africa 
10 CYP 
10 CYP 
8 CYP 
8 CYP 
10 
10 
8 
6
52 
Population 
Example: A facility that distributed the following family planning services 
Method Quantity Conversion Factor CYP 
Oral contraceptives 4,321 ¹/₁₅ 288.1 
Condoms 9,900 ¹/₁₂₀ 82.5 
IUDs 80 3.5 280.0 
Total 650.6 
Disaggregate: By method. 
Purpose: CYP is a simple, inexpensive way to measure program activity volume using routinely col-lected 
data. CYP can monitor progress of contraceptive service delivery at the program and project 
levels. 
Data Sources: Service statistics. 
Time frame: Annually. 
Data Collection Considerations: Standardized forms, facility “log books” and commodities 
tracking are necessary for this indicator calculation. Regarding the calculation of long-term methods, 
most programs credit the entire amount to the calendar year in which the client accepted the method. 
For example, if a family planning program in Asia performed 100 voluntary sterilization procedures in 
a given year, it would credit all 1000 CYP (100 procedures x 10 years each) to that calendar year, even 
though the protection from those programs would in fact be realized over that year and the next nine 
years. 
Strengths & Limitations: CYP can be obtained from different service delivery mechanisms. 
However, the value of this indicator can be difficult to understand. CYP data do not provide individual 
contraceptive use rates. The validity of the conversion factors is still debated and the number of people 
represented is not evident in this calculation. 
Part Three: Indicators
4 aVERAGE HOUSEHOLD DISTANCE/TIME TO THE NEAREST HEALTH CENTER 
A Guide for Monitoring and Evaluating Population-Health-Environment Programs 53 
Population 
Level of Measurement: Output. 
Definition: This is the average time or distance from a respondent’s place of residence to the nearest 
service delivery site offering the measured service. The services included in this measurement should 
be determined in advance by the project, depending on the project’s objectives. 
Disaggregate: By services offered (if desired). 
Purpose: Distance to a health facility is often a major factor determining whether or not people truly 
have access to that facility, especially when transport is not easily available. 
Data Sources: GPS or mapping the routes can calculate the distance between health centers and 
communities. A less reliable option is using a population-based survey where household members are 
asked their distance or time it takes them to reach the nearest health center that provides the measured 
service. 
Time frame: Every one to two years. 
Data Collection Considerations: This indicator is useful for demonstrating the effects of pro-viding 
health services in remote, underserved areas. These areas may contain relatively few people, but 
the impact of providing services there may be great because there were no or few pre-existing services. 
In these instances, the PHE project should compare the distance or traveling time it previously took the 
target population to get to outside health centers with the calculation of the distance or average time 
it takes the target population to get to the newly established health center. 
Strengths & Limitations: Community members may visit distant health facilities in order to 
maintain confidentiality. The expense and effort required to obtain this indicator may mean it can only 
be collected every few years.
6 number of acceptors new to modern contraception 
A Guide for Monitoring and Evaluating Population-Health-Environment Programs 55 
Population 
Level of Measurement: Outcome. 
Definition: For this indicator, an acceptor is a person using any modern contraceptive method for the 
first time in his or her life within the last year. Modern contraceptive methods include IUDs, the pill, 
implants, injections, condoms, spermicides, diaphragms, tubal ligation, and vasectomy. 
Disaggregate: By method (if desired). 
Purpose: This indicator measures a program’s ability to attract new clients from an untapped segment 
of the population. 
Data Sources: Usually service statistics; occasionally from population-based surveys. 
Time frame: Annually using service statistics; every two to five years using a population-based survey. 
Data Collection Considerations: Program personnel can disaggregate service statistics by key 
variables (age, sex, place of residence, or other factors deemed relevant in the country of context). 
Strengths & Limitations: Defining this indicator in terms of first-time use in the life of an indi-vidual 
removes the ambiguity associated with the more general term “new acceptor” that can include 
individuals who are new to a clinic or a method but not to modern contraceptive use. However, this 
indicator measures absolute numbers, not the proportion of the population. It does not measure how 
long contraceptive use continues or if methods are used properly.
56 
Population 
Level of Measurement: Outcome. 
Definition: Contraceptive prevalence rate (CPR) is defined as the percent of reproductive-age women 
(ages 15-49 years) who are using a contraceptive method at a particular point in time. This is almost 
always reported for women married or in a sexual union. Generally, this includes all contraceptive 
methods, modern and traditional, but it may include modern methods only. The program manager 
should decide in advance whether any method or just modern methods will be included in calculating 
this indicator. The World Health Organization (WHO) defines modern contraceptive methods as fe-male 
and male sterilization, injectable and oral hormones, intrauterine devices, diaphragms, hormonal 
implants, spermicides, and condoms. Traditional methods include the calendar method (or rhythm), 
withdrawal, abstinence, and lactational amenorrhea (LAM). 
Part Three: Indicators 
7 contraceptive prevalence rate 
# of partnered women 
(married or in union) of reproductive age using a contraceptive method 
total # of partnered women (married or in union) of reproductive age 
Disaggregate: By modern and traditional methods. 
Purpose: CPR measures population coverage of contraceptive use, taking all sources of supply and con-traceptive 
methods into account. 
Data Sources: Population-based surveys. 
Time frame: Every two to five years. 
Data Collection Considerations: In countries with a widespread practice of sexual activity 
outside marriage or stable sexual unions, a prevalence estimate based on women in unions only would 
ignore a considerable number of current users of contraception. 
Strengths & Limitations: This indicator is widely used. To calculate a true contraceptive rate, the 
denominator should include only women at risk of pregnancy, which is difficult to measure. This in-dicator 
does not measure how long women have been using contraceptives or if they are using them 
correctly. 
Calculation 
x 100
Health Indicators: Child Survival and Environmental Health 
Child survival and environmental health activities work toward reducing 
child morbidity, mortality, and disease incidence. Child health and survival 
has been a focus for many large-scale international programs, including the 
Millennium Development Goals, the Integrated Management of Child-hood 
Illness strategy, the Global Alliance for Vaccines and Immunization, 
and the Roll Back Malaria initiative. 
Many communities served by PHE projects have identified child health 
and survival as a priority. The indicators in this section have been chosen 
to measure indicators at the input, process, output, and short- to medium-term 
outcome levels rather than the long-term outcomes of disease in-cidence 
and infant and child mortality. Together, these indicators cover 
a broad range of environmental and child health activities. Most PHE 
programs work on achieving the shorter-term outcomes in a smaller com-munity 
and contribute to a larger effort in the area to improve child health. 
Depending on their focus and resources, PHE programs can choose the 
indicators most appropriate for their own work. 
Table 7 – Health Indicators 
Outputs Outcomes 
Number of doses of tetanus 
vaccine distributed 
Number of insecti-cide- 
treated bed nets 
distributed 
Number of packets of oral 
rehydration salts distributed 
Number of safe water stor-age 
vessels distributed 
1. 
2. 
3. 
4. 
Percent of pregnant women 
receiving at least two doses 
of tetanus toxoid vaccine 
Percent of children aged 12- 
23 months fully immunized 
before 12 months 
Percent of households with 
access to an improved source 
of drinking water 
Time spent by household 
members to collect water 
5. 
6. 
7. 
8. 
Percent of households using 
an improved toilet facility 
Percent of households using 
soap in last 24 hours 
Percent of households stor-ing 
drinking water safely 
Percent of children under 
five years who slept under 
an insecticide-treated bed 
net the previous night 
Oral rehydration therapy 
use rate 
9. 
10. 
11. 
12. 
13. 
60 Part Three: Indicators
72 
Health 
9 percent of households using an improved toilet facility 
Level of Measurement: Outcome. 
Definition: An “improved” toilet facility means a flush/pour-flush toilet connected to a piped sewer 
system, septic tank, or pit; a ventilated-improved-pit latrine; simple pit latrine with slab that can be 
cleaned; or a composting toilet. An “unimproved” toilet facility includes flush/pour-flush toilets that 
empty elsewhere without connection to piped sewage systems, septic tanks, pits, or have unknown 
drainage; pit latrines without slabs or open pits; bucket latrines (where excreta are manually removed); 
hanging toilets/latrines; open defecation in field or bush or into plastic bags (flying toilets); and any 
other type of defecation. 
# of households that have working improved toilet facilities within their compounds 
total # of surveyed households 
Disaggregate: None. 
Purpose: Access to a functioning and improved toilet facility is essential for improving a household’s 
hygienic situation. This indicator measures access to such facilities. 
Data Sources: Population-based surveys. 
Time frame: Every two to five years. 
Data Collection Considerations: Household heads or caretakers should be interviewed about 
the type of toilet facility they use; afterwards interviewers should observe the facility to see if it is ac-cessible. 
Strengths & Limitations: This indicator does not measure whether toilet facilities are used or 
whether they are hygienic. 
Part Three: Indicators 
Calculation 
x 100
10 percent of households using soap in last 24 hours 
Calculation 
# of households reporting washing hands 
with soap before cooking/eating and after defecation over the past 24 hours 
total # of households surveyed 
x 100 
A Guide for Monitoring and Evaluating Population-Health-Environment Programs 73 
Health 
Level of Measurement: Outcome. 
Definition: This indicator measures the percent of households where soap is used on a regular basis. 
Use of soap at the most critical times (after defecation and before cooking or eating) for hand washing 
can decrease the risk of diarrheal disease. Although ash, sand, and mud are mentioned in the literature 
as local alternatives, neither their acceptability as a cleansing agent nor their actual use on a significant 
scale has been established. The use of soap for washing hands is commonly promoted through public-private 
partnerships. 
Disaggregate: None. 
Purpose: Washing hands with soap is essential to controlling diarrheal diseases. This indicator rep-resents 
actual behavior, not knowledge. Washing hands with soap at two critical times is suggested 
as a minimum but programs may choose to set higher targets if more frequent hand washing seems 
achievable. 
Data Sources: Population-based surveys. 
Time frame: Every two to five years. 
Data Collection Considerations: Alternatively, the interviewer can observe hand-washing 
facilities and techniques but this would not measure soap use, only the availability of hand-washing 
supplies. The household respondent (often the caregiver of the youngest child) is asked about their 
use of soap in the last 24 hours to reduce recall bias. It is important to also ask whether the household 
has soap. 
Strengths & Limitations: This indicator is easily collected, and observation allows for a reliable 
assessment of available conditions. However, this indicator does not necessarily measure proper water 
storage, hand washing techniques, or how often hands are washed on a regular basis.
Environment Indicators: Natural Resource Management, 
Species Preservation, Income-Generation Activities 
The environment indicators in this section focus both on system health 
(“species abundance and distribution”) and measuring healthy, sustain-able 
interactions between communities and their environments (“area un-der 
improved management”). While this section includes environmental 
outcomes, it also includes indicators that measure inputs, processes, and 
outputs. Environment indicator topics include habitat status, improved 
practices/management, natural resource management committees, and 
enforcement of environment protection laws. The environment indicators 
best suited for individual PHE or environment programs will depend on 
program goals and resources. 
Environment-related work in PHE programs naturally complements ef-forts 
to improve governance by building capacity of local government bod-ies, 
and even communities, to manage shared resources in a sustainable 
manner for current and future revenue generation or livelihood purposes. 
More than half of the environment indicators in this guidebook are value-added 
in the governance, livelihoods, and/or underserved populations sec-tors. 
Five indicators in this section are value-added for more than one area. 
This reflects the multi-sectoral approach of environment-related activities 
in PHE programs. 
Table 10 – Environmental Indicators 
Process/Outputs Outcomes 
Percent of communities in target area that 
have developed a community-based natural 
resource management plan 
Number of officers trained in laws and 
enforcement procedures and posted to a 
permanent enforcement position 
Hours of enforcement patrols logged 
Area of legally protected habitat 
Number of trees planted 
Percent of trees planted that survive 
Number of educational sessions on improved 
agricultural/marine practices 
1. 
2. 
3. 
4. 
5. 
6. 
7. 
Percent of community-based natural resource 
management plans that are approved by a 
government authority 
Percent of farmers/fishers who adopt 
improved agricultural/marine practices 
Area of habitat under improved management 
Area of secondary forest regenerated 
Population structure of species 
Species richness 
Species abundance and distribution 
8. 
9. 
10. 
11. 
12. 
13. 
14. 
78 Part Three: Indicators
92 
Environment 
8 Percent of community-based natural resource management 
plans that are approved by a government authority 
Level of Measurement: Outcome. 
Definition: NRM is the management of all activities that use, develop, and/or conserve air, water, land, 
plants, animals, and ecosystems. NRM committees are organized groups of people who meet regularly 
and attempt to practice natural resource management. A “government authority” is a person who works 
for the government and has the power to make legal decisions. “Approved” means the plan has been 
officially adopted as having the effect of law — it is enforceable. 
Calculation 
Disaggregate: None. 
Purpose: Community control at the local level can result in more sustainable environmental manage-ment 
where locals are likely to benefit from their choice of land or natural resource use. Often natural 
resources are owned and/or controlled by the state or commercial interests, even when local or indig-enous 
people have occupied a territory for many years or generations. When local communities have the 
legal right to manage local resources, they begin to value resources leading to ongoing conservation. 
Data Sources: Secondary records. 
Time frame: Annually. 
Data Collection Considerations: Examining secondary records such as legal documents may 
be sensitive in some countries. The project should work with the locally-based NRM committee and 
government authorities to receive documentation for this indicator. 
Strengths & Limitations: Measurements should be relatively easy and straight-forward to obtain 
since the indicator is unambiguous and has been legally defined. However, changing laws and policies 
can be a slow process that may occur over the course of several years, requiring ongoing monitoring. 
Although a community-based NRM plan may not have been approved by a government authority, it 
may still be in the process of being implemented by the community. This indicator does not reflect 
whether there is improved management on a local level. 
Part Three: Indicators 
# of government-approved community-based NRM plans 
# of community-based NRM plans finished and submitted 
to a government authority for approval 
x 100
Integration Indicators: Partnerships and Communication 
Recent assessments of integrated PHE programs in the Philippines have 
found that integrated programs have several advantages over stand-alone 
population, child health, or environment programs. The assessments found 
that integrated programs were cost-effective compared to the cost of sin-gle- 
sector population, child health and safety, or environment programs. 
Integrated programs also recruited a greater number of men to family 
planning efforts and a greater number of women and adolescents to en-vironment/ 
conservation efforts. Integrated programs also improved the 
perceived value of family planning efforts by packaging them with health 
interventions. 
One of the main long-term goals of integrated PHE programs is to ensure 
local ownership and sustainability. Therefore, the outcome indicator “num-ber 
of enabling local ordinances/policies/strategies/doctrines supporting 
PHE” is included in this section. Short-term outcome indicators in this 
section measure local PHE awareness (“number of policy-makers, media, 
and scholars knowledgeable about or aware of a specific PHE issue”), or 
the diversification of PHE efforts. 
Process indicators in this section measure linkages between materials 
(“number of linked messages/materials created”) and partnerships that in-crease 
integration (“number of new PHE partnerships created that make 
linkages among organizations or institutions from different sectors”). Out-put 
indicators in this section measure PHE promotion/education efforts 
(“number and frequency of PHE educational sessions provided in the tar-get 
community”). 
While any of the indicators in this section may be valuable for the M&E 
of integrated programs, programs that have a focused nature or that face 
limited budgets may concentrate on measuring a few indicators that best 
fit their needs. 
104 Part Three: Indicators
6 Number of policy-makers, media, and scholars knowledgeable 
about or aware of a specific PHE issue 
A Guide for Monitoring and Evaluating Population-Health-Environment Programs 111 
Integration 
Level of Measurement: Outcome. 
Definition: This is a number count of policy-makers, media members, and scholars knowledgeable 
about or aware of a specific PHE issue. The issue should be chosen by the project in advance and at 
the beginning of project implementation for tracking over the life of the project. This issue should be 
very specifically defined to avoid error in counting whether an influential person has knowledge or 
awareness. Choosing a broad and over-arching topic (i.e., the connection between family planning 
and environment) is not useful in counting this indicator. Similarly, policy-makers, media, and scholars 
should not already be involved with or active in the PHE issue selected by the project. They should 
normally be those who are targeted and monitored by the project on the specific issue selected. 
Disaggregate: By issue. 
Purpose: Persons of interest knowledgeable about the PHE issue is an indication that the program/ 
project’s messages reached those in power or those who are in a position of educating/impacting the 
public. 
Data Sources: Secondary sources, key informant interviews. 
Time frame: Semi-annually, annually. 
Data Collection Considerations: Complications in collecting this indicator with accuracy arise 
with the definition of knowledge or awareness. Knowledge and awareness are difficult to measure 
objectively without the ability to perform pre and post tests for the persons of influence. Using key 
informant interviews where targeted policy-makers, media members and scholars are interviewed 
about their knowledge or awareness of a PHE issue can assist in confirming information for this indica-tor. 
When possible, using an interview as a baseline and then repeating the interview at a scheduled 
interval can provide information over time about increased knowledge or committment to as specific 
PHE issue. 
Strengths & Limitations: This indicator does not give information on whether the policy-makers, 
media, or scholars are supportive of the specific PHE issue. It also does not measure the influential 
person’s level of knowledge or depth of awareness of the issue.
112 
Integration 
7 Percent of households knowledgeable about or aware of a 
Level of Measurement: Outcome. 
Definition: This is a percentage of the households in the project’s target area whose residents are 
knowledgeable about or aware of a specific PHE issue. The issue should be chosen by the project at 
the beginning of project implementation for tracking over the life of the project. This issue should be 
very specifically defined to avoid error in counting whether the person responding for the household 
has knowledge or awareness. Choosing a broad and over-arching topic (i.e., the connection between 
family planning and environment) is not useful in counting this indicator. The households included 
should normally be those who are targeted and monitored by the project on the specific issue selected 
for this indicator to be useful in determining whether the household gained the knowledge as a result 
of the PHE project. 
Calculation 
# of households surveyed that are knowledgeable about a specific PHE issue 
total # surveyed households 
x 100 
Part Three: Indicators 
specific PHE issue 
Disaggregate: PHE issue covered in survey. 
Purpose: Household knowledge of a specific PHE issue may be an indication of the project’s success 
in communicating the PHE issue or in the increasing awareness of the community to the integration 
between human health and the natural environment. 
Data Source: Population-based survey. 
Time frame: Every two to five years. 
Data Collection Considerations: The specific PHE issues should be determined in advance, re-main 
consistent, and be monitored over time. When collecting information at the household level in a 
population-based survey, special attention should be made not to bias results by suggesting answers. 
Strengths & Limitations: This indicator only measures knowledge and does not indicate behavior 
change or where the knowledge was acquired. The questions utilized to measure knowledge must be 
carefully worded and pretested to ensure accurate measurement.

More Related Content

What's hot

What is impact evaluation?
What is impact evaluation?What is impact evaluation?
What is impact evaluation?David Evans
 
National health program evaluation
National health program evaluationNational health program evaluation
National health program evaluationrahul gajbhiye
 
Beyond Reporting: Monitoring and Evaluation as a Health Systems Strengthening...
Beyond Reporting: Monitoring and Evaluation as a Health Systems Strengthening...Beyond Reporting: Monitoring and Evaluation as a Health Systems Strengthening...
Beyond Reporting: Monitoring and Evaluation as a Health Systems Strengthening...MEASURE Evaluation
 
Evaluating an Integrated Family Planning and Mother/Child Health Program
Evaluating an Integrated Family Planning and Mother/Child Health ProgramEvaluating an Integrated Family Planning and Mother/Child Health Program
Evaluating an Integrated Family Planning and Mother/Child Health ProgramMEASURE Evaluation
 
Monitoring and Evaluation of Health Services
Monitoring and Evaluation of Health ServicesMonitoring and Evaluation of Health Services
Monitoring and Evaluation of Health ServicesNayyar Kazmi
 
Evolution of Family Planning Impact Evaluation: New contexts and methodologic...
Evolution of Family Planning Impact Evaluation: New contexts and methodologic...Evolution of Family Planning Impact Evaluation: New contexts and methodologic...
Evolution of Family Planning Impact Evaluation: New contexts and methodologic...MEASURE Evaluation
 
Gilligan quantitative impact eval methods
Gilligan quantitative impact eval methodsGilligan quantitative impact eval methods
Gilligan quantitative impact eval methodsgenderassets
 
Family planning 170706
Family planning 170706Family planning 170706
Family planning 170706kristofferryan
 
Use of Routine Data for Economic Evaluations
Use of Routine Data for Economic EvaluationsUse of Routine Data for Economic Evaluations
Use of Routine Data for Economic EvaluationsMEASURE Evaluation
 
Lessons learned in using process tracing for evaluation
Lessons learned in using process tracing for evaluationLessons learned in using process tracing for evaluation
Lessons learned in using process tracing for evaluationMEASURE Evaluation
 
What’s Next? Practical Implementation Lessons from the Partnership for HIV-Fr...
What’s Next?Practical Implementation Lessons from the Partnership for HIV-Fr...What’s Next?Practical Implementation Lessons from the Partnership for HIV-Fr...
What’s Next? Practical Implementation Lessons from the Partnership for HIV-Fr...MEASURE Evaluation
 
Measuring Impact Qualitatively
Measuring Impact QualitativelyMeasuring Impact Qualitatively
Measuring Impact QualitativelyMEASURE Evaluation
 
Impact evaluation
Impact evaluationImpact evaluation
Impact evaluationCarlo Magno
 
Road map to reducing patient falls using an integrative approach toronto grac...
Road map to reducing patient falls using an integrative approach toronto grac...Road map to reducing patient falls using an integrative approach toronto grac...
Road map to reducing patient falls using an integrative approach toronto grac...Canadian Patient Safety Institute
 
A Role for Mathematical Models in Program Science
A Role for Mathematical Models in Program ScienceA Role for Mathematical Models in Program Science
A Role for Mathematical Models in Program Scienceamusten
 
Fostering research for policy and practitioners lessons and opportunities
Fostering research for policy and practitioners lessons and opportunitiesFostering research for policy and practitioners lessons and opportunities
Fostering research for policy and practitioners lessons and opportunitiesUNICEF Office of Research - Innocenti
 

What's hot (20)

What is impact evaluation?
What is impact evaluation?What is impact evaluation?
What is impact evaluation?
 
National health program evaluation
National health program evaluationNational health program evaluation
National health program evaluation
 
Monitoring, Evaluation and Reporting
Monitoring, Evaluation and ReportingMonitoring, Evaluation and Reporting
Monitoring, Evaluation and Reporting
 
Beyond Reporting: Monitoring and Evaluation as a Health Systems Strengthening...
Beyond Reporting: Monitoring and Evaluation as a Health Systems Strengthening...Beyond Reporting: Monitoring and Evaluation as a Health Systems Strengthening...
Beyond Reporting: Monitoring and Evaluation as a Health Systems Strengthening...
 
Monitoring and evaluation for hiv
Monitoring and evaluation for hivMonitoring and evaluation for hiv
Monitoring and evaluation for hiv
 
Evaluating an Integrated Family Planning and Mother/Child Health Program
Evaluating an Integrated Family Planning and Mother/Child Health ProgramEvaluating an Integrated Family Planning and Mother/Child Health Program
Evaluating an Integrated Family Planning and Mother/Child Health Program
 
Monitoring and Evaluation of Health Services
Monitoring and Evaluation of Health ServicesMonitoring and Evaluation of Health Services
Monitoring and Evaluation of Health Services
 
Monitoring-and-Evaluation-Preconference-CCIH-2017
Monitoring-and-Evaluation-Preconference-CCIH-2017Monitoring-and-Evaluation-Preconference-CCIH-2017
Monitoring-and-Evaluation-Preconference-CCIH-2017
 
Evolution of Family Planning Impact Evaluation: New contexts and methodologic...
Evolution of Family Planning Impact Evaluation: New contexts and methodologic...Evolution of Family Planning Impact Evaluation: New contexts and methodologic...
Evolution of Family Planning Impact Evaluation: New contexts and methodologic...
 
Gilligan quantitative impact eval methods
Gilligan quantitative impact eval methodsGilligan quantitative impact eval methods
Gilligan quantitative impact eval methods
 
Family planning 170706
Family planning 170706Family planning 170706
Family planning 170706
 
Use of Routine Data for Economic Evaluations
Use of Routine Data for Economic EvaluationsUse of Routine Data for Economic Evaluations
Use of Routine Data for Economic Evaluations
 
Lessons learned in using process tracing for evaluation
Lessons learned in using process tracing for evaluationLessons learned in using process tracing for evaluation
Lessons learned in using process tracing for evaluation
 
What’s Next? Practical Implementation Lessons from the Partnership for HIV-Fr...
What’s Next?Practical Implementation Lessons from the Partnership for HIV-Fr...What’s Next?Practical Implementation Lessons from the Partnership for HIV-Fr...
What’s Next? Practical Implementation Lessons from the Partnership for HIV-Fr...
 
Measuring Impact Qualitatively
Measuring Impact QualitativelyMeasuring Impact Qualitatively
Measuring Impact Qualitatively
 
Impact evaluation
Impact evaluationImpact evaluation
Impact evaluation
 
Impact evaluation an overview
Impact evaluation  an overviewImpact evaluation  an overview
Impact evaluation an overview
 
Road map to reducing patient falls using an integrative approach toronto grac...
Road map to reducing patient falls using an integrative approach toronto grac...Road map to reducing patient falls using an integrative approach toronto grac...
Road map to reducing patient falls using an integrative approach toronto grac...
 
A Role for Mathematical Models in Program Science
A Role for Mathematical Models in Program ScienceA Role for Mathematical Models in Program Science
A Role for Mathematical Models in Program Science
 
Fostering research for policy and practitioners lessons and opportunities
Fostering research for policy and practitioners lessons and opportunitiesFostering research for policy and practitioners lessons and opportunities
Fostering research for policy and practitioners lessons and opportunities
 

Viewers also liked

10 Project Proposal Writing
10 Project Proposal Writing10 Project Proposal Writing
10 Project Proposal WritingTony
 
Indicators of health
Indicators of healthIndicators of health
Indicators of healthBharat Paul
 
Ten rules of project risk management
Ten rules of project risk managementTen rules of project risk management
Ten rules of project risk managementTony
 
Remote solar project Ecogeneration Magazine
Remote solar project  Ecogeneration MagazineRemote solar project  Ecogeneration Magazine
Remote solar project Ecogeneration MagazineTony
 
New microsoft office power point presentation
New microsoft office power point presentationNew microsoft office power point presentation
New microsoft office power point presentationChandu Lalu
 
Digester cleaning
Digester cleaningDigester cleaning
Digester cleaningBio Nomic
 
Terrat | Aug-15 | Where are smart villages? 1
Terrat | Aug-15 | Where are smart villages? 1Terrat | Aug-15 | Where are smart villages? 1
Terrat | Aug-15 | Where are smart villages? 1Smart Villages
 
Strong Towns Presentation for CommunityMatters in Newport Vermont
Strong Towns Presentation for CommunityMatters in Newport VermontStrong Towns Presentation for CommunityMatters in Newport Vermont
Strong Towns Presentation for CommunityMatters in Newport VermontCommunityMatters
 
Sec 5 NA Development
Sec 5 NA DevelopmentSec 5 NA Development
Sec 5 NA Developmentchua.geog
 
11 Problem Solving
11 Problem Solving11 Problem Solving
11 Problem SolvingTony
 
Mortality and mobidity indicators
Mortality and mobidity indicatorsMortality and mobidity indicators
Mortality and mobidity indicatorsPriyamadhaba Behera
 
Policy & Procedure Manual (sample)
Policy & Procedure Manual (sample)Policy & Procedure Manual (sample)
Policy & Procedure Manual (sample)Tony
 
Insect, vector and rodent control
Insect, vector and rodent controlInsect, vector and rodent control
Insect, vector and rodent controlHasan Nomani
 
Population Distribution & Density
Population Distribution & DensityPopulation Distribution & Density
Population Distribution & Densityclemaitre
 

Viewers also liked (20)

Population Indicators
Population IndicatorsPopulation Indicators
Population Indicators
 
10 Project Proposal Writing
10 Project Proposal Writing10 Project Proposal Writing
10 Project Proposal Writing
 
Indicators of health
Indicators of healthIndicators of health
Indicators of health
 
Health Indicators.. Dr.Padmesh
Health Indicators.. Dr.PadmeshHealth Indicators.. Dr.Padmesh
Health Indicators.. Dr.Padmesh
 
Ten rules of project risk management
Ten rules of project risk managementTen rules of project risk management
Ten rules of project risk management
 
Rain Water Tank Project Brief
Rain Water Tank Project BriefRain Water Tank Project Brief
Rain Water Tank Project Brief
 
Remote solar project Ecogeneration Magazine
Remote solar project  Ecogeneration MagazineRemote solar project  Ecogeneration Magazine
Remote solar project Ecogeneration Magazine
 
Population density
Population densityPopulation density
Population density
 
New microsoft office power point presentation
New microsoft office power point presentationNew microsoft office power point presentation
New microsoft office power point presentation
 
Digester cleaning
Digester cleaningDigester cleaning
Digester cleaning
 
Urban Hazards and Megacities
Urban Hazards and MegacitiesUrban Hazards and Megacities
Urban Hazards and Megacities
 
Terrat | Aug-15 | Where are smart villages? 1
Terrat | Aug-15 | Where are smart villages? 1Terrat | Aug-15 | Where are smart villages? 1
Terrat | Aug-15 | Where are smart villages? 1
 
Strong Towns Presentation for CommunityMatters in Newport Vermont
Strong Towns Presentation for CommunityMatters in Newport VermontStrong Towns Presentation for CommunityMatters in Newport Vermont
Strong Towns Presentation for CommunityMatters in Newport Vermont
 
Sec 5 NA Development
Sec 5 NA DevelopmentSec 5 NA Development
Sec 5 NA Development
 
11 Problem Solving
11 Problem Solving11 Problem Solving
11 Problem Solving
 
Mortality and mobidity indicators
Mortality and mobidity indicatorsMortality and mobidity indicators
Mortality and mobidity indicators
 
Policy & Procedure Manual (sample)
Policy & Procedure Manual (sample)Policy & Procedure Manual (sample)
Policy & Procedure Manual (sample)
 
Kenya animal genetic resources centre (kagrc) profile h.k wamukuru
Kenya animal genetic resources centre (kagrc) profile   h.k wamukuruKenya animal genetic resources centre (kagrc) profile   h.k wamukuru
Kenya animal genetic resources centre (kagrc) profile h.k wamukuru
 
Insect, vector and rodent control
Insect, vector and rodent controlInsect, vector and rodent control
Insect, vector and rodent control
 
Population Distribution & Density
Population Distribution & DensityPopulation Distribution & Density
Population Distribution & Density
 

Similar to Population Indicators Handout

4508 Final Quality Project Part 2 Clinical Quality Measur.docx
4508 Final Quality Project Part 2 Clinical Quality Measur.docx4508 Final Quality Project Part 2 Clinical Quality Measur.docx
4508 Final Quality Project Part 2 Clinical Quality Measur.docxblondellchancy
 
4508 Final Quality Project Part 2 Clinical Quality Measur
4508 Final Quality Project Part 2 Clinical Quality Measur4508 Final Quality Project Part 2 Clinical Quality Measur
4508 Final Quality Project Part 2 Clinical Quality Measurromeliadoan
 
Coaching employees-to-better-health
Coaching employees-to-better-healthCoaching employees-to-better-health
Coaching employees-to-better-healthGianmarco Brunetti
 
Ueda2015 tupelo.nurses role in dm prevention dr.martyn molnar
Ueda2015 tupelo.nurses role in dm prevention dr.martyn molnarUeda2015 tupelo.nurses role in dm prevention dr.martyn molnar
Ueda2015 tupelo.nurses role in dm prevention dr.martyn molnarueda2015
 
176482 633754879714110000
176482 633754879714110000176482 633754879714110000
176482 633754879714110000guestabde8b
 
How Do Organizations in Healthcare Measure the Value Proposition?
How Do Organizations in Healthcare Measure the Value Proposition? How Do Organizations in Healthcare Measure the Value Proposition?
How Do Organizations in Healthcare Measure the Value Proposition? AHCPhysicians
 
Evaluation of health services
Evaluation of health servicesEvaluation of health services
Evaluation of health serviceskavita yadav
 
Can vouchers help move health systems toward universal health coverage?
Can vouchers help move health systems toward universal health coverage? Can vouchers help move health systems toward universal health coverage?
Can vouchers help move health systems toward universal health coverage? Ben Bellows
 
Running Head Colorectal Cancer Prevention Program-Evaluation Des.docx
 Running Head Colorectal Cancer Prevention Program-Evaluation Des.docx Running Head Colorectal Cancer Prevention Program-Evaluation Des.docx
Running Head Colorectal Cancer Prevention Program-Evaluation Des.docxaryan532920
 
Budget RESEARCHBudget Template - page 1 of 2GRANT(For Internal Use.docx
Budget RESEARCHBudget Template - page 1 of 2GRANT(For Internal Use.docxBudget RESEARCHBudget Template - page 1 of 2GRANT(For Internal Use.docx
Budget RESEARCHBudget Template - page 1 of 2GRANT(For Internal Use.docxAASTHA76
 
Operations Research: Methods, Challenges, Emerging Lessons, and Opportunities...
Operations Research: Methods, Challenges, Emerging Lessons, and Opportunities...Operations Research: Methods, Challenges, Emerging Lessons, and Opportunities...
Operations Research: Methods, Challenges, Emerging Lessons, and Opportunities...CORE Group
 
The care group model davis
The care group model davisThe care group model davis
The care group model davisCORE Group
 
Importance of Population Health Management
Importance of Population Health ManagementImportance of Population Health Management
Importance of Population Health ManagementNous Infosystems
 
Steps to building_a_telehealth_program
Steps to building_a_telehealth_programSteps to building_a_telehealth_program
Steps to building_a_telehealth_programTrustRobin
 
Measuring to Manage Progress toward Universal Health Coverage
Measuring to Manage Progress toward Universal Health CoverageMeasuring to Manage Progress toward Universal Health Coverage
Measuring to Manage Progress toward Universal Health CoverageBen Bellows
 
Population Health Management
Population Health ManagementPopulation Health Management
Population Health ManagementVitreosHealth
 

Similar to Population Indicators Handout (20)

4508 Final Quality Project Part 2 Clinical Quality Measur.docx
4508 Final Quality Project Part 2 Clinical Quality Measur.docx4508 Final Quality Project Part 2 Clinical Quality Measur.docx
4508 Final Quality Project Part 2 Clinical Quality Measur.docx
 
4508 Final Quality Project Part 2 Clinical Quality Measur
4508 Final Quality Project Part 2 Clinical Quality Measur4508 Final Quality Project Part 2 Clinical Quality Measur
4508 Final Quality Project Part 2 Clinical Quality Measur
 
Coaching employees-to-better-health
Coaching employees-to-better-healthCoaching employees-to-better-health
Coaching employees-to-better-health
 
Ueda2015 tupelo.nurses role in dm prevention dr.martyn molnar
Ueda2015 tupelo.nurses role in dm prevention dr.martyn molnarUeda2015 tupelo.nurses role in dm prevention dr.martyn molnar
Ueda2015 tupelo.nurses role in dm prevention dr.martyn molnar
 
176482 633754879714110000
176482 633754879714110000176482 633754879714110000
176482 633754879714110000
 
How Do Organizations in Healthcare Measure the Value Proposition?
How Do Organizations in Healthcare Measure the Value Proposition? How Do Organizations in Healthcare Measure the Value Proposition?
How Do Organizations in Healthcare Measure the Value Proposition?
 
Evaluation of health services
Evaluation of health servicesEvaluation of health services
Evaluation of health services
 
Can vouchers help move health systems toward universal health coverage?
Can vouchers help move health systems toward universal health coverage? Can vouchers help move health systems toward universal health coverage?
Can vouchers help move health systems toward universal health coverage?
 
Inception2
Inception2Inception2
Inception2
 
Running Head Colorectal Cancer Prevention Program-Evaluation Des.docx
 Running Head Colorectal Cancer Prevention Program-Evaluation Des.docx Running Head Colorectal Cancer Prevention Program-Evaluation Des.docx
Running Head Colorectal Cancer Prevention Program-Evaluation Des.docx
 
Budget RESEARCHBudget Template - page 1 of 2GRANT(For Internal Use.docx
Budget RESEARCHBudget Template - page 1 of 2GRANT(For Internal Use.docxBudget RESEARCHBudget Template - page 1 of 2GRANT(For Internal Use.docx
Budget RESEARCHBudget Template - page 1 of 2GRANT(For Internal Use.docx
 
Operations Research: Methods, Challenges, Emerging Lessons, and Opportunities...
Operations Research: Methods, Challenges, Emerging Lessons, and Opportunities...Operations Research: Methods, Challenges, Emerging Lessons, and Opportunities...
Operations Research: Methods, Challenges, Emerging Lessons, and Opportunities...
 
The care group model davis
The care group model davisThe care group model davis
The care group model davis
 
00.SM2015-Technical Note July 2015- ENG
00.SM2015-Technical Note  July 2015- ENG00.SM2015-Technical Note  July 2015- ENG
00.SM2015-Technical Note July 2015- ENG
 
Importance of Population Health Management
Importance of Population Health ManagementImportance of Population Health Management
Importance of Population Health Management
 
Primary Health Care Strategy
Primary Health Care StrategyPrimary Health Care Strategy
Primary Health Care Strategy
 
Primary Health Care Strategy
Primary Health Care StrategyPrimary Health Care Strategy
Primary Health Care Strategy
 
Steps to building_a_telehealth_program
Steps to building_a_telehealth_programSteps to building_a_telehealth_program
Steps to building_a_telehealth_program
 
Measuring to Manage Progress toward Universal Health Coverage
Measuring to Manage Progress toward Universal Health CoverageMeasuring to Manage Progress toward Universal Health Coverage
Measuring to Manage Progress toward Universal Health Coverage
 
Population Health Management
Population Health ManagementPopulation Health Management
Population Health Management
 

More from Tony

Rights Advocacy in Ratanakiri - health exchange news
Rights Advocacy in Ratanakiri - health exchange newsRights Advocacy in Ratanakiri - health exchange news
Rights Advocacy in Ratanakiri - health exchange newsTony
 
Watsan training sample proposal
Watsan training sample proposalWatsan training sample proposal
Watsan training sample proposalTony
 
Module 8 presenter notes
Module 8 presenter notesModule 8 presenter notes
Module 8 presenter notesTony
 
Exercise: Watsan logframe with blanks
Exercise: Watsan logframe with blanksExercise: Watsan logframe with blanks
Exercise: Watsan logframe with blanksTony
 
Progress Reporting - notes
Progress Reporting - notesProgress Reporting - notes
Progress Reporting - notesTony
 
Exercise cards - logframe components
Exercise cards - logframe componentsExercise cards - logframe components
Exercise cards - logframe componentsTony
 
Issues Risklog
Issues RisklogIssues Risklog
Issues RisklogTony
 
A Guide to Logical Framework Analysis
A Guide to Logical Framework AnalysisA Guide to Logical Framework Analysis
A Guide to Logical Framework AnalysisTony
 
Stakeholder Analysis
Stakeholder AnalysisStakeholder Analysis
Stakeholder AnalysisTony
 
Logical framework guide
Logical framework guideLogical framework guide
Logical framework guideTony
 
Project Planning module 5 presenter notes
Project Planning module 5 presenter notesProject Planning module 5 presenter notes
Project Planning module 5 presenter notesTony
 
Project Planning module 5 Handout
Project Planning module 5 HandoutProject Planning module 5 Handout
Project Planning module 5 HandoutTony
 
Project management terms
Project management termsProject management terms
Project management termsTony
 
3 proj plan notes
3 proj plan notes3 proj plan notes
3 proj plan notesTony
 
3 proj plan handouts
3 proj plan handouts3 proj plan handouts
3 proj plan handoutsTony
 
7 M&E: Indicators
7 M&E: Indicators7 M&E: Indicators
7 M&E: IndicatorsTony
 
8 M&E: Data Sources
8 M&E: Data Sources8 M&E: Data Sources
8 M&E: Data SourcesTony
 
6 M&E - Monitoring and Evaluation of Aid Projects
6 M&E - Monitoring and Evaluation of Aid Projects6 M&E - Monitoring and Evaluation of Aid Projects
6 M&E - Monitoring and Evaluation of Aid ProjectsTony
 
5 The Logical Framework - a short course for NGOs
5 The Logical Framework - a short course for NGOs5 The Logical Framework - a short course for NGOs
5 The Logical Framework - a short course for NGOsTony
 
4 Project Pre-Planning & Stakeholder Analysis
4 Project Pre-Planning & Stakeholder Analysis4 Project Pre-Planning & Stakeholder Analysis
4 Project Pre-Planning & Stakeholder AnalysisTony
 

More from Tony (20)

Rights Advocacy in Ratanakiri - health exchange news
Rights Advocacy in Ratanakiri - health exchange newsRights Advocacy in Ratanakiri - health exchange news
Rights Advocacy in Ratanakiri - health exchange news
 
Watsan training sample proposal
Watsan training sample proposalWatsan training sample proposal
Watsan training sample proposal
 
Module 8 presenter notes
Module 8 presenter notesModule 8 presenter notes
Module 8 presenter notes
 
Exercise: Watsan logframe with blanks
Exercise: Watsan logframe with blanksExercise: Watsan logframe with blanks
Exercise: Watsan logframe with blanks
 
Progress Reporting - notes
Progress Reporting - notesProgress Reporting - notes
Progress Reporting - notes
 
Exercise cards - logframe components
Exercise cards - logframe componentsExercise cards - logframe components
Exercise cards - logframe components
 
Issues Risklog
Issues RisklogIssues Risklog
Issues Risklog
 
A Guide to Logical Framework Analysis
A Guide to Logical Framework AnalysisA Guide to Logical Framework Analysis
A Guide to Logical Framework Analysis
 
Stakeholder Analysis
Stakeholder AnalysisStakeholder Analysis
Stakeholder Analysis
 
Logical framework guide
Logical framework guideLogical framework guide
Logical framework guide
 
Project Planning module 5 presenter notes
Project Planning module 5 presenter notesProject Planning module 5 presenter notes
Project Planning module 5 presenter notes
 
Project Planning module 5 Handout
Project Planning module 5 HandoutProject Planning module 5 Handout
Project Planning module 5 Handout
 
Project management terms
Project management termsProject management terms
Project management terms
 
3 proj plan notes
3 proj plan notes3 proj plan notes
3 proj plan notes
 
3 proj plan handouts
3 proj plan handouts3 proj plan handouts
3 proj plan handouts
 
7 M&E: Indicators
7 M&E: Indicators7 M&E: Indicators
7 M&E: Indicators
 
8 M&E: Data Sources
8 M&E: Data Sources8 M&E: Data Sources
8 M&E: Data Sources
 
6 M&E - Monitoring and Evaluation of Aid Projects
6 M&E - Monitoring and Evaluation of Aid Projects6 M&E - Monitoring and Evaluation of Aid Projects
6 M&E - Monitoring and Evaluation of Aid Projects
 
5 The Logical Framework - a short course for NGOs
5 The Logical Framework - a short course for NGOs5 The Logical Framework - a short course for NGOs
5 The Logical Framework - a short course for NGOs
 
4 Project Pre-Planning & Stakeholder Analysis
4 Project Pre-Planning & Stakeholder Analysis4 Project Pre-Planning & Stakeholder Analysis
4 Project Pre-Planning & Stakeholder Analysis
 

Recently uploaded

Marketplace and Quality Assurance Presentation - Vincent Chirchir
Marketplace and Quality Assurance Presentation - Vincent ChirchirMarketplace and Quality Assurance Presentation - Vincent Chirchir
Marketplace and Quality Assurance Presentation - Vincent Chirchirictsugar
 
8447779800, Low rate Call girls in Uttam Nagar Delhi NCR
8447779800, Low rate Call girls in Uttam Nagar Delhi NCR8447779800, Low rate Call girls in Uttam Nagar Delhi NCR
8447779800, Low rate Call girls in Uttam Nagar Delhi NCRashishs7044
 
Flow Your Strategy at Flight Levels Day 2024
Flow Your Strategy at Flight Levels Day 2024Flow Your Strategy at Flight Levels Day 2024
Flow Your Strategy at Flight Levels Day 2024Kirill Klimov
 
Youth Involvement in an Innovative Coconut Value Chain by Mwalimu Menza
Youth Involvement in an Innovative Coconut Value Chain by Mwalimu MenzaYouth Involvement in an Innovative Coconut Value Chain by Mwalimu Menza
Youth Involvement in an Innovative Coconut Value Chain by Mwalimu Menzaictsugar
 
FULL ENJOY Call girls in Paharganj Delhi | 8377087607
FULL ENJOY Call girls in Paharganj Delhi | 8377087607FULL ENJOY Call girls in Paharganj Delhi | 8377087607
FULL ENJOY Call girls in Paharganj Delhi | 8377087607dollysharma2066
 
Islamabad Escorts | Call 03070433345 | Escort Service in Islamabad
Islamabad Escorts | Call 03070433345 | Escort Service in IslamabadIslamabad Escorts | Call 03070433345 | Escort Service in Islamabad
Islamabad Escorts | Call 03070433345 | Escort Service in IslamabadAyesha Khan
 
Case study on tata clothing brand zudio in detail
Case study on tata clothing brand zudio in detailCase study on tata clothing brand zudio in detail
Case study on tata clothing brand zudio in detailAriel592675
 
2024 Numerator Consumer Study of Cannabis Usage
2024 Numerator Consumer Study of Cannabis Usage2024 Numerator Consumer Study of Cannabis Usage
2024 Numerator Consumer Study of Cannabis UsageNeil Kimberley
 
Market Sizes Sample Report - 2024 Edition
Market Sizes Sample Report - 2024 EditionMarket Sizes Sample Report - 2024 Edition
Market Sizes Sample Report - 2024 EditionMintel Group
 
(Best) ENJOY Call Girls in Faridabad Ex | 8377087607
(Best) ENJOY Call Girls in Faridabad Ex | 8377087607(Best) ENJOY Call Girls in Faridabad Ex | 8377087607
(Best) ENJOY Call Girls in Faridabad Ex | 8377087607dollysharma2066
 
Buy gmail accounts.pdf Buy Old Gmail Accounts
Buy gmail accounts.pdf Buy Old Gmail AccountsBuy gmail accounts.pdf Buy Old Gmail Accounts
Buy gmail accounts.pdf Buy Old Gmail AccountsBuy Verified Accounts
 
Independent Call Girls Andheri Nightlaila 9967584737
Independent Call Girls Andheri Nightlaila 9967584737Independent Call Girls Andheri Nightlaila 9967584737
Independent Call Girls Andheri Nightlaila 9967584737Riya Pathan
 
Call US-88OO1O2216 Call Girls In Mahipalpur Female Escort Service
Call US-88OO1O2216 Call Girls In Mahipalpur Female Escort ServiceCall US-88OO1O2216 Call Girls In Mahipalpur Female Escort Service
Call US-88OO1O2216 Call Girls In Mahipalpur Female Escort Servicecallgirls2057
 
Kenya’s Coconut Value Chain by Gatsby Africa
Kenya’s Coconut Value Chain by Gatsby AfricaKenya’s Coconut Value Chain by Gatsby Africa
Kenya’s Coconut Value Chain by Gatsby Africaictsugar
 
NewBase 19 April 2024 Energy News issue - 1717 by Khaled Al Awadi.pdf
NewBase  19 April  2024  Energy News issue - 1717 by Khaled Al Awadi.pdfNewBase  19 April  2024  Energy News issue - 1717 by Khaled Al Awadi.pdf
NewBase 19 April 2024 Energy News issue - 1717 by Khaled Al Awadi.pdfKhaled Al Awadi
 
8447779800, Low rate Call girls in Shivaji Enclave Delhi NCR
8447779800, Low rate Call girls in Shivaji Enclave Delhi NCR8447779800, Low rate Call girls in Shivaji Enclave Delhi NCR
8447779800, Low rate Call girls in Shivaji Enclave Delhi NCRashishs7044
 
Global Scenario On Sustainable and Resilient Coconut Industry by Dr. Jelfina...
Global Scenario On Sustainable  and Resilient Coconut Industry by Dr. Jelfina...Global Scenario On Sustainable  and Resilient Coconut Industry by Dr. Jelfina...
Global Scenario On Sustainable and Resilient Coconut Industry by Dr. Jelfina...ictsugar
 

Recently uploaded (20)

Marketplace and Quality Assurance Presentation - Vincent Chirchir
Marketplace and Quality Assurance Presentation - Vincent ChirchirMarketplace and Quality Assurance Presentation - Vincent Chirchir
Marketplace and Quality Assurance Presentation - Vincent Chirchir
 
8447779800, Low rate Call girls in Uttam Nagar Delhi NCR
8447779800, Low rate Call girls in Uttam Nagar Delhi NCR8447779800, Low rate Call girls in Uttam Nagar Delhi NCR
8447779800, Low rate Call girls in Uttam Nagar Delhi NCR
 
Flow Your Strategy at Flight Levels Day 2024
Flow Your Strategy at Flight Levels Day 2024Flow Your Strategy at Flight Levels Day 2024
Flow Your Strategy at Flight Levels Day 2024
 
Youth Involvement in an Innovative Coconut Value Chain by Mwalimu Menza
Youth Involvement in an Innovative Coconut Value Chain by Mwalimu MenzaYouth Involvement in an Innovative Coconut Value Chain by Mwalimu Menza
Youth Involvement in an Innovative Coconut Value Chain by Mwalimu Menza
 
FULL ENJOY Call girls in Paharganj Delhi | 8377087607
FULL ENJOY Call girls in Paharganj Delhi | 8377087607FULL ENJOY Call girls in Paharganj Delhi | 8377087607
FULL ENJOY Call girls in Paharganj Delhi | 8377087607
 
Islamabad Escorts | Call 03070433345 | Escort Service in Islamabad
Islamabad Escorts | Call 03070433345 | Escort Service in IslamabadIslamabad Escorts | Call 03070433345 | Escort Service in Islamabad
Islamabad Escorts | Call 03070433345 | Escort Service in Islamabad
 
Case study on tata clothing brand zudio in detail
Case study on tata clothing brand zudio in detailCase study on tata clothing brand zudio in detail
Case study on tata clothing brand zudio in detail
 
2024 Numerator Consumer Study of Cannabis Usage
2024 Numerator Consumer Study of Cannabis Usage2024 Numerator Consumer Study of Cannabis Usage
2024 Numerator Consumer Study of Cannabis Usage
 
Market Sizes Sample Report - 2024 Edition
Market Sizes Sample Report - 2024 EditionMarket Sizes Sample Report - 2024 Edition
Market Sizes Sample Report - 2024 Edition
 
(Best) ENJOY Call Girls in Faridabad Ex | 8377087607
(Best) ENJOY Call Girls in Faridabad Ex | 8377087607(Best) ENJOY Call Girls in Faridabad Ex | 8377087607
(Best) ENJOY Call Girls in Faridabad Ex | 8377087607
 
Enjoy ➥8448380779▻ Call Girls In Sector 18 Noida Escorts Delhi NCR
Enjoy ➥8448380779▻ Call Girls In Sector 18 Noida Escorts Delhi NCREnjoy ➥8448380779▻ Call Girls In Sector 18 Noida Escorts Delhi NCR
Enjoy ➥8448380779▻ Call Girls In Sector 18 Noida Escorts Delhi NCR
 
No-1 Call Girls In Goa 93193 VIP 73153 Escort service In North Goa Panaji, Ca...
No-1 Call Girls In Goa 93193 VIP 73153 Escort service In North Goa Panaji, Ca...No-1 Call Girls In Goa 93193 VIP 73153 Escort service In North Goa Panaji, Ca...
No-1 Call Girls In Goa 93193 VIP 73153 Escort service In North Goa Panaji, Ca...
 
Buy gmail accounts.pdf Buy Old Gmail Accounts
Buy gmail accounts.pdf Buy Old Gmail AccountsBuy gmail accounts.pdf Buy Old Gmail Accounts
Buy gmail accounts.pdf Buy Old Gmail Accounts
 
Independent Call Girls Andheri Nightlaila 9967584737
Independent Call Girls Andheri Nightlaila 9967584737Independent Call Girls Andheri Nightlaila 9967584737
Independent Call Girls Andheri Nightlaila 9967584737
 
Call US-88OO1O2216 Call Girls In Mahipalpur Female Escort Service
Call US-88OO1O2216 Call Girls In Mahipalpur Female Escort ServiceCall US-88OO1O2216 Call Girls In Mahipalpur Female Escort Service
Call US-88OO1O2216 Call Girls In Mahipalpur Female Escort Service
 
Kenya’s Coconut Value Chain by Gatsby Africa
Kenya’s Coconut Value Chain by Gatsby AfricaKenya’s Coconut Value Chain by Gatsby Africa
Kenya’s Coconut Value Chain by Gatsby Africa
 
NewBase 19 April 2024 Energy News issue - 1717 by Khaled Al Awadi.pdf
NewBase  19 April  2024  Energy News issue - 1717 by Khaled Al Awadi.pdfNewBase  19 April  2024  Energy News issue - 1717 by Khaled Al Awadi.pdf
NewBase 19 April 2024 Energy News issue - 1717 by Khaled Al Awadi.pdf
 
Call Us ➥9319373153▻Call Girls In North Goa
Call Us ➥9319373153▻Call Girls In North GoaCall Us ➥9319373153▻Call Girls In North Goa
Call Us ➥9319373153▻Call Girls In North Goa
 
8447779800, Low rate Call girls in Shivaji Enclave Delhi NCR
8447779800, Low rate Call girls in Shivaji Enclave Delhi NCR8447779800, Low rate Call girls in Shivaji Enclave Delhi NCR
8447779800, Low rate Call girls in Shivaji Enclave Delhi NCR
 
Global Scenario On Sustainable and Resilient Coconut Industry by Dr. Jelfina...
Global Scenario On Sustainable  and Resilient Coconut Industry by Dr. Jelfina...Global Scenario On Sustainable  and Resilient Coconut Industry by Dr. Jelfina...
Global Scenario On Sustainable and Resilient Coconut Industry by Dr. Jelfina...
 

Population Indicators Handout

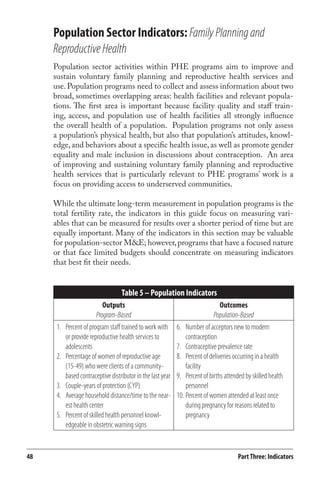
  • 1. Population Sector Indicators: Family Planning and Reproductive Health Population sector activities within PHE programs aim to improve and sustain voluntary family planning and reproductive health services and use. Population programs need to collect and assess information about two broad, sometimes overlapping areas: health facilities and relevant popula-tions. The first area is important because facility quality and staff train-ing, access, and population use of health facilities all strongly influence the overall health of a population. Population programs not only assess a population’s physical health, but also that population’s attitudes, knowl-edge, and behaviors about a specific health issue, as well as promote gender equality and male inclusion in discussions about contraception. An area of improving and sustaining voluntary family planning and reproductive health services that is particularly relevant to PHE programs’ work is a focus on providing access to underserved communities. While the ultimate long-term measurement in population programs is the total fertility rate, the indicators in this guide focus on measuring vari-ables that can be measured for results over a shorter period of time but are equally important. Many of the indicators in this section may be valuable for population-sector M&E; however, programs that have a focused nature or that face limited budgets should concentrate on measuring indicators that best fit their needs. Table 5 – Population Indicators Outputs Program-Based Outcomes Population-Based Percent of program staff trained to work with or provide reproductive health services to adolescents Percentage of women of reproductive age (15-49) who were clients of a community-based contraceptive distributor in the last year Couple-years of protection (CYP) Average household distance/time to the near-est health center Percent of skilled health personnel knowl-edgeable in obstetric warning signs 1. 2. 3. 4. 5. Number of acceptors new to modern contraception Contraceptive prevalence rate Percent of deliveries occurring in a health facility Percent of births attended by skilled health personnel Percent of women attended at least once during pregnancy for reasons related to pregnancy 6. 7. 8. 9. 10. 48 Part Three: Indicators
  • 2. 1 Percent of program staff trained to work with or provide reproductive health services to adolescents Calculation # of program staff trained to work with or provide reproductive health services to adolescents during the reference period total # of health service providers in the target area during the reference period x 100 A Guide for Monitoring and Evaluating Population-Health-Environment Programs 49 Population Level of Measurement: Output. Definition: Staff members are considered “youth-friendly” if they have the ability to provide services and an environment that targets young audiences. Youth-friendly training generally includes learning how to create a service environment that will attract and retain a youth clientele. This includes space or rooms dedicated to adolescent reproductive health services; staff who are competent in policies and procedures to ensure privacy and confidentiality; peer educators who stay on-site during hours speci-fied for provision of services to youth, and use of non-judgmental approaches to providing services to youth and accept drop-in clients. A staff member would need to go through specific training for work-ing with youth to be counted in this indicator. The denominator should include all staff who work in the target area during the reference period (semi-annually or annually), even staff who work part-time. Disaggregate: None. Purpose: Reproductive health services have traditionally been designed for older, married women. Increasing the number of health providers trained to work with youth may increase the chance that youth will take advantage of the basic reproductive health services they need. Data Sources: Project records. Time frame: Semi-annually; annually. Data Collection Considerations: Specific topics related to adolescent reproductive health, such as sexual health education and peer dynamics, should be covered in the training. Use of a pre-and post-test will assist in determining the staff’s level of understanding. Strengths & Limitations: This indicator targets the service improvement for an audience that has a strong, often unmet need for reproductive health services. However, training does not indicate whether or not providers give adequate care.
  • 3. 50 Population 2 percent of women of reproductive age (15-49) who were clients of a community-based contraceptive distributor in the last year Level of Measurement: Output. Definition: This indicator measures how well community-based distribution of contraception provides coverage of family planning services to an area. In the context of PHE programs, community-based dis-tribution means that the contraceptives are sold at a point that is not a traditional health facility, such as a clinic or hospital. Community-based distribution is generally through a local store or commercial site or an individual at a non-commercial site, as well as other variations that are community-based. As measured in this indicator, a client is a woman who receives contraception from the community-based distributor (CBD), but does not include a woman who only talks with the CBD about contraceptive methods. The method of contraception here can include any method – modern or traditional. total # of women clients age 15-49 of community-based distributors in the target area in the last year total # of women age 15-49 living in the target area in the last year Disaggregate: By target community. Purpose: The aims of the CBD program are to increase contraceptive use by increasing access and rais-ing demand through information, education, and communication (EIC) activities. For PHE programs, community volunteers are usually recruited to be community-based distributors, making CBD pro-grams especially effective in rural and isolated communities where demand is limited and access to alternative methods is low. Data Sources: Population-based survey or project records. Time frame: Annually for project records and every three to five years for surveys. Data Collection Considerations: The questionnaire for surveying women in the target area should include the type of commodities/methods received in the previous time period year. Strengths & Limitations: CBDs tend to be low-volume independent distributors in isolated and sometimes difficult-to-reach areas, creating the need for field-workers to re-supply these posts fre-quently and provide supervision and continuous training in contraceptive methods use and risks. Part Three: Indicators Calculation x 100
  • 4. 3 Couple-years of protection A Guide for Monitoring and Evaluating Population-Health-Environment Programs 51 Population Level of Measurement: Output. Definition: Couple-years of protection (CYP) is the estimated protection provided by family planning services during a one-year period based upon the volume of all contraceptives sold or distributed to clients during that period. Table 6: How to Calculate CYP Calculation: Multiply the quantity of each method distributed to clients by the conversion factor below to obtain a CYP per method. Then sum each CYP to obtain a total CYP figure. Method Units per CYP Conversion Factor Oral contraceptives 15 cycles per CYP ¹/₁₅ Condoms 120 units per CYP ¹/₁₂₀ Female condoms 120 units per CYP ¹/₁₂₀ Vaginal foaming tablets 120 units per CYP ¹/₁₂₀ Depo Provera injectable 4 doses per CYP ¹/₄ Noristerat Injectable 6 doses per CYP ¹/₆ Cyclofem monthly injectable 13 doses per CYP ¹/₁₃ Emergency contraceptive pills 20 doses per CYP ¹/₂₀ Copper-T380-A IUD 3.5 CYP per IUD inserted 3.5 Norplant implant 3.5 CYP per Implant 3.5 Implanon implant 2 CYP per Implant 2 Jadelle implant 3.5 CYP per Implant 3.5 Natural family planning 2 CYP per trained, confirmed 2 (i.e. standard days method) adopter Lactational amenorrhea method (LAM) 4 active users per CYP (or 0.25 CYP per user) 0.25 Sterilization (male & female) Asia Latin America Africa Near East/North Africa 10 CYP 10 CYP 8 CYP 8 CYP 10 10 8 6
  • 5. 52 Population Example: A facility that distributed the following family planning services Method Quantity Conversion Factor CYP Oral contraceptives 4,321 ¹/₁₅ 288.1 Condoms 9,900 ¹/₁₂₀ 82.5 IUDs 80 3.5 280.0 Total 650.6 Disaggregate: By method. Purpose: CYP is a simple, inexpensive way to measure program activity volume using routinely col-lected data. CYP can monitor progress of contraceptive service delivery at the program and project levels. Data Sources: Service statistics. Time frame: Annually. Data Collection Considerations: Standardized forms, facility “log books” and commodities tracking are necessary for this indicator calculation. Regarding the calculation of long-term methods, most programs credit the entire amount to the calendar year in which the client accepted the method. For example, if a family planning program in Asia performed 100 voluntary sterilization procedures in a given year, it would credit all 1000 CYP (100 procedures x 10 years each) to that calendar year, even though the protection from those programs would in fact be realized over that year and the next nine years. Strengths & Limitations: CYP can be obtained from different service delivery mechanisms. However, the value of this indicator can be difficult to understand. CYP data do not provide individual contraceptive use rates. The validity of the conversion factors is still debated and the number of people represented is not evident in this calculation. Part Three: Indicators
  • 6. 4 aVERAGE HOUSEHOLD DISTANCE/TIME TO THE NEAREST HEALTH CENTER A Guide for Monitoring and Evaluating Population-Health-Environment Programs 53 Population Level of Measurement: Output. Definition: This is the average time or distance from a respondent’s place of residence to the nearest service delivery site offering the measured service. The services included in this measurement should be determined in advance by the project, depending on the project’s objectives. Disaggregate: By services offered (if desired). Purpose: Distance to a health facility is often a major factor determining whether or not people truly have access to that facility, especially when transport is not easily available. Data Sources: GPS or mapping the routes can calculate the distance between health centers and communities. A less reliable option is using a population-based survey where household members are asked their distance or time it takes them to reach the nearest health center that provides the measured service. Time frame: Every one to two years. Data Collection Considerations: This indicator is useful for demonstrating the effects of pro-viding health services in remote, underserved areas. These areas may contain relatively few people, but the impact of providing services there may be great because there were no or few pre-existing services. In these instances, the PHE project should compare the distance or traveling time it previously took the target population to get to outside health centers with the calculation of the distance or average time it takes the target population to get to the newly established health center. Strengths & Limitations: Community members may visit distant health facilities in order to maintain confidentiality. The expense and effort required to obtain this indicator may mean it can only be collected every few years.
  • 7. 6 number of acceptors new to modern contraception A Guide for Monitoring and Evaluating Population-Health-Environment Programs 55 Population Level of Measurement: Outcome. Definition: For this indicator, an acceptor is a person using any modern contraceptive method for the first time in his or her life within the last year. Modern contraceptive methods include IUDs, the pill, implants, injections, condoms, spermicides, diaphragms, tubal ligation, and vasectomy. Disaggregate: By method (if desired). Purpose: This indicator measures a program’s ability to attract new clients from an untapped segment of the population. Data Sources: Usually service statistics; occasionally from population-based surveys. Time frame: Annually using service statistics; every two to five years using a population-based survey. Data Collection Considerations: Program personnel can disaggregate service statistics by key variables (age, sex, place of residence, or other factors deemed relevant in the country of context). Strengths & Limitations: Defining this indicator in terms of first-time use in the life of an indi-vidual removes the ambiguity associated with the more general term “new acceptor” that can include individuals who are new to a clinic or a method but not to modern contraceptive use. However, this indicator measures absolute numbers, not the proportion of the population. It does not measure how long contraceptive use continues or if methods are used properly.
  • 8. 56 Population Level of Measurement: Outcome. Definition: Contraceptive prevalence rate (CPR) is defined as the percent of reproductive-age women (ages 15-49 years) who are using a contraceptive method at a particular point in time. This is almost always reported for women married or in a sexual union. Generally, this includes all contraceptive methods, modern and traditional, but it may include modern methods only. The program manager should decide in advance whether any method or just modern methods will be included in calculating this indicator. The World Health Organization (WHO) defines modern contraceptive methods as fe-male and male sterilization, injectable and oral hormones, intrauterine devices, diaphragms, hormonal implants, spermicides, and condoms. Traditional methods include the calendar method (or rhythm), withdrawal, abstinence, and lactational amenorrhea (LAM). Part Three: Indicators 7 contraceptive prevalence rate # of partnered women (married or in union) of reproductive age using a contraceptive method total # of partnered women (married or in union) of reproductive age Disaggregate: By modern and traditional methods. Purpose: CPR measures population coverage of contraceptive use, taking all sources of supply and con-traceptive methods into account. Data Sources: Population-based surveys. Time frame: Every two to five years. Data Collection Considerations: In countries with a widespread practice of sexual activity outside marriage or stable sexual unions, a prevalence estimate based on women in unions only would ignore a considerable number of current users of contraception. Strengths & Limitations: This indicator is widely used. To calculate a true contraceptive rate, the denominator should include only women at risk of pregnancy, which is difficult to measure. This in-dicator does not measure how long women have been using contraceptives or if they are using them correctly. Calculation x 100
  • 9. Health Indicators: Child Survival and Environmental Health Child survival and environmental health activities work toward reducing child morbidity, mortality, and disease incidence. Child health and survival has been a focus for many large-scale international programs, including the Millennium Development Goals, the Integrated Management of Child-hood Illness strategy, the Global Alliance for Vaccines and Immunization, and the Roll Back Malaria initiative. Many communities served by PHE projects have identified child health and survival as a priority. The indicators in this section have been chosen to measure indicators at the input, process, output, and short- to medium-term outcome levels rather than the long-term outcomes of disease in-cidence and infant and child mortality. Together, these indicators cover a broad range of environmental and child health activities. Most PHE programs work on achieving the shorter-term outcomes in a smaller com-munity and contribute to a larger effort in the area to improve child health. Depending on their focus and resources, PHE programs can choose the indicators most appropriate for their own work. Table 7 – Health Indicators Outputs Outcomes Number of doses of tetanus vaccine distributed Number of insecti-cide- treated bed nets distributed Number of packets of oral rehydration salts distributed Number of safe water stor-age vessels distributed 1. 2. 3. 4. Percent of pregnant women receiving at least two doses of tetanus toxoid vaccine Percent of children aged 12- 23 months fully immunized before 12 months Percent of households with access to an improved source of drinking water Time spent by household members to collect water 5. 6. 7. 8. Percent of households using an improved toilet facility Percent of households using soap in last 24 hours Percent of households stor-ing drinking water safely Percent of children under five years who slept under an insecticide-treated bed net the previous night Oral rehydration therapy use rate 9. 10. 11. 12. 13. 60 Part Three: Indicators
  • 10. 72 Health 9 percent of households using an improved toilet facility Level of Measurement: Outcome. Definition: An “improved” toilet facility means a flush/pour-flush toilet connected to a piped sewer system, septic tank, or pit; a ventilated-improved-pit latrine; simple pit latrine with slab that can be cleaned; or a composting toilet. An “unimproved” toilet facility includes flush/pour-flush toilets that empty elsewhere without connection to piped sewage systems, septic tanks, pits, or have unknown drainage; pit latrines without slabs or open pits; bucket latrines (where excreta are manually removed); hanging toilets/latrines; open defecation in field or bush or into plastic bags (flying toilets); and any other type of defecation. # of households that have working improved toilet facilities within their compounds total # of surveyed households Disaggregate: None. Purpose: Access to a functioning and improved toilet facility is essential for improving a household’s hygienic situation. This indicator measures access to such facilities. Data Sources: Population-based surveys. Time frame: Every two to five years. Data Collection Considerations: Household heads or caretakers should be interviewed about the type of toilet facility they use; afterwards interviewers should observe the facility to see if it is ac-cessible. Strengths & Limitations: This indicator does not measure whether toilet facilities are used or whether they are hygienic. Part Three: Indicators Calculation x 100
  • 11. 10 percent of households using soap in last 24 hours Calculation # of households reporting washing hands with soap before cooking/eating and after defecation over the past 24 hours total # of households surveyed x 100 A Guide for Monitoring and Evaluating Population-Health-Environment Programs 73 Health Level of Measurement: Outcome. Definition: This indicator measures the percent of households where soap is used on a regular basis. Use of soap at the most critical times (after defecation and before cooking or eating) for hand washing can decrease the risk of diarrheal disease. Although ash, sand, and mud are mentioned in the literature as local alternatives, neither their acceptability as a cleansing agent nor their actual use on a significant scale has been established. The use of soap for washing hands is commonly promoted through public-private partnerships. Disaggregate: None. Purpose: Washing hands with soap is essential to controlling diarrheal diseases. This indicator rep-resents actual behavior, not knowledge. Washing hands with soap at two critical times is suggested as a minimum but programs may choose to set higher targets if more frequent hand washing seems achievable. Data Sources: Population-based surveys. Time frame: Every two to five years. Data Collection Considerations: Alternatively, the interviewer can observe hand-washing facilities and techniques but this would not measure soap use, only the availability of hand-washing supplies. The household respondent (often the caregiver of the youngest child) is asked about their use of soap in the last 24 hours to reduce recall bias. It is important to also ask whether the household has soap. Strengths & Limitations: This indicator is easily collected, and observation allows for a reliable assessment of available conditions. However, this indicator does not necessarily measure proper water storage, hand washing techniques, or how often hands are washed on a regular basis.
  • 12. Environment Indicators: Natural Resource Management, Species Preservation, Income-Generation Activities The environment indicators in this section focus both on system health (“species abundance and distribution”) and measuring healthy, sustain-able interactions between communities and their environments (“area un-der improved management”). While this section includes environmental outcomes, it also includes indicators that measure inputs, processes, and outputs. Environment indicator topics include habitat status, improved practices/management, natural resource management committees, and enforcement of environment protection laws. The environment indicators best suited for individual PHE or environment programs will depend on program goals and resources. Environment-related work in PHE programs naturally complements ef-forts to improve governance by building capacity of local government bod-ies, and even communities, to manage shared resources in a sustainable manner for current and future revenue generation or livelihood purposes. More than half of the environment indicators in this guidebook are value-added in the governance, livelihoods, and/or underserved populations sec-tors. Five indicators in this section are value-added for more than one area. This reflects the multi-sectoral approach of environment-related activities in PHE programs. Table 10 – Environmental Indicators Process/Outputs Outcomes Percent of communities in target area that have developed a community-based natural resource management plan Number of officers trained in laws and enforcement procedures and posted to a permanent enforcement position Hours of enforcement patrols logged Area of legally protected habitat Number of trees planted Percent of trees planted that survive Number of educational sessions on improved agricultural/marine practices 1. 2. 3. 4. 5. 6. 7. Percent of community-based natural resource management plans that are approved by a government authority Percent of farmers/fishers who adopt improved agricultural/marine practices Area of habitat under improved management Area of secondary forest regenerated Population structure of species Species richness Species abundance and distribution 8. 9. 10. 11. 12. 13. 14. 78 Part Three: Indicators
  • 13. 92 Environment 8 Percent of community-based natural resource management plans that are approved by a government authority Level of Measurement: Outcome. Definition: NRM is the management of all activities that use, develop, and/or conserve air, water, land, plants, animals, and ecosystems. NRM committees are organized groups of people who meet regularly and attempt to practice natural resource management. A “government authority” is a person who works for the government and has the power to make legal decisions. “Approved” means the plan has been officially adopted as having the effect of law — it is enforceable. Calculation Disaggregate: None. Purpose: Community control at the local level can result in more sustainable environmental manage-ment where locals are likely to benefit from their choice of land or natural resource use. Often natural resources are owned and/or controlled by the state or commercial interests, even when local or indig-enous people have occupied a territory for many years or generations. When local communities have the legal right to manage local resources, they begin to value resources leading to ongoing conservation. Data Sources: Secondary records. Time frame: Annually. Data Collection Considerations: Examining secondary records such as legal documents may be sensitive in some countries. The project should work with the locally-based NRM committee and government authorities to receive documentation for this indicator. Strengths & Limitations: Measurements should be relatively easy and straight-forward to obtain since the indicator is unambiguous and has been legally defined. However, changing laws and policies can be a slow process that may occur over the course of several years, requiring ongoing monitoring. Although a community-based NRM plan may not have been approved by a government authority, it may still be in the process of being implemented by the community. This indicator does not reflect whether there is improved management on a local level. Part Three: Indicators # of government-approved community-based NRM plans # of community-based NRM plans finished and submitted to a government authority for approval x 100
  • 14. Integration Indicators: Partnerships and Communication Recent assessments of integrated PHE programs in the Philippines have found that integrated programs have several advantages over stand-alone population, child health, or environment programs. The assessments found that integrated programs were cost-effective compared to the cost of sin-gle- sector population, child health and safety, or environment programs. Integrated programs also recruited a greater number of men to family planning efforts and a greater number of women and adolescents to en-vironment/ conservation efforts. Integrated programs also improved the perceived value of family planning efforts by packaging them with health interventions. One of the main long-term goals of integrated PHE programs is to ensure local ownership and sustainability. Therefore, the outcome indicator “num-ber of enabling local ordinances/policies/strategies/doctrines supporting PHE” is included in this section. Short-term outcome indicators in this section measure local PHE awareness (“number of policy-makers, media, and scholars knowledgeable about or aware of a specific PHE issue”), or the diversification of PHE efforts. Process indicators in this section measure linkages between materials (“number of linked messages/materials created”) and partnerships that in-crease integration (“number of new PHE partnerships created that make linkages among organizations or institutions from different sectors”). Out-put indicators in this section measure PHE promotion/education efforts (“number and frequency of PHE educational sessions provided in the tar-get community”). While any of the indicators in this section may be valuable for the M&E of integrated programs, programs that have a focused nature or that face limited budgets may concentrate on measuring a few indicators that best fit their needs. 104 Part Three: Indicators
  • 15. 6 Number of policy-makers, media, and scholars knowledgeable about or aware of a specific PHE issue A Guide for Monitoring and Evaluating Population-Health-Environment Programs 111 Integration Level of Measurement: Outcome. Definition: This is a number count of policy-makers, media members, and scholars knowledgeable about or aware of a specific PHE issue. The issue should be chosen by the project in advance and at the beginning of project implementation for tracking over the life of the project. This issue should be very specifically defined to avoid error in counting whether an influential person has knowledge or awareness. Choosing a broad and over-arching topic (i.e., the connection between family planning and environment) is not useful in counting this indicator. Similarly, policy-makers, media, and scholars should not already be involved with or active in the PHE issue selected by the project. They should normally be those who are targeted and monitored by the project on the specific issue selected. Disaggregate: By issue. Purpose: Persons of interest knowledgeable about the PHE issue is an indication that the program/ project’s messages reached those in power or those who are in a position of educating/impacting the public. Data Sources: Secondary sources, key informant interviews. Time frame: Semi-annually, annually. Data Collection Considerations: Complications in collecting this indicator with accuracy arise with the definition of knowledge or awareness. Knowledge and awareness are difficult to measure objectively without the ability to perform pre and post tests for the persons of influence. Using key informant interviews where targeted policy-makers, media members and scholars are interviewed about their knowledge or awareness of a PHE issue can assist in confirming information for this indica-tor. When possible, using an interview as a baseline and then repeating the interview at a scheduled interval can provide information over time about increased knowledge or committment to as specific PHE issue. Strengths & Limitations: This indicator does not give information on whether the policy-makers, media, or scholars are supportive of the specific PHE issue. It also does not measure the influential person’s level of knowledge or depth of awareness of the issue.
  • 16. 112 Integration 7 Percent of households knowledgeable about or aware of a Level of Measurement: Outcome. Definition: This is a percentage of the households in the project’s target area whose residents are knowledgeable about or aware of a specific PHE issue. The issue should be chosen by the project at the beginning of project implementation for tracking over the life of the project. This issue should be very specifically defined to avoid error in counting whether the person responding for the household has knowledge or awareness. Choosing a broad and over-arching topic (i.e., the connection between family planning and environment) is not useful in counting this indicator. The households included should normally be those who are targeted and monitored by the project on the specific issue selected for this indicator to be useful in determining whether the household gained the knowledge as a result of the PHE project. Calculation # of households surveyed that are knowledgeable about a specific PHE issue total # surveyed households x 100 Part Three: Indicators specific PHE issue Disaggregate: PHE issue covered in survey. Purpose: Household knowledge of a specific PHE issue may be an indication of the project’s success in communicating the PHE issue or in the increasing awareness of the community to the integration between human health and the natural environment. Data Source: Population-based survey. Time frame: Every two to five years. Data Collection Considerations: The specific PHE issues should be determined in advance, re-main consistent, and be monitored over time. When collecting information at the household level in a population-based survey, special attention should be made not to bias results by suggesting answers. Strengths & Limitations: This indicator only measures knowledge and does not indicate behavior change or where the knowledge was acquired. The questions utilized to measure knowledge must be carefully worded and pretested to ensure accurate measurement.