
Recommended
More Related Content
What's hot
What's hot (20)
Similar to Gk 12 eval report 2011
Similar to Gk 12 eval report 2011 (20)
More from Louise Smyth
More from Louise Smyth (12)
Recently uploaded
Recently uploaded (20)
Gk 12 eval report 2011
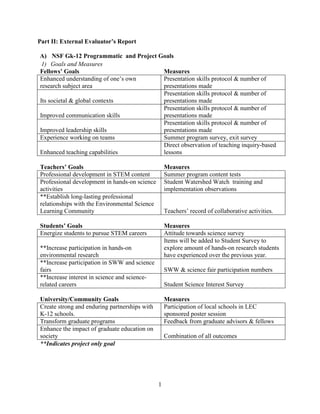
- 1. 1 Part II: External Evaluator’s Report A) NSF Gk-12 Programmatic and Project Goals 1) Goals and Measures Fellows’ Goals Measures Enhanced understanding of one’s own research subject area Presentation skills protocol & number of presentations made Its societal & global contexts Presentation skills protocol & number of presentations made Improved communication skills Presentation skills protocol & number of presentations made Improved leadership skills Presentation skills protocol & number of presentations made Experience working on teams Summer program survey, exit survey Enhanced teaching capabilities Direct observation of teaching inquiry-based lessons Teachers’ Goals Measures Professional development in STEM content Summer program content tests Professional development in hands-on science activities Student Watershed Watch training and implementation observations **Establish long-lasting professional relationships with the Environmental Science Learning Community Teachers’ record of collaborative activities. Students’ Goals Measures Energize students to pursue STEM careers Attitude towards science survey **Increase participation in hands-on environmental research Items will be added to Student Survey to explore amount of hands-on research students have experienced over the previous year. **Increase participation in SWW and science fairs SWW & science fair participation numbers **Increase interest in science and science- related careers Student Science Interest Survey University/Community Goals Measures Create strong and enduring partnerships with K-12 schools. Participation of local schools in LEC sponsored poster session Transform graduate programs Feedback from graduate advisors & fellows Enhance the impact of graduate education on society Combination of all outcomes **Indicates project only goal
- 2. 2 2) Explanation of Measures and Instruments We continued to utilize a quasi-experimental design to measure project impact. As in previous years, the teachers’ science classes that interacted with a fellow were carefully matched with a control teacher and classroom using teacher, student, and content demographics. Pretests were compared to verify group equivalencies. An in-depth case study design was used to examine fellow outcomes. Data gathering from graduate student faculty advisors also utilized a quasi- experimental design with all faculty members from the departments participating in the project (Environmental Science and Engineering) providing data. Nonparticipating faculty members from the same departments served as the control group. Fellow data was gathered using three instruments. First a performance assessment based upon research on effective science explanations (Sevian and Gonsalves, 2008) was used for direct observations of the fellows as they presented their research to a variety of audiences (mostly high school students) throughout the year. The rubric was used last year as well when inter-rater reliability was established. The rubric includes assessment for the following categories: Organization, delivery, relevance to the audience, appropriate language, use of audio-visual aids, and fielding of questions. The rubric is divided into three basic levels of measurement— proficient, developing, and needs attention—with subcategories within each to allow for degrees of achievement. Fellows graduating from the program provided reflections of their experiences. Themes and language in the reflections were compared with entry level data to determine impact of project participation on the fellows over time. Finally, fellow content gain was measured during the summer program using a pretest/posttest of relevant content knowledge. Teacher gains were also measured using the content test developed by the faculty teaching in the summer institute. Evidence of content validity was provided by the project environmental science faculty and the test was examined by the external evaluator prior to administration to assure sound assessment techniques were followed and tests included higher order learning items. To validate improved networking and awareness of community science resources, teachers provided a list of collaborations in which they have engaged over the past year with regard to science teaching and resources. This year we also added the Science Teacher Ideological Preference Scale (Gado, 2005). This instrument has two subscales that measure a teacher’s preference for teaching inquiry-based lessons as well as their preference for more traditional teaching strategies (e.g., lecture, worksheets). Examination of the ratio between preference totals provides a means of determining teacher orientation towards inquiry versus non-inquiry teaching strategies. Because this is the first year, the data will be used as baseline for comparison next year. Project effects on students were examined through a project developed Student Science Interest Survey based upon an adaptation of the “Conceptions/Nature of Science” survey used by the NSF DUE project, Creation of an Interdisciplinary Earth Materials Testing Laboratory to Enhance Undergraduate Science Education, University of Wisconsin - Stevens Point. Last year’s analysis of this survey suggested that the “nature of science” portion did not differentiate between treatment and control groups and analysis of that portion of the survey indicated that it contained little evidence of validity. Further investigation revealed that nature of science is part of the Ohio Content Standards for secondary school students. Teachers felt that understanding of the nature of science is covered in detail in most science classes. Our revised version of this
- 3. 3 survey (used this year) included only the 24 items that examined student attitudes about and interest in science. Science interest reliability was 0.88. This survey was administered to over 500 students for both the pretest and the post test. The post test will not be administered until late April and results will be included until next year’s report. Additional items on the survey explored student education and career goals/plans as well as engagement in extra-curricular science activities. We added a Student Watershed Watch survey this year to determine whether participating in this activity improved student understanding of the Lake Erie Watershed and as a more reliable way to measure impact of this project on student learning (as opposed to State standardized tests). Pretests were given in tandem with the attitude/interest survey and posttests were administered in December after the program’s conclusion. Items on this survey were developed by the fellows. Administration of the survey also followed the treatment/control design. Rasch analysis was used to examine the items as well as to convert the ordinal data to interval data so that a comparison between means could be examined. Impact on university faculty was explored using a project-developed survey that explored each faculty member’s interest in working with K-12 education. It also asked how active their graduate students are in this activity and provided several typical graduate student duties or responsibilities. Graduate advisors were asked to delineate the amount of time each of their advisees spent per academic year on the duties. It also asked them to provide, for comparison, their own ideal delineation of time spent on these duties. Feedback gathered from the fellows was used to verify faculty responses. B) Executive Summary of Findings 1) Fellows: Fellows made 65 research presentations and published five scholarly articles during the past year. In addition, fellows presented their research to local high school science classes. These presentations were observed to assess fellow presentation skills when working with the general public. The fellows for the most part were proficient in their organization of the presentations. Every presentation fit into the allotted timeframe and the purpose was clear. Some fellows were nervous in their delivery but not beyond what might be expected since several were new to the program this year. There were only a small number of fellows whose presentation was affected by this. The most difficulty fellows experienced was in making their research relevant to their audience. In a few cases, some of the fellows simply taught a class as opposed to sharing their research. Perhaps these fellows misunderstood the purpose of sharing their research and perhaps in the future examples should be provided for fellows prior to delivering their presentations. The fellows that did share their research were engaging, well-spoken, and well-received. Nearly all of the fellows used language that the audience could understand. The few that did have trouble communicating with their audience seemed to lose sight of the fact that their research was new information to many students and perhaps did not realize that using scientific/math jargon can hinder learning and the connection to the audience. All of the audiovisuals were done very well, were easy to understand, and were attractive. A small number
- 4. 4 of fellows read from their PowerPoint too much but for the most part everyone just used it as an aid to illustrate or enhance their presentation. All of the fellows provided time for questions during or at the end of their presentation. When they were approached with a question they were respectful to the students and answered the best they could. Overall the fellows did well, scoring in the proficient category. The only recommendation for improvement is to ensure that fellows do not confuse the purpose of these observations (to share research rather than to teach new concepts). Even though the fellows themselves did not feel the summer program provided them with new content information, they did indeed gain in content knowledge. Fellow content knowledge in water quality was measured at the conclusion of the summer coursework. Fellows showed statistically significant gains. Mean correct percentages rose from 64% to 91.4% with a large effect size realized (d = 0.91). In addition, a paired sample one tail t-test resulted in statistical significance with α = 0.004 (t = 1.83; df = 9—includes 2 teachers). This gain is also practically significant in that small samples often do not show gains when they actually occur due to a large standard error. Feedback from the summer program (both from fellows and teachers) continued to reflect a positive learning experience. All participants felt the water quality course to be challenging yet manageable and field experiences provided the opportunity to learn as well as provided resources that could be implemented in the high school science classroom. Teachers found the data collection activities to be especially valuable and fellows appreciated the opportunity to work in teams not only with GK-12 teachers but also with teachers participating in a US Department of Education Teachers for a Competitive Tomorrow project (IMPACT). Both felt the use of past fellow participants in the summer to be advantageous. When asked for suggestions for improvement, fellows indicated that those without a background in water quality could have used the support of a text book and teachers wanted more obvious ties to their own teaching. All of the teachers provided specific examples, however, of information learned during the summer that would be utilized in their classrooms. A few comments indicated that including the IMPACT teachers posed some logistic problems and that one faculty member was consumed with this coordination of teachers from the two programs. Four fellows will be leaving the project and have completed an exit survey this year. Fellow plans include obtaining a post doc position at a university, working for a government agency or working for the research wing of the private sector. When asked if participation in the GK-12 program influenced their long term goals or plans, one indicated a new interest in training and another considered teaching short term but long term plans were not affected. One fellow indicated that participation in the program has changed his/her attitude about working in teams: “The GK12 program has allowed me to feel more comfortable working in a team and has showed me that more can be accomplished when working as a group.” All agreed that the GK-12 experience has made them more adept at sharing their research with the general public in terms that their audience can understand and they have learned to connect their research with topics relevant to the audience. When presenting to a general audience, the fellows noted that they focus more on the big picture rather than the details of the research and use “funny cartoons and videos” to engage the audience. One fellow noted value in communicating with the general public: scientists are “always trying to connect their research to broader impacts” and therefore
- 5. 5 they “should try to communicate their work to broader audiences in order to organize their own research toward broader impacts and greater applications.” All of the graduating fellows also suggested that the typical undergraduate science classroom could be more effective if instructors included more inquiry-based lessons rather than relying heavily on lectures. Their experience in the high school science classroom allowed them make observations as to high school science experience. In general, they felt the classes did not have enough inquiry-based instruction that allowed the students themselves to solve problems and they felt the state mandated standardized testing inhibited teachers’ opportunities to be creative. When reflecting upon the high school student, they felt that engaging the students in meaningful science problem solving was a more effective method for content retention and that the high school students are capable of understanding complex concepts and content does not need to be “dumbed down” for them. One fellow summarized the experience thusly: “This has been a wonderfully rewarding experience - through collaboration of many disciplines, development of communication skills through presentations, conference, and in classroom skills development. My confidence and communication skills have improved greatly, I now have a broader understanding of water quality and environmental concerns, and am now pursuing a career where I will be training or teaching in some fashion.” This statement reflects the profound impact the GK-12 experience has had on its fellows. 3) Teachers: Because the summer content was a repeat of Year 1, only new teachers attended (2). Both teachers showed gains in content: 72% to 90% and 84% to 100%. Because the sample was small, a statistical analysis was inappropriate; however, the teacher scores were included in the fellow analysis discussed earlier as were teacher comments on the summer program. Teachers also completed the Science Teacher Ideological Preference Scale. Five of the eight teachers completed the scale. Results show that teachers’ preference leans decidedly towards inquiry based instructional strategies: Inquiry Non-Inquiry Ratio Inquiry to Non-Inquiry 42 29 1.45:1 34 26 1.31:1 32 19 1.68:1 35 26 1.35:1 36 26 1.38:1 Because this data was not collected at the onset of the project, assumptions as to the effect of participation in the project on teacher preferences cannot be made. However, results do validate that the teachers selected to mentor and work with the fellows were well-chosen. Teacher science resource networking data was collected April 2011 to determine the extent to which the GK-12 project has expanded teachers’ connections with new resources for the classroom. All of the teachers worked with their graduate fellow weekly or daily. In contrast, only two of the eight teachers have similar contact with graduate students from the College of Education. Additionally, the majority of teachers are in contact with University scientists and engineers at least once a month. Contact with local informal science and professional scientists is not as frequent with three having no contact with informal science institutions (such as science museums), the majority interacting with informal resources two to three times a year, and the
- 6. 6 majority interacting with local scientists at least four times per year. Most of the teachers reported infrequent attendance to regional or national science or science education conferences but all use the internet to gather resources and ideas for their classrooms. 3) Students: Because of the timing of the annual report, data not reported last year will be presented first. The posttest for the 2009-2010 Student Attitudes about Science survey was administered May 2010. The sample included 182 students from GK-12 classrooms and 332 students from control group classrooms. Statistical comparisons of the pretest administered in fall 2009 showed the groups to be equivalent. The post test showed no differences between the groups with both groups scoring right around the expected mean of 44 out of a possible high score of 88 (treatment mean = 46.26; control mean = 46.20). The higher the score, the more the students’ responses tended to agree with positive attitudes about science. Last year some misconceptions were revealed and since then the teachers and fellows have worked to address these misconceptions. Pretest results showed that students needed a deeper understanding of the following: 1. Scientists have to study too much. (most agreed) 2. I would like to work with other scientists to solve scientific problems. (disagreed) 3. Scientists do not have enough time for their families or for fun. (agreed) 4. I want to be a scientist. (disagreed) 5. I have to work hard to understand scientific concepts. (agreed) Posttest responses continued to disagree with the idea of working with scientists to solve scientific problems as well as the desire to become a scientist. Responses on the remaining items showed positive trends. Students continued to show interest in science activities through participation in science fairs. Thirty students participated in the Ohio science fair this past year (an increase over the 23 who participated last year). Six students working with GK-12 fellows earned “Superior”; 17 students earned an “Excellent” rating and the remaining 7 earned “Good” ratings. In addition to these ratings, 9 students received the following awards: Ohio Academy of Science Outstanding Investigative Science Award Outstanding Chemistry Award (2) Amateur Radio Operator's Award ACS Award (2) Science or Food, Nutrition, and Health Award Outstanding Investigative Science Award (2) Student Watershed Watch Survey 2010-2011 This survey was designed to determine whether student knowledge about their local watershed improves as a result of participating in the Student Watershed Watch. A pretest and posttest was administered to students who participated in the program (treatment) and those who did not (control). The control groups were selected by the GK-12 teachers who attempted to match student demographics.
- 7. 7 Pretest Reliability of the test was moderate (0.61) and the test did not measure one construct (there is a large percentage of unexplained variance—over 70%). This means that we may not be measuring student knowledge of the local watershed with this test. Using Rasch analysis, raw ordinal scores were converted to an interval scale that matched the original scoring (possible high score of 80 with 40 as the expected mean). Lower scores indicated more knowledge of the watershed. Results of an F test showed variances to be unequal. A t-test for unequal variances was conducted and the result showed that the groups were not equivalent on this survey. The control group actually scored statistically significantly higher than the treatment group on the pretest. Teacher matching did not prove to be an effective means of gathering an equivalent control group and it is recommended that if a control group be included in the future, more rigorous methods are used or demographic variables be collected to identify causes for non-equivalency. Posttest As with the pretest, the control group scored statistically significantly higher. To determine whether the groups showed differences in gains, effect sizes were compared. The effect size (Cohen’s d) is calculated by subtracting the mean of the pretest from the mean of the posttest and dividing by the standard deviation of the pretest. The results are in terms of standard deviation units. As can be seen below, the treatment group gained 2/3 of a standard deviation and the control group gained about half of a standard deviation. In this comparison, the treatment group actually gained more than the control taking into account differences in groups. Treatment effect size = 0.66 Control effect size = 0.49 The actual mean scores for the two groups were below the expected mean of 40 (treatment = 38.36; control = 38.69). A score lower than 40 indicated a tendency to agree with the accurate statements in the survey. However, overall their agreement was just slightly better than neutral. 4) University faculty & sustainability: Faculty participating in GK-12 as well as other faculty from the same departments completed a survey that examined amount of time their graduate assistants spent on a variety of activities. In addition, they were asked what the ideal distribution of a graduate student’s time over several related activities and responsibilities might be. Those who participated in GK-12 felt a more balanced spread of time between taking classes, conducting research, and working with K-12 education was desirable. Those who did not participate in GK-12 or in other programs that connect University faculty with K-12 educators placed more emphasis on attending classes and especially on conducting research. Results suggested that participation in GK-12 encouraged faculty to consider and value the benefits of allowing their graduate students to interact with K-12 science educators and students.
- 8. 8 C) Recommendations This project continues to improve based upon formative assessment findings and through the identification of best practices. Slight changes are recommended to ensure that data collection adequately reflects program results. First, a sample fellow presentation (some have been recorded) should be shown to the fellows over the summer or early in the fall semester so that they have a clear idea of what is expected with regard to presentations. Second, the project team should consider making explicit connections between teachers and the science community so that the teachers might improve their networking with this valuable resource. The Student Watershed Watch survey as is should not be repeated. However, it is recommended that a team of teachers, fellows, and the evaluator work together to refine the instrument as there is value in developing a reliable, valid instrument to measure the effects of the program. This instrument will not only contribute to the verification of project goal attainment but can also be used by the Student Watershed Watch program to gather data that could make a compelling case for community support. Finally, while those faculty who work on GK-12 support graduate student interaction with K-12 teachers and students, faculty who do not have this or a similar connection remain unsupportive. It is recommended that the GK-12 faculty, teachers, and fellows share their results with the University community. Sevian, H. and Gonsalves, L. (2008). Analyzing how scientists explain their research: A rubric for measuring the effectiveness of scientific explanations. International Journal of Science Education, 30 (11), 1441-1467.