

Recommended
More Related Content
Similar to NCFS - C3 T3 P1to6
More from LBG
More from LBG (20)
Recently uploaded
Recently uploaded (20)
NCFS - C3 T3 P1to6
- 1. Table 3.1 Mean, SD, median and percentile values of food group intakes (g/d) in the total population Total Population (n=594) Food group Percentiles Mean SD Median 5th 95th 1 Rice & pasta, flours, grains & starches 26 32 19 0 97 2 Savouries (e.g. pizzas) 31 37 21 0 105 3 White breads & rolls 63 37 57 11 128 4 Wholemeal & brown breads & rolls 12 24 0 0 61 5 Other breads (e.g. scones, croissants) 7 13 0 0 36 6 quot;Ready to eatquot; breakfast cereals 31 24 27 0 81 7 Other breakfast cereals (e.g. porridge) 8 29 0 0 52 8 Biscuits 15 13 12 0 41 9 Cakes, pastries and buns 11 14 6 0 39 10 Whole milk 238 188 212 0 606 11 Low fat, skimmed and fortified milks 28 90 0 0 199 12 Other milks (e.g. processed milks) 10 52 0 0 49 13 Creams 0 1 0 0 1 14 Cheeses 8 10 4 0 28 15 Yoghurts 39 43 26 0 128 16 Ice creams 14 19 9 0 50 17 Puddings & chilled desserts 9 17 0 0 47 18 Milk puddings (e.g. rice pudding & custards) 3 13 0 0 23 19 Eggs & egg dishes 8 13 0 0 36 20 Butter 2 4 0 0 10 21 Low fat spreads 2 3 0 0 10 22 Other spreading fats 6 8 3 0 19 23 Oils 0 0 0 0 0 24 Hard cooking fats 0 0 0 0 0 25 Potatoes (e.g. boiled, mashed, baked) 53 49 41 0 144 26 Processed & homemade potato products 6 15 0 0 26 27 Chipped, fried & roasted potatoes 40 32 33 0 101 28 Vegetable & pulse dishes 5 20 0 0 32 29 Peas, beans & lentils 13 18 6 0 44 30 Green vegetables 6 10 0 0 25 31 Carrots 9 13 4 0 35 32 Salad vegetables (e.g. lettuce) 3 10 0 0 24 33 Other vegetables (e.g. onions) 9 16 1 0 36 34 Tinned or jarred vegetables 1 4 0 0 6 35 Fruit juices 94 115 58 0 331 36 Bananas 16 26 0 0 74 37 Other fruits (e.g. apples, pears) 41 46 26 0 133 38 Citrus fruit 10 21 0 0 61 39 Tinned fruit 1 7 0 0 7
- 2. Table 3.1 continued Mean, SD, median and percentile values of food group intakes (g/d) in the total population Total Population (n=594) Food group Percentiles Mean SD Median 5th 95th 40 Nuts & seeds, herbs & spices 1 3 0 0 6 41 Fish & fish products 8 12 0 0 30 42 Fish dishes 1 8 0 0 0 43 Bacon & ham 7 10 4 0 27 44 Beef & veal 5 11 0 0 25 45 Lamb 2 6 0 0 14 46 Pork 3 7 0 0 19 47 Chicken, turkey & game (e.g. pheasant) 12 14 9 0 39 48 Offal & offal dishes 0 2 0 0 0 49 Beef & veal dishes 22 31 8 0 82 50 Lamb, pork & bacon dishes 3 11 0 0 28 51 Poultry & game dishes 12 24 0 0 57 52 Burgers (beef & pork) 7 13 0 0 31 53 Sausages 10 13 7 0 39 54 Meat pies & pastries 2 7 0 0 16 55 Meat products (e.g. processed meats) 19 19 15 0 55 56 Alcoholic beverages 0 0 0 0 0 57 Sugars, syrups, preserves & sweeteners 6 11 3 0 21 58 Chocolate confectionery 17 17 13 0 51 59 Non-chocolate confectionery 11 13 6 0 37 60 Savoury snacks 12 11 11 0 34 61 Soups, sauces & miscellaneous foods 29 34 18 0 100 63 Teas 31 68 0 0 175 64 Coffees 1 9 0 0 0 65 Other beverages (e.g. water) 238 208 194 0 636 66 Carbonated beverages 122 136 86 0 409 67 Diet carbonated beverages 15 44 0 0 92 68 Squashes, cordials and fruit juice drinks 72 93 48 0 219 Food group 62 = Nutritional supplements
- 3. Table 3.2 Mean, SD, median and percentile values of food group intakes (g/d) in consumers only Consumers only Food group Percentiles n % Mean SD Median 5th 95th 1 Rice & pasta, flours, grains & starches 388 65 40 32 31 9 106 2 Savouries (e.g. pizzas) 427 72 44 37 32 6 117 3 White breads & rolls 583 98 64 37 58 14 128 4 Wholemeal & brown breads & rolls 235 40 30 30 22 4 83 5 Other breads (e.g. scones, croissants) 236 40 18 15 14 4 49 6 quot;Ready to eatquot; breakfast cereals 550 93 33 23 29 5 81 7 Other breakfast cereals (e.g. porridge) 103 17 45 57 20 3 189 8 Biscuits 518 87 17 13 14 3 43 9 Cakes, pastries and buns 359 60 18 14 14 4 46 10 Whole milk 534 90 265 179 231 29 615 11 Low fat, skimmed and fortified milks 106 18 155 160 106 13 498 12 Other milks (e.g. processed milks) 74 12 84 125 48 13 410 13 Creams 34 6 4 5 3 0 17 14 Cheeses 352 59 13 10 10 2 34 15 Yoghurts 421 71 55 42 43 9 136 16 Ice creams 381 64 23 19 17 5 57 17 Puddings & chilled desserts 202 34 26 21 20 3 62 18 Milk puddings (e.g. rice pudding) 73 12 28 28 21 3 86 19 Eggs & egg dishes 251 42 18 14 15 4 47 20 Butter 164 28 6 7 4 0 20 21 Low fat spreads 147 25 6 4 5 1 16 22 Other spreading fats 396 67 9 8 7 1 21 23 Oils 24 4 1 1 1 0 3 24 Hard cooking fats 1 0 1 n/a 1 1 1 25 Potatoes (e.g. boiled, mashed, baked) 525 88 60 47 49 9 148 26 Processed & homemade potato products 165 28 20 23 14 5 53 27 Chipped, fried & roasted potatoes 531 89 45 31 37 9 102 28 Vegetable & pulse dishes 127 21 24 38 12 2 75 29 Peas, beans & lentils 360 61 21 20 15 3 60 30 Green vegetables 267 45 13 11 11 2 33 31 Carrots 354 60 16 13 12 2 41 32 Salad vegetables (e.g. lettuce) 140 24 14 16 9 2 46 33 Other vegetables (e.g. onions) 309 52 17 19 12 2 48 34 Tinned or jarred vegetables 56 9 10 11 7 1 33 35 Fruit juices 420 71 133 117 103 20 375 36 Bananas 260 44 38 27 31 6 97 37 Other fruits (e.g. apples, pears) 434 73 56 45 43 7 147 38 Citrus fruit 188 32 33 27 23 5 87 39 Tinned fruit 35 6 22 21 17 1 79
- 4. Table 3.2 continued Mean, SD, median and percentile values of food group intakes (g/d) in consumers only Consumers only Food group Percentiles n % Mean SD Median 5th 95th 40 Nuts & seeds, herbs & spices 86 14 6 6 4 0 15 41 Fish & fish products 278 47 16 12 14 3 38 42 Fish dishes 26 4 30 24 24 6 96 43 Bacon & ham 352 59 12 11 9 2 30 44 Beef & veal 222 37 14 13 10 3 39 45 Lamb 82 14 13 10 11 3 28 46 Pork 133 22 13 11 10 2 31 47 Chicken, turkey & game (e.g. pheasant) 393 66 19 14 15 4 47 48 Offal & offal dishes 6 1 16 17 9 5 50 49 Beef & veal dishes 312 53 41 31 31 8 110 50 Lamb, pork & bacon dishes 71 12 28 20 24 4 70 51 Poultry & game dishes 194 33 36 31 27 7 97 52 Burgers (beef & pork) 211 36 20 15 16 5 48 53 Sausages 385 65 16 13 12 3 44 54 Meat pies & pastries 80 13 16 11 14 4 43 55 Meat products (e.g. processed meats) 480 81 24 19 19 3 59 56 Alcoholic beverages 1 0 1 n/a 1 1 1 57 Sugars, syrups, preserves & sweeteners 461 78 8 11 5 1 23 58 Chocolate confectionery 498 84 20 17 16 3 54 59 Non-chocolate confectionery 452 76 14 13 10 2 41 60 Savoury snacks 505 85 15 11 12 3 34 61 Soups, sauces & miscellaneous foods 528 89 33 35 22 2 107 63 Teas 213 36 88 89 52 10 286 64 Coffees 17 3 32 40 20 0 167 65 Other beverages (e.g. water) 538 91 263 203 222 24 644 66 Carbonated beverages 473 80 154 136 114 26 440 67 Diet carbonated beverages 123 21 74 71 47 14 197 68 Squashes, cordials and fruit juice drinks 466 78 92 96 69 8 237 Food group 62 = Nutritional supplements
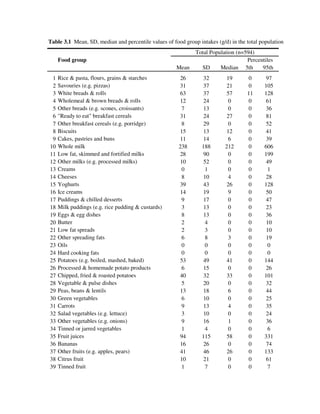
- 5. Table 3.3 Mean, SD, median and percentile values of food group intakes (g/d) for all boys and by age group in the total population All boys 5-12y (n =293) 5-8y (n = 145) 9-12y (n = 148) Food group Percentiles Percentiles Percentiles Mean SD Median 5th 95th Mean SD Median 5th 95th Mean SD Median 5th 95th 1 Rice & pasta , flours, grains & starches 24 33 14 0 100 21 25 15 0 79 27 38 14 0 112 2 Savouries (e.g. pizzas) 29 37 18 0 103 23 27 15 0 85 35 44 22 0 136 3 White breads & rolls 68 41 60 13 133 66 39 57 14 134 70 44 63 11 150 4 Wholemeal & brown breads & rolls 12 26 0 0 58 11 21 0 0 60 13 29 0 0 60 5 Other breads (e.g. scones, croissants) 6 12 0 0 35 5 11 0 0 31 7 13 0 0 41 6 quot;Ready to eatquot; breakfast cereals 37 27 34 0 91 33 23 31 0 83 42 29 39 0 93 7 Other breakfast cereals (e.g. porridge) 8 32 0 0 51 8 29 0 0 51 7 36 0 0 52 8 Biscuits 16 14 13 0 45 16 14 12 0 45 16 14 14 0 46 9 Cakes, pastries and buns 11 15 7 0 43 11 14 6 0 38 12 16 7 0 50 10 Whole milk 267 200 236 0 623 262 171 248 0 621 272 226 228 0 651 11 Low fat, skimmed and fortified milks 26 86 0 0 185 11 43 0 0 111 40 112 0 0 314 12 Other milks (e.g. processed milks) 11 61 0 0 48 9 52 0 0 44 13 69 0 0 54 13 Creams 0 2 0 0 0 0 2 0 0 0 0 2 0 0 2 14 Cheeses 7 9 3 0 27 7 9 2 0 25 7 10 4 0 31 15 Yoghurts 42 49 24 0 138 48 46 35 0 139 35 50 17 0 139 16 Ice creams 14 18 9 0 48 13 16 10 0 48 15 20 9 0 53 17 Puddings & chilled desserts 8 17 0 0 47 8 19 0 0 50 7 16 0 0 47 18 Milk puddings (e.g. rice pudding) 5 17 0 0 29 6 20 0 0 35 4 13 0 0 24 19 Eggs & egg dishes 8 13 0 0 36 8 13 0 0 33 7 13 0 0 38 20 Butter 2 5 0 0 11 2 5 0 0 9 2 5 0 0 17 21 Low fat spreads 1 3 0 0 9 2 4 0 0 11 1 3 0 0 8 22 Other spreading fats 6 8 3 0 20 6 7 3 0 20 7 10 4 0 21 23 Oils 0 0 0 0 0 0 0 0 0 0 0 0 0 0 0 24 Hard cooking fats 0 0 0 0 0 0 0 0 0 0 0 0 0 0 0 25 Potatoes (e.g. boiled, mashed, baked) 57 51 43 0 153 54 50 39 0 148 59 53 54 0 162 26 Processed & homemade potato products 5 14 0 0 26 5 11 0 0 26 5 17 0 0 26 27 Chipped, fried & roasted potatoes 42 34 35 0 105 37 30 32 0 97 48 37 42 0 124 28 Vegetable & pulse dishes 5 25 0 0 30 2 8 0 0 16 8 35 0 0 37 29 Peas, beans & lentils 14 19 8 0 51 14 18 8 0 55 14 19 8 0 47 30 Green vegetables 6 10 0 0 25 6 9 0 0 26 6 10 0 0 26 31 Carrots 11 14 5 0 40 10 13 5 0 36 11 15 6 0 44 32 Salad vegetables (e.g. lettuce) 2 7 0 0 14 1 4 0 0 6 3 8 0 0 20 33 Other vegetables (e.g. onions) 9 15 1 0 37 9 14 4 0 38 9 16 0 0 40 34 Tinned or jarred vegetables 1 6 0 0 6 1 6 0 0 4 1 5 0 0 11 35 Fruit juices 84 108 43 0 305 81 97 45 0 224 87 117 40 0 386
- 6. Table 3.3 continued Mean, SD, median and percentile values of food group intakes (g/d) for all boys and by age group in the total population All boys 5-12y (n =293) 5-8y (n = 145) 9-12y (n = 148) Food group Percentiles Percentiles Percentiles Mean SD Median 5th 95th Mean SD Median 5th 95th Mean SD Median 5th 95th 36 Bananas 18 29 0 0 78 20 31 0 0 93 15 26 0 0 76 37 Other fruits (e.g. apples, pears) 40 47 25 0 133 44 49 29 0 141 36 45 21 0 120 38 Citrus fruit 10 22 0 0 61 11 23 0 0 70 9 21 0 0 58 39 Tinned fruit 1 8 0 0 0 1 7 0 0 0 1 9 0 0 0 40 Nuts & seeds, herbs & spices 1 4 0 0 8 1 4 0 0 6 1 3 0 0 9 41 Fish & fish products 8 12 0 0 33 9 11 7 0 32 7 13 0 0 33 42 Fish dishes 1 6 0 0 0 0 3 0 0 0 1 8 0 0 0 43 Bacon & ham 8 11 4 0 29 6 8 3 0 22 9 12 6 0 38 44 Beef & veal 6 12 0 0 27 5 12 0 0 26 6 12 0 0 35 45 Lamb 2 7 0 0 16 2 7 0 0 11 3 7 0 0 17 46 Pork 3 7 0 0 20 3 6 0 0 21 3 7 0 0 22 47 Chicken, turkey & game (e.g. pheasant) 12 15 8 0 41 11 11 8 0 33 14 18 9 0 50 48 Offal & offal dishes 0 1 0 0 0 0 1 0 0 0 0 1 0 0 0 49 Beef & veal dishes 22 31 3 0 83 22 29 7 0 83 22 32 0 0 87 50 Lamb, pork & bacon dishes 3 10 0 0 24 2 8 0 0 24 4 12 0 0 28 51 Poultry & game dishes 12 27 0 0 57 8 18 0 0 41 16 32 0 0 71 52 Burgers (beef & pork) 8 14 0 0 33 6 12 0 0 26 9 15 0 0 48 53 Sausages 11 14 8 0 43 12 12 9 0 37 11 15 6 0 48 54 Meat pies & pastries 2 7 0 0 17 2 6 0 0 15 2 7 0 0 18 55 Meat products (e.g. processed meats) 22 23 17 0 66 22 19 19 0 62 21 26 13 0 76 56 Alcoholic beverages 0 0 0 0 0 0 0 0 0 0 0 0 0 0 0 57 Sugars, syrups, preserves & sweeteners 7 14 4 0 21 7 16 3 0 20 8 11 4 0 23 58 Chocolate confectionery 17 17 13 0 52 14 13 12 0 39 20 20 14 0 61 59 Non-chocolate confectionery 11 14 6 0 38 11 13 7 0 34 12 15 6 0 43 60 Savoury snacks 12 11 10 0 34 11 11 9 0 33 13 12 11 0 35 61 Soups, sauces & miscellaneous foods 29 36 16 0 118 22 26 14 0 71 36 43 22 0 132 63 Teas 33 72 0 0 170 24 58 0 0 141 41 84 0 0 222 64 Coffees 1 5 0 0 0 0 2 0 0 0 1 7 0 0 0 65 Other beverages (e.g. water) 245 214 204 0 642 221 181 194 0 583 269 240 212 0 771 66 Carbonated beverages 138 146 94 0 456 101 100 79 0 312 173 172 125 0 562 67 Diet carbonated beverages 15 48 0 0 91 11 31 0 0 71 20 61 0 0 119 68 Squashes, cordials and fruit juice drinks 73 84 48 0 232 78 84 51 0 218 69 83 45 0 256 Food group 62 = Nutritional supplements
- 7. Table 3.4 Mean, SD, median and percentile values of food group intakes (g/d) for all girls and by age group in the total population All girls 5-12y (n =301) 5-8y (n =151) 9-12y (n =150) Food group Percentiles Percentiles Percentiles Mean SD Median 5th 95th Mean SD Median 5th 95th Mean SD Median 5th 95th 1 Rice & pasta, flours, grains & starches 28 31 21 0 94 26 30 19 0 81 30 33 23 0 101 2 Savouries (e.g. pizzas) 33 37 23 0 106 33 38 23 0 106 34 37 23 0 109 3 White breads & rolls 58 32 54 9 118 52 31 49 6 102 64 33 59 14 127 4 Wholemeal & brown breads & rolls 12 22 0 0 64 12 20 0 0 59 12 24 0 0 67 5 Other breads (e.g. scones, croissants) 8 14 0 0 36 8 15 0 0 36 8 13 0 0 37 6 quot;Ready to eatquot; breakfast cereals 24 20 22 0 61 25 19 23 0 61 23 20 20 0 60 7 Other breakfast cereals (e.g. porridge) 8 26 0 0 55 7 25 0 0 52 9 27 0 0 56 8 Biscuits 14 12 11 0 38 14 11 11 0 38 14 12 11 0 39 9 Cakes, pastries and buns 10 13 6 0 39 9 13 4 0 38 11 12 8 0 40 10 Whole milk 209 170 183 0 545 230 168 215 0 557 189 171 160 0 541 11 Low fat, skimmed and fortified milks 30 93 0 0 207 23 84 0 0 169 36 101 0 0 259 12 Other milks (e.g. processed milks) 10 42 0 0 54 12 56 0 0 70 8 18 0 0 49 13 Creams 0 1 0 0 1 0 1 0 0 1 0 1 0 0 2 14 Cheeses 8 11 4 0 32 9 11 5 0 35 8 11 4 0 27 15 Yoghurts 36 38 27 0 112 45 38 36 0 124 27 36 18 0 87 16 Ice creams 15 20 9 0 50 14 19 8 0 49 15 21 10 0 53 17 Puddings & chilled desserts 10 17 0 0 46 7 14 0 0 40 12 20 0 0 50 18 Milk puddings (e.g. rice pudding) 2 8 0 0 19 2 9 0 0 9 2 8 0 0 21 19 Eggs & egg dishes 8 13 0 0 37 7 13 0 0 33 8 13 0 0 40 20 Butter 1 4 0 0 9 2 4 0 0 11 1 3 0 0 8 21 Low fat spreads 2 4 0 0 10 2 4 0 0 11 1 4 0 0 9 22 Other spreading fats 5 7 3 0 17 5 6 2 0 17 6 7 5 0 19 23 Oils 0 0 0 0 0 0 0 0 0 0 0 0 0 0 0 24 Hard cooking fats 0 0 0 0 0 0 0 0 0 0 0 0 0 0 0 25 Potatoes (e.g. boiled, mashed, baked) 49 46 37 0 131 48 43 41 0 130 50 48 36 0 133 26 Processed & homemade potato products 6 15 0 0 28 5 10 0 0 24 7 19 0 0 30 27 Chipped, fried & roasted potatoes 37 29 32 0 97 31 24 27 0 80 44 32 39 0 112 28 Vegetable & pulse dishes 5 13 0 0 34 6 13 0 0 34 5 13 0 0 43 29 Peas, beans & lentils 11 18 6 0 38 12 17 7 0 38 10 19 1 0 39 30 Green vegetables 6 10 0 0 26 6 9 0 0 25 6 11 0 0 28 31 Carrots 8 11 3 0 31 7 9 3 0 28 9 13 3 0 35 32 Salad vegetables (e.g. lettuce) 5 12 0 0 29 4 14 0 0 29 5 11 0 0 32 33 Other vegetables (e.g. onions) 9 18 1 0 36 9 21 1 0 34 9 15 2 0 39 34 Tinned or jarred vegetables 1 3 0 0 8 1 3 0 0 5 1 3 0 0 8
- 8. Table 3.4 continued Mean, SD, median and percentile values of food group intakes (g/d) for all girls and by age group in the total population All girls 5-12y (n =301) 5-8y (n =151) 9-12y (n =150) Food group Percentiles Percentiles Percentiles Mean SD Median 5th 95th Mean SD Median 5th 95th Mean SD Median 5th 95th 35 Fruit juices 103 122 71 0 350 105 122 75 0 347 101 122 58 0 353 36 Bananas 15 23 0 0 64 18 26 2 0 76 13 19 0 0 50 37 Other fruits (e.g. apples, pears) 42 44 28 0 133 42 46 33 0 148 41 42 26 0 130 38 Citrus fruit 11 21 0 0 61 10 20 0 0 54 12 21 0 0 69 39 Tinned fruit 2 6 0 0 14 1 6 0 0 15 2 7 0 0 14 40 Nuts & seeds, herbs & spices 1 2 0 0 6 1 2 0 0 6 1 2 0 0 6 41 Fish & fish products 7 11 0 0 28 7 12 0 0 29 7 11 0 0 27 42 Fish dishes 2 9 0 0 8 2 9 0 0 18 1 9 0 0 3 43 Bacon & ham 7 10 4 0 24 6 9 4 0 23 8 11 4 0 26 44 Beef & veal 5 9 0 0 22 4 8 0 0 21 5 10 0 0 24 45 Lamb 1 5 0 0 13 1 4 0 0 10 2 5 0 0 15 46 Pork 3 8 0 0 17 3 9 0 0 18 3 7 0 0 18 47 Chicken, turkey & game (e.g. pheasant) 12 14 9 0 37 11 13 8 0 40 13 14 10 0 37 48 Offal & offal dishes 0 3 0 0 0 0 4 0 0 0 0 1 0 0 0 49 Beef & veal dishes 21 30 11 0 82 21 30 12 0 106 21 31 7 0 80 50 Lamb, pork & bacon dishes 4 12 0 0 35 3 9 0 0 26 5 15 0 0 45 51 Poultry & game dishes 11 22 0 0 58 10 20 0 0 52 13 23 0 0 61 52 Burgers (beef & pork) 7 12 0 0 31 4 8 0 0 22 10 15 0 0 37 53 Sausages 10 12 6 0 38 11 12 7 0 39 8 12 4 0 28 54 Meat pies & pastries 2 7 0 0 16 2 7 0 0 12 3 8 0 0 21 55 Meat products (e.g. processed meats) 17 15 13 0 45 18 15 15 0 47 16 15 12 0 44 56 Alcoholic beverages 0 0 0 0 0 0 0 0 0 0 0 0 0 0 0 57 Sugars, syrups, preserves & sweeteners 5 6 3 0 19 5 6 3 0 19 5 7 3 0 23 58 Chocolate confectionery 17 17 13 0 48 15 15 11 0 38 20 18 16 0 54 59 Non-chocolate confectionery 10 12 6 0 36 10 12 6 0 35 10 13 6 0 41 60 Savoury snacks 13 11 11 0 34 12 11 10 0 34 13 11 12 0 34 61 Soups, sauces & miscellaneous foods 30 33 20 0 89 25 30 14 0 91 34 34 26 0 88 63 Teas 30 63 0 0 175 20 51 0 0 140 40 72 0 0 208 64 Coffees 1 11 0 0 0 0 2 0 0 0 2 15 0 0 1 65 Other beverages (e.g. water) 231 202 180 0 599 197 195 142 0 549 265 204 247 0 690 66 Carbonated beverages 107 125 71 0 328 87 106 57 0 263 128 138 88 0 404 67 Diet carbonated beverages 15 40 0 0 95 12 34 0 0 90 18 45 0 0 97 68 Squashes, cordials and fruit juice drinks 72 101 48 0 206 73 92 49 0 209 70 110 46 0 205 Food group 62 = Nutritional supplements
- 9. Table 3.5 Mean, SD, median and percentile values of food group intakes (g/d) for all boys and by age group in consumers only All boys 5-12y (consumers) 5-8 y 9-12 y Food group Percentiles Percentiles Percentiles n % Mean SD Median 5th 95th n % Mean SD Median 5th 95th n % Mean SD Median 5th 95th 1 Rice & pasta, flours, grains & starches 175 60 41 33 30 8 111 90 62 35 23 29 8 87 85 57 47 40 33 8 116 2 Savouries (e.g. pizzas) 197 67 43 38 31 5 126 95 66 35 26 29 4 91 102 69 51 45 33 6 142 3 White breads & rolls 290 99 69 41 60 15 133 144 99 66 38 58 16 134 146 99 71 44 64 13 154 4 Wholemeal & brown breads & rolls 107 37 33 34 24 5 85 53 37 29 27 21 4 88 54 36 37 39 27 7 111 5 Other breads (e.g. scones, croissants) 102 35 18 14 14 3 52 46 32 17 13 13 4 52 56 38 19 15 14 3 53 6 quot;Ready to eatquot; breakfast cereals 277 95 40 26 36 7 92 138 95 34 22 31 6 84 139 94 45 28 41 8 93 7 Other breakfast cereals (e.g. porridge) 45 15 50 69 21 3 216 29 20 40 54 18 2 210 16 11 68 90 49 3 355 8 Biscuits 259 88 18 14 15 3 46 134 92 17 14 13 3 45 125 84 19 13 17 3 46 9 Cakes, pastries and buns 174 59 19 15 15 4 51 88 61 17 14 14 4 47 86 58 21 17 16 4 59 10 Whole milk 264 90 296 189 272 62 642 134 92 284 160 276 63 633 130 88 309 215 260 34 677 11 Low fat, skimmed and fortified milks 46 16 164 158 132 15 530 17 12 96 89 71 12 359 29 20 205 177 176 18 659 12 Other milks (e.g. processed milks) 30 10 108 163 48 18 647 12 8 107 154 48 9 557 18 12 109 173 48 34 758 13 Creams 16 5 5 6 3 0 20 7 5 5 6 3 0 13 9 6 5 6 3 0 20 14 Cheeses 162 55 13 9 11 2 33 74 51 14 9 13 2 31 88 59 12 9 10 2 33 15 Yoghurts 196 67 62 47 51 11 151 113 78 62 44 54 11 156 83 56 62 52 43 12 153 16 Ice creams 184 63 23 18 17 6 58 95 66 21 16 16 7 57 89 60 25 20 18 5 71 17 Puddings & chilled desserts 81 28 28 23 24 3 69 40 28 30 25 24 4 69 41 28 26 21 24 2 85 18 Milk puddings (e.g. rice pudding) 43 15 33 33 22 3 95 24 17 37 37 23 5 156 19 13 27 27 17 2 87 19 Eggs & egg dishes 119 41 19 13 17 4 43 59 41 19 13 19 4 41 60 41 18 14 15 4 46 20 Butter 78 27 7 8 5 0 26 37 26 6 8 4 0 19 41 28 8 8 5 1 27 21 Low fat spreads 71 24 6 4 5 1 16 38 26 7 4 5 1 17 33 22 6 4 5 1 15 22 Other spreading fats 187 64 10 9 8 1 24 92 63 9 7 7 1 22 95 64 10 10 8 1 33 23 Oils 10 3 1 1 0 0 3 7 5 1 1 0 0 3 3 2 1 0 1 0 1 24 Hard cooking fats 0 0 0 0 0 0 0 0 0 0 0 0 0 0 0 0 0 0 0 0 0 25 Potatoes (e.g. boiled, mashed, baked) 259 88 64 50 53 10 157 132 91 59 49 43 10 152 127 86 69 50 61 10 170 26 Processed & homemade potato products 73 25 21 22 15 6 63 46 32 17 12 14 6 49 27 18 28 32 16 3 124 27 Chipped, fried & roasted potatoes 259 88 48 33 40 9 109 129 89 42 29 35 6 99 130 88 54 35 50 13 128 28 Vegetable & pulse dishes 47 16 32 56 12 2 191 18 12 18 14 12 1 47 29 20 41 70 14 2 277 29 Peas, beans & lentils 182 62 22 19 16 3 63 94 65 21 19 15 3 63 88 59 23 20 17 4 63 30 Green vegetables 131 45 13 11 10 2 36 66 46 13 9 11 2 31 65 44 14 12 10 2 42 31 Carrots 178 61 17 15 14 2 45 94 65 15 13 13 1 38 84 57 20 16 16 3 57 32 Salad vegetables (e.g. lettuce) 45 15 14 12 10 3 46 17 12 9 9 5 0 33 28 19 16 13 12 3 54 33 Other vegetables (e.g. onions) 150 51 17 16 13 2 51 80 55 17 14 13 2 50 70 47 18 18 13 2 58 34 Tinned or jarred vegetables 20 7 16 16 13 1 65 9 6 17 20 10 3 66 11 7 15 12 15 1 43
- 10. Table 3.5 continued Mean, SD, median and percentile values of food group intakes (g/d) for all boys and by age group in consumers only All boys 5-12y (consumers) 5-8 y 9-12 y Food group Percentiles Percentiles Percentiles n % Mean SD Median 5th 95th n % Mean SD Median 5th 95th n % Mean SD Median 5th 95th 35 Fruit juices 195 67 126 110 92 21 384 100 69 117 97 88 20 279 95 64 136 122 106 21 424 36 Bananas 121 41 43 30 34 7 104 69 48 42 32 33 6 105 52 35 43 28 37 9 106 37 Other fruits (e.g. apples, pears) 208 71 56 47 43 5 148 108 74 59 48 48 4 154 100 68 53 45 42 5 147 38 Citrus fruit 81 28 37 28 32 6 99 42 29 37 30 28 3 99 39 26 36 28 33 6 100 39 Tinned fruit 10 3 33 31 17 4 79 5 3 29 29 18 4 79 5 3 37 35 16 9 79 40 Nuts & seeds, herbs & spices 43 15 7 7 6 0 18 15 10 7 10 4 0 41 28 19 6 5 6 0 17 41 Fish & fish products 144 49 17 12 14 5 38 84 58 16 10 14 4 37 60 41 18 14 14 5 45 42 Fish dishes 9 3 28 24 22 5 79 4 3 16 6 13 12 25 5 3 38 28 33 5 79 43 Bacon & ham 172 59 13 11 10 2 38 81 56 11 8 9 2 28 91 61 15 13 10 3 45 44 Beef & veal 110 38 16 15 10 3 44 55 38 14 16 10 3 38 55 37 17 14 13 3 55 45 Lamb 43 15 15 13 11 3 50 16 11 15 16 11 3 71 27 18 14 11 13 1 46 46 Pork 71 24 13 8 11 2 29 38 26 11 8 9 2 26 33 22 14 8 13 4 32 47 Chicken, turkey & game (e.g. pheasant) 185 63 19 15 15 4 47 98 68 16 11 14 4 36 87 59 23 18 17 4 60 48 Offal & offal dishes 3 1 9 7 6 5 17 2 1 5 1 5 5 6 1 1 17 n/a 17 17 17 49 Beef & veal dishes 148 51 44 30 35 7 104 76 52 42 28 30 7 99 72 49 46 32 36 8 116 50 Lamb, pork & bacon dishes 31 11 27 17 24 9 70 10 7 29 11 26 17 49 21 14 26 20 17 7 72 51 Poultry & game dishes 88 30 39 36 29 9 99 35 24 32 24 26 8 99 53 36 44 41 31 12 135 52 Burgers (beef & pork) 106 36 21 16 16 4 54 44 30 18 15 15 5 32 62 42 23 16 17 4 58 53 Sausages 191 65 17 14 13 4 49 103 71 17 11 14 4 43 88 59 18 16 12 4 57 54 Meat pies & pastries 38 13 16 10 14 5 44 17 12 16 12 14 4 43 21 14 17 9 16 5 45 55 Meat products (e.g. processed meats) 238 81 27 22 21 4 72 125 86 26 18 23 4 68 113 76 28 27 19 3 83 56 Alcoholic beverages 1 0 1 n/a 1 1 1 1 1 1 n/a 1 1 1 0 0 0 0 0 0 0 57 Sugars, syrups, preserves & sweeteners 229 78 9 15 6 1 23 115 79 8 17 4 1 21 114 77 10 12 7 1 26 58 Chocolate confectionery 240 82 21 17 16 3 56 120 83 17 12 14 3 42 120 81 24 20 19 3 63 59 Non-chocolate confectionery 222 76 15 14 11 1 42 109 75 14 13 12 1 38 113 76 15 15 10 2 46 60 Savoury snacks 241 82 15 11 12 3 35 122 84 14 10 11 3 34 119 80 16 11 14 3 36 61 Soups, sauces & miscellaneous foods 252 86 34 37 21 2 126 121 83 26 27 17 2 78 131 89 40 43 25 2 139 63 Teas 104 35 92 97 50 11 324 45 31 78 82 47 9 293 59 40 103 106 64 16 333 64 Coffees 6 2 30 20 22 19 71 1 1 19 n/a 19 19 19 5 3 32 22 22 20 71 65 Other beverages (e.g. water) 260 89 276 207 235 23 666 130 90 246 174 222 24 614 130 88 306 232 260 22 797 66 Carbonated beverages 242 83 167 144 125 25 495 118 81 124 98 96 18 343 124 84 207 169 162 29 577 67 Diet carbonated beverages 59 20 76 84 44 7 266 29 20 54 50 29 7 186 30 20 98 104 46 16 405 68 Squashes, cordials and fruit juice drinks 233 80 92 84 64 7 238 120 83 94 84 69 9 228 113 76 90 85 64 6 269 Food group 62 = Nutritional supplements
- 11. Table 3.6 Mean, SD, median and percentile values of food group intakes (g/d) for all girls and by age group in consumers only All girls 5-12 y (consumers) 5-8 y 9-12 y Food group Percentiles Percentiles Percentiles n % Mean SD Median 5th 95th n % Mean SD Median 5th 95th n % Mean SD Median 5th 95th 1 Rice & pasta, flours, grains & starches 213 71 40 30 31 9 101 107 71 37 30 29 7 88 106 71 43 31 33 9 104 2 Savouries (e.g. pizzas) 230 76 44 37 33 7 110 118 78 42 38 32 6 108 112 75 46 36 35 7 119 3 White breads & rolls 293 97 59 31 55 13 119 145 96 54 30 52 11 103 148 99 64 32 59 16 128 4 Wholemeal & brown breads & rolls 128 43 28 26 21 3 84 63 42 28 23 24 3 81 65 43 29 29 17 4 86 5 Other breads (e.g. scones, croissants) 134 45 18 16 14 4 49 69 46 18 18 12 3 65 65 43 19 14 16 4 47 6 quot;Ready to eatquot; breakfast cereals 273 91 27 19 24 4 61 141 93 27 18 25 4 62 132 88 27 20 22 4 63 7 Other breakfast cereals (e.g. porridge) 58 19 42 47 20 3 154 28 19 40 47 17 3 166 30 20 44 47 22 3 158 8 Biscuits 259 86 16 11 13 3 40 132 87 16 11 13 2 39 127 85 16 11 13 3 40 9 Cakes, pastries and buns 185 61 17 12 13 3 41 87 58 16 13 12 3 43 98 65 17 11 15 3 41 10 Whole milk 270 90 234 164 209 23 579 138 91 251 160 226 28 575 132 88 215 166 180 17 609 11 Low fat, skimmed and fortified milks 60 20 148 162 83 5 526 18 12 196 163 135 5 589 42 28 128 159 58 5 517 12 Other milks (e.g. processed milks) 44 15 68 90 48 10 321 17 0 106 136 59 7 520 27 18 44 17 43 16 80 13 Creams 18 6 4 3 3 1 16 10 7 3 2 2 1 6 8 5 5 5 3 2 16 14 Cheeses 190 63 13 11 10 2 41 100 66 13 11 11 1 45 90 60 13 12 10 2 37 15 Yoghurts 225 75 48 36 40 9 124 131 87 51 36 44 9 126 94 63 44 37 36 8 102 16 Ice creams 197 65 22 21 17 5 58 97 64 22 19 17 4 55 100 67 23 22 16 6 65 17 Puddings & chilled desserts 121 40 24 20 17 3 60 53 35 20 16 16 2 59 68 45 27 23 20 6 62 18 Milk puddings (e.g. rice pudding) 30 10 22 17 18 2 61 11 7 27 23 21 3 64 19 13 19 12 18 1 43 19 Eggs & egg dishes 132 44 18 14 14 4 51 65 43 17 15 13 3 53 67 45 18 14 15 4 49 20 Butter 86 29 5 5 4 0 15 49 32 6 6 4 1 20 37 25 4 4 3 0 12 21 Low fat spreads 76 25 6 5 6 0 14 45 30 6 4 5 0 13 31 21 6 5 6 1 20 22 Other spreading fats 209 69 8 7 6 1 20 97 64 7 6 6 1 20 112 75 8 8 7 1 20 23 Oils 14 5 1 1 1 0 2 5 3 0 0 0 0 1 9 6 1 1 1 0 2 24 Hard cooking fats 1 0 1 n/a 1 1 1 1 1 1 n/a 1 1 1 0 0 0 0 0 0 0 25 Potatoes (e.g. boiled, mashed, baked) 266 88 56 45 46 8 138 134 89 54 42 47 6 141 132 88 57 48 44 9 138 26 Processed & homemade potato products 92 31 19 23 14 5 52 46 30 15 13 11 4 43 46 31 24 29 16 6 92 27 Chipped, fried & roasted potatoes 272 90 41 28 35 9 100 131 87 35 22 30 10 82 141 94 47 31 42 9 116 28 Vegetable & pulse dishes 80 27 20 19 12 2 67 45 30 19 18 11 2 66 35 23 21 21 12 2 69 29 Peas, beans & lentils 178 59 19 20 14 2 50 100 66 19 18 14 2 40 78 52 20 23 14 1 61 30 Green vegetables 136 45 14 11 11 2 34 71 47 13 10 12 1 34 65 43 14 13 9 2 40 31 Carrots 176 58 14 11 11 1 36 96 64 12 9 10 1 30 80 53 17 13 13 3 47 32 Salad vegetables (e.g. lettuce) 95 32 15 18 8 2 49 39 26 16 23 8 2 68 56 37 14 14 9 1 43 33 Other vegetables (e.g. onions) 159 53 17 22 11 1 45 77 51 17 26 10 1 45 82 55 17 17 11 1 46 34 Tinned or jarred vegetables 36 12 7 5 5 1 19 16 11 7 6 4 1 25 20 13 7 4 6 2 18
- 12. Table 3.6 continued Mean, SD, median and percentile values of food group intakes (g/d) for all girls and by age group in consumers only All girls 5-12 y (consumers) 5-8 y 9-12 y Food group Percentiles Percentiles Percentiles n % Mean SD Median 5th 95th n % Mean SD Median 5th 95th n % Mean SD Median 5th 95th 35 Fruit juices 225 75 138 122 107 18 374 114 75 139 122 108 19 375 111 74 137 123 106 14 388 36 Bananas 139 46 33 23 26 6 84 76 50 36 26 27 6 89 63 42 30 20 25 6 63 37 Other fruits (e.g. apples, pears) 226 75 56 43 44 10 147 106 70 60 44 49 11 160 120 80 51 41 40 8 136 38 Citrus fruit 107 36 30 25 21 3 79 52 34 28 26 19 3 81 55 37 32 25 23 6 79 39 Tinned fruit 25 8 18 14 16 1 53 12 8 18 15 17 1 54 13 9 18 14 15 1 52 40 Nuts & seeds, herbs & spices 43 14 5 4 4 0 14 22 15 5 4 4 0 14 21 14 4 3 4 0 13 41 Fish & fish products 134 45 16 12 14 3 36 72 48 15 13 13 3 37 62 41 16 11 15 4 42 42 Fish dishes 17 6 31 25 26 6 105 10 7 32 18 34 8 59 7 5 30 34 22 6 105 43 Bacon & ham 180 60 12 11 9 1 28 91 60 11 10 8 1 28 89 59 13 12 10 2 30 44 Beef & veal 112 37 13 11 11 2 30 52 34 12 10 9 1 37 60 40 14 12 11 2 29 45 Lamb 39 13 11 7 11 3 28 16 11 10 6 8 3 24 23 15 12 7 12 1 28 46 Pork 62 21 13 13 10 2 36 30 20 14 16 8 2 57 32 21 13 9 11 2 37 47 Chicken, turkey & game (e.g. pheasant) 208 69 18 13 14 4 45 104 69 17 13 13 4 46 104 69 19 13 16 4 45 48 Offal & offal dishes 3 1 23 24 10 8 50 2 1 29 30 29 8 50 1 1 10 n/a 10 10 10 49 Beef & veal dishes 164 54 39 32 28 8 116 88 58 36 32 24 8 117 76 0 41 32 31 8 119 50 Lamb, pork & bacon dishes 40 13 29 21 26 3 75 19 13 21 17 12 2 60 21 14 35 23 34 3 77 51 Poultry & game dishes 106 35 32 26 25 5 83 54 36 28 26 19 4 77 52 35 37 25 31 5 105 52 Burgers (beef & pork) 105 35 20 14 17 5 42 36 24 15 9 14 3 34 69 46 22 15 23 5 54 53 Sausages 194 64 15 12 11 3 41 110 73 15 12 10 3 40 84 56 15 12 12 3 48 54 Meat pies & pastries 42 14 16 13 13 4 52 18 12 15 14 11 4 64 24 16 18 12 15 3 50 55 Meat products (e.g. processed meats) 242 80 21 14 18 3 48 124 82 21 14 18 3 48 118 79 20 15 16 3 49 56 Alcoholic beverages 0 0 0 0 0 0 0 0 0 0 0 0 0 0 0 0 0 0 0 0 0 57 Sugars, syrups, preserves & sweeteners 232 77 7 7 4 1 22 117 77 6 6 4 1 20 115 77 7 7 5 1 25 58 Chocolate confectionery 258 86 20 16 16 3 52 129 85 17 15 13 3 41 129 86 23 17 20 4 56 59 Non-chocolate confectionery 230 76 13 12 9 2 40 116 77 13 12 9 2 36 114 76 13 13 8 2 44 60 Savoury snacks 264 88 14 10 13 3 35 131 87 14 10 12 3 35 133 89 15 10 14 3 36 61 Soups, sauces & miscellaneous foods 276 92 32 33 23 2 90 135 89 28 31 17 1 96 141 94 36 34 28 2 89 63 Teas 109 36 83 81 56 10 268 47 31 66 74 40 7 263 62 41 96 84 69 15 279 64 Coffees 11 4 34 49 15 0 167 2 1 15 1 15 15 16 9 6 38 53 15 0 167 65 Other beverages (e.g. water) 278 92 250 199 203 28 606 140 93 213 194 158 22 556 138 92 288 197 264 30 693 66 Carbonated beverages 231 77 140 125 106 26 387 115 76 114 108 86 24 276 116 77 165 136 129 29 420 67 Diet carbonated beverages 64 21 72 58 59 14 191 26 17 73 50 66 10 190 38 25 71 64 53 14 215 68 Squashes, cordials and fruit juice drinks 233 77 93 107 71 8 239 123 81 89 95 59 6 243 110 73 96 119 73 8 245 Food group 62 = Nutritional supplements