SlideShare a Scribd company logo
1 of 14
Download to read offline
International Journal of Obesity (2002) 26, 1596–1609
       ß 2002 Nature Publishing Group All rights reserved 0307–0565/02 $25.00
                                                               www.nature.com/ijo


PAPER
Body composition estimates from NHANES III
bioelectrical impedance data
WC Chumlea1, SS Guo1*, RJ Kuczmarski2, KM Flegal3, CL Johnson3, SB Heymsfield4,
HC Lukaski5, K Friedl6 and VS Hubbard7
1
 Department of Community, Health Wright State University School of Medicine, Dayton, Ohio, USA;2National Institutes of
Health Division of Digestive Diseases and Nutrition, NIDDK, Bethesda, Maryland, USA; 3Centers for Disease Control and
Prevention, National Center for Health Statistics, Division of Health Examination Statistics, Hyattsville, Maryland, USA; 4Obesity
Research Center, St Lukes-Roosevelt Hospital, Columbia University, New York, USA; 5US Department of Agriculture, Agriculture
Research Service, Grand Forks HNRC, Grand Forks, North Dakota, USA; 6Military Operational Medicine Program, Military Medical
Research and Materiel Command, Frederick, Maryland, USA; and 7National Institutes of Health, Division of Nutrition Research
Coordination and Nutritional Sciences Branch, NIDDK, Bethesda, Maryland, USA


BACKGROUND: Body composition estimates for the US population are important in order to analyze trends in obesity,
sarcopenia and other weight-related health conditions. National body composition estimates have not previously been
available.
OBJECTIVE: To use transformed bioelectrical impedance analysis (BIA) data in sex-specific, multicomponent model-derived
prediction formulae, to estimate total body water (TBW), fat-free mass (FFM), total body fat (TBF), and percentage body fat
(%BF) using a nationally representative sample of the US population.
DESIGN: Anthropometric and BIA data were from the third National Health and Nutrition Examination Survey (NHANES III;
1988 – 1994). Sex-specific BIA prediction equations developed for this study were applied to the NHANES data, and mean values
for TBW, FFM, TBF and %BF were estimated for selected age, sex and racial-ethnic groups.
RESULTS: Among the non-Hispanic white, non-Hispanic black, and Mexican-American participants aged 12 – 80 y examined in
NHANES III, 15 912 had data available for weight, stature and BIA resistance measures. Males had higher mean TBW and FFM
than did females, regardless of age or racial-ethnic status. Mean TBW and FFM increased from the adolescent years to mid-
adulthood and declined in older adult age groups. Females had higher mean TBF and %BF estimates than males at each age
group. Mean TBF also increased with older age groups to approximately 60 y of age after which it decreased.
CONCLUSIONS: These mean body composition estimates for TBW, FFM, TBF and %BF based upon NHANES III BIA data provide
a descriptive reference for non-Hispanic whites, non-Hispanic blacks and Mexican Americans in the US population.
International Journal of Obesity (2002) 26, 1596 – 1611. doi:10.1038/sj.ijo.0802167

Keywords: body composition; obesity; BIA; NHANES; health surveys

Introduction                                                                        constituents that link obesity, aging, and chronic disease with
Overweight and obesity are increasing in the US population.1,2                      subsequent morbidity and mortality.6 – 8 There exists little
Excess adiposity is the major weight-related health concern up                      accurate information at present on estimates of TBW, FFM,
to the seventh decade of life, but an increased lifespan3                           TBF, and percentage fat (%BF) for the US population as a
indicates the importance of lean tissue loss and its association                    whole.9 – 11 Systems capable of reliably quantifying body com-
with frailty and sarcopenia in the elderly.4,5 Fat and lean                         position under controlled conditions, such as bioelectrical
components of the body including total body fat (TBF),                              impedance analysis (BIA) and dual-energy X-ray absorptiom-
fat-free mass (FFM), and total body water (TBW) are important                       etry (DXA), have been introduced and subsequently validated
                                                                                    over the past two decades.12,13 This technology and the
                                                                                    increasing clinical and research importance of body com-
                                                                                    position highlight the need for improved information on
*Correspondence: SS Guo, Lifespan Health Research Center, Department                population estimates of TBW, FFM, TBF and %BF.
of Community Health, 3171 Research Blvd, Kettering Ohio, OH 45420,                     Prior surveys and studies of body composition in the
USA.
E-mail: shumei.guo@wright.edu                                                       US population are based largely on anthropometric data
Received 11 October 2001; revised 15 May 2002;                                      including measures of body weight, stature, skinfold thick-
accepted 1 July 2002
Body composition estimates from NHANES III
                                                                   WC Chumlea et al
                                                                                                                                            1597
nesses and circumferences. These provide correlates of             Hispanic black males, 2606 non-Hispanic black females,
fatness (ie body mass index; BMI) or approximate estimates         2494 Mexican American males, and 2298 Mexican American
of regional and total body fatness. These data for the US          females, for development of the body composition distribu-
population collected over the past 30 y have a limited             tion data.
ability to quantify body composition. The report of the
1994 NIH-sponsored Technology Assessment Conference,
‘Bioelectrical Impedance Analysis in Body Composition
                                                                   Measurements
Measurement’,14 recommended that national reference
                                                                   Documentation for the NHANES III procedures includes
distributions for body composition be developed using BIA
                                                                   written descriptions15 and a video demonstration.23 Body
data from the Third National Health and Nutrition Exam-
                                                                   weight was measured with an electronic load cell scale to the
ination Survey.15 BIA systems are calibrated for the popula-
                                                                   nearest 0.01 kg. Participants wore only under-shorts and
tion under study by developing prediction formulae based
                                                                   disposable paper shirts, pants and foam slippers but no
on criterion methods from resistance, stature and other
                                                                   adjustment was made for this minimal clothing weight
easily acquired variables.16 – 20 Most of these predictive equa-
                                                                   (0.18 kg) in the analyses. Stature was measured to the nearest
tions are based on limited samples and two-component
                                                                   0.1 cm using a fixed stadiometer. Participants were posi-
models that describe fat and FFM only.21 To use the
                                                                   tioned with heels, buttocks, back and head against the
NHANES III BIA data to estimate national body composition
                                                                   upright surface of the stadiometer with the head positioned
distributions, a set of externally derived BIA prediction
                                                                   in the Frankfort horizontal plane.
equations were developed using isotope dilution to predict
                                                                      Participants had a single, tetrapolar BIA measurement of
TBW and a multicomponent model to predict FFM.22
                                                                   resistance (Res) and reactance at 50 kHz taken between the
These equations provided estimates for the major body
                                                                   right wrist and ankle while in a supine position, using
compartments when applied to the NHANES III data for
                                                                   Valhalla 1990B Bio-Resistance Body Composition Analyzer
non-Hispanic whites, non-Hispanic blacks and Mexican-
                                                                   (Valhalla Scientific, San Diego, CA, USA).24 the decision
Americans aged 12 – 80 y. This report fulfills the recommen-
                                                                   regarding the selection of the impedance analyzer was
dation of the 1994 NIH Conference14 with the presentation
                                                                   made ca 1986. The reactance values were not used in the
of cross-sectional estimates for mean TBW, FFM, TBF and
                                                                   body composition prediction equations22 and, therefore,
%BF by sex and age for these three racial-ethnic groups in the
                                                                   are not presented or discussed further. The measure-
US population.
                                                                   ment accuracy of the Valhalla impedance machines used
                                                                   in NHANES III was independently certified by the
                                                                   National Institute of Standards and Technology following
Methods
                                                                   the survey.
Sample
The NHANES III was a nationally representative, two-phase,
6 y, cross-sectional survey conducted from 1988 until 1994.15
The complex sampling plan used a stratified, multistage,            Body composition calculations
probability cluster design. The initial sampling of house-         Conversion of NHANES III BIA values. The TBW and FFM
holds, identification of participants, and the collection of        prediction equations22 used Res data from RJL bioelectrical
data in mobile examination centers in NHANES III were              impedance analyzers (RJL, Clinton Twp, MI, USA). The
similar to that in previous NHANES.15 An individual’s              NHANES III BIA data were obtained with a Valhalla impe-
racial-ethnic status was self-identified.                           dance analyzer. However, all BIA resistance data reported
   The total NHANES III sample consisted of 31 311 exami-          in this manuscript are converted RJL Res values because
ned participants. Children younger than 12 y of age and            there are no prediction equations from large-scale studies
pregnant women were not eligible for the BIA procedure in          using Valhalla bioimpedance instruments. Before applying
NHANES III. There were also very few participants over 80 y        the TBW and FFM prediction equations to these data,
of age. After excluding 12 562 participants with ages < 12 y       the Valhalla Res value for each NHANES III subject
or > 80 y, 798 participants with race-ethnicity other than         was converted to an equivalent RJL Res value using equa-
non-Hispanic white, non-Hispanic black or Mexican                  tions developed from a separate, independent sample.
American and 2039 participants missing weight, stature             Details of this conversion process are presented in the
and=or BIA resistance, the available analytic sample con-          Appendix.
tained 15 912 participants. The developed BIA prediction
equations22 were applied to this sub-sample, but additional        Prediction equations. The TBW and FFM, BIA prediction
exclusions were made when predicted TBW exceeded 80% of            equations listed below22 were applied to the respective
body weight (n ¼ 1), or when the calculated TBF was                NHANES III anthropometric and converted BIA resistance
negative (n ¼ 8). These last exclusions resulted in a final         data for each selected NHANES III participant to derive
sample of 15 903 participants, 2880 non-Hispanic white             estimates for TBW and FFM. The converted NHANES III,
males, 3277 non-Hispanic white females, 2348 non-                  RJL resistance values were used to calculated the impedance

                                                                                                                 International Journal of Obesity
Body composition estimates from NHANES III
                                                                       WC Chumlea et al
1598
          index of stature squared divided by resistance (S2=Res) in the                  Estimated means for TBW, FFM, TBF, and %BF are shown in
          TBW and FFM prediction equations.                                               Tables 4 – 7 and Figures 1 – 4, and they are summarized in the
                                                                                          following text.
                   Males      TBW ¼ 1:203 þ 0:176 weight þ 0:449 S2 =Res
                              r 2 ¼ 0:84; RMSE ¼ 3:81
                Females       TBW ¼ 3:747 þ 0:113 weight þ 0:45 S2 =Res                   Anthropometry and BIA
                              r 2 ¼ 0:79; RMSE ¼ 2:61                                     The number of participants in NHANES III available to
                                                                                          construct the body composition distributions by age, sex
             Males      FFM ¼ À10:678 þ 0:262 weight þ 0:652 S2 =Res
                                                                                          and racial-ethnic groups are presented in Tables 1 – 3 along
                                   þ 0:015 Res   r 2 ¼ 0:90; RMSE ¼ 3:9 kg                with descriptive statistics for the measured and calculated
          Females       FFM ¼ À9:529 þ 0:168 weight þ 0:696 S2 =Res                       independent variables. As expected, across racial-ethnic
                                   þ 0:016 Res   r 2 ¼ 0:83; RMSE ¼ 2:9 kg                groups at ages ! 14 y, mean statures and weights were
                                                                                          larger for males than females. Within each race-ethnic
          Estimates for TBF and %BF for each NHANES III participant                       group for males and females, mean weights and BMIs
          were derived from their corresponding estimated FFM using                       increased almost consistently up to age 60 y and decreased
          the equations TBF ¼ weight 7 FFM and %BF ¼ TBF=weight.                          afterwards. The BMI means were larger among non-Hispanic
                                                                                          black and Mexican-American females than non-Hispanic
                                                                                          white females at almost all ages, but especially in the
          Statistical methods                                                             adults. Non-Hispanic black adult females had the largest
          Descriptive statistics including means, standard deviations                     mean BMI values. Among the adult males, the BMI means
          and standard errors for estimates of TBW, FFM, TBF and %BF                      were approximately equal to most ages.
          were calculated for defined age, sex and racial-ethnic groups.                      The females had larger mean estimates for Res than the
          The age groups were defined at 2 y intervals from 12 to 20 y                     males. Means estimates for S2=Res were larger for males than
          of age and at 10 y intervals thereafter. These means were also                  the females at all ages. This is consistent with an expected
          presented graphically with the values plotted at the middle                     greater fluid volume associated with a greater FFM among
          of each age group. The mean values for TBW, FFM, TBF and                        males.
          %BF were estimated using SAS25 and include the appropriate                         The Res means for non-Hispanic white females exceeded
          survey sampling weights to produce representative estimates                     those of non-Hispanic black females at all but one age group.
          for selected groups in the civilian, non-institutionalized                      The non-Hispanic white females also had larger Res means
          population of the US. The sample weights account for                            than the Mexican-American females at all but two of the
          sampling variability and adjust the data for differential                       younger age groups. There was no consistent pattern
          probability of selection of persons in the NHANES III com-                      between the non-Hispanic black and Mexican-American
          plex sample survey design.                                                      females in Res means as they varied by age groups. However,
                                                                                          mean estimates for S2=Res for non-Hispanic black females
          Variance estimation. The means presented in this report                         were consistently larger than those of non-Hispanic white
          are based on data collected from a complex sample design,                       females at all but one age group, and both these groups of
          and techniques that account for this design were used to                        females had mean estimates larger than those of Mexican-
          estimate the standard errors of these means (ie the square                      American females at all age groups.
          root of their variance). Variance estimates based on the                           The non-Hispanic black males had larger Res means than
          complex sample design are different from and generally                          the non-Hispanic white males at all ages, but Res means
          larger than those obtained under the assumption of simple                       varied between the non-Hispanic black and Mexican-
          random sampling. SUDAAN, a statistical software package                         American males by age groups. This variation by age
          that incorporates the sample weights and accounts for the                       groups also existed for mean Res values between the
          complex sample design through Taylor Series linearization                       non-Hispanic white and Mexican-American males. Mean
          was used to estimate the design effects.26 Details of the                       estimates for S2=Res for non-Hispanic white males were
          variance estimation process are found in the Appendix.                          consistently larger than those of non-Hispanic black males
                                                                                          at all but one age group, and both these groups of males had
                                                                                          larger mean estimates than those of Mexican-American
          Results                                                                         males at all age groups.
          Tests of statistical significance were not performed because
          the results for several of the variables are calculated esti-
          mates, and the objective of this paper was to present descrip-                  Comparative distributions of body compartments
          tive information only. A qualitative review of these findings                    Total body water and fat-free mass. As shown in Tables 4
          suggests that differences among the groups conform to                           and 5 and Figures 1 and 2, the means for TBW and FFM
          findings from other large and small-scale studies. Means for                     within racial-ethnic groups had similar patterns across age
          weight, stature, BMI, Res and S2=Res are shown in Tables 1 – 3.                 groups. Among males, the estimated TBW and FFM means

International Journal of Obesity
Body composition estimates from NHANES III
                                                                         WC Chumlea et al
                                                                                                                                                           1599
         Table 1 Selected anthropometric and impedance measures according to age and sex for non-Hispanic white people: NHANES III
         (Res and S2=Res computed with RJL-Valhalla conversion factor)

                                                        Non-Hispanic white males                       Non-Hispanic white females

         Age groups        Measurements           n        Mean         s.d.        s.e.         n          Mean        s.d.        s.e.

         12 – 13.9 y     Weight (kg)              88        51.7       12.3          1.5        101          52.1      13.3          1.6
                         Stature (cm)             88       159.6        8.4          0.9        101         157.8       8.2          1.0
                         BMI (kg=m2)              88        20.1        3.5          0.4        101          20.9       4.7          0.6
                         Res (ohms)               88       559.9       77.7         10.8        101         603.4      70.9         10.2
                          2         2
                         S =Res (cm =ohms)        88        46.8        9.9          1.3        101          41.9       6.6          1.0
         14 – 15.9 y     Weight (kg)              82        68.3       20.5          2.5        120          57.8      10.5          1.2
                         Stature (cm)             82       172.2        7.6          0.8        120         162.6       6.0          0.7
                                    2
                         BMI (kg=m )              82        23.0        6.3          0.8        120          21.9       3.8          0.4
                         Res (ohms)               82       494.2       60.1          8.7        120         616.1      75.0         10.0
                         S2=Res (cm2=ohms)        82        60.9        8.8          1.2        120          43.6       6.3          0.8
         16 – 17.9 y     Weight (kg)              96        70.9       13.8          1.6        104          61.1      14.5          1.7
                         Stature (cm)             96       177.0        7.9          0.8        104         164.5       6.6          0.8
                         BMI (kg=m2)              96        22.6        4.0          0.5        104          22.5       4.9          0.6
                         Res (ohms)               96       486.5       61.1          8.2        104         616.7      74.6         10.6
                          2         2
                         S =Res (cm =ohms)        96        65.4        9.4          1.2        104          44.6       6.3          0.9
         18 – 19.9 y     Weight (kg)              76        73.1       15.0          1.9         90          63.7      15.0          1.9
                         Stature (cm)             76       176.9        6.7          0.8         90         164.9       5.8          0.7
                                    2
                         BMI (kg=m )              76        23.3        4.2          0.6         90          23.4       5.5          0.7
                         Res (ohms)               76       489.5       52.7          7.9         90         592.0      70.9         10.8
                         S2=Res (cm2=ohms)        76        64.7        8.1          1.2         90          46.6       6.2          0.9
         20 – 29.9 y     Weight (kg)             384        79.2       16.6          0.9        426          63.2      14.3          0.8
                         Stature (cm)            384       177.5        6.7          0.3        426         163.6       6.7          0.4
                         BMI (kg=m2)             384        25.1        4.9          0.3        426          23.6       5.1          0.3
                         Res (ohms)              384       473.4       59.4          4.0        426         587.6      77.2          5.5
                          2         2
                         S =Res (cm =ohms)       384        67.7        9.9          0.6        426          46.4       7.1          0.5
         30 – 39.9 y     Weight (kg)             436        84.0       17.1          0.9        543          69.1      18.0          0.9
                         Stature (cm)            436       177.8        6.8          0.3        543         164.6       6.3          0.3
                                    2
                         BMI (kg=m )             436        26.5        4.6          0.3        543          25.5       6.5          0.3
                         Res (ohms)              436       463.8       60.4          3.8        543         567.2      74.1          4.7
                         S2=Res (cm2=ohms)       436        69.5       11.3          0.7        543          48.7       7.7          0.5
         40 – 49.9 y     Weight (kg)             410        86.0       17.0          0.9        454          70.7      16.8          1.0
                         Stature (cm)            410       177.3        6.7          0.3        454         163.4       6.1          0.3
                         BMI (kg=m2)             410        27.3        4.9          0.3        454          26.6       6.5          0.4
                         Res (ohms)              410       455.9       62.4          4.1        454         569.4      83.5          5.7
                          2         2
                         S =Res (cm =ohms)       410        70.4       11.5          0.7        454          48.0       7.9          0.5
         50 – 59.9 y     Weight (kg)             396        86.9       15.0          0.8        454          73.9      17.4          1.0
                         Stature (cm)            396       176.7        6.2          0.3        454         162.4       6.0          0.3
                                    2
                         BMI (kg=m )             396        27.8        4.6          0.3        454          28.0       6.4          0.4
                         Res (ohms)              396       453.6       60.7          4.0        454         559.0      80.5          5.5
                         S2=Res (cm2=ohms)       396        70.1        9.9          0.6        454          48.2       7.6          0.5
         60 – 69.9 y     Weight (kg)             465        84.9       14.7          0.8        447          70.3      15.1          0.9
                         Stature (cm)            465       175.3        6.3          0.3        447         160.8       6.1          0.4
                         BMI (kg=m2)             465        27.6        4.2          0.2        447          27.2       5.6          0.3
                         Res (ohms)              465       467.3       63.4          3.9        447         572.6      84.3          5.8
                          2         2
                         S =Res (cm =ohms)       465        67.0        9.9          0.6        447          46.2       7.6          0.5
         70 – 79.9 y     Weight (kg)             447        79.3       13.3          0.7        538          67.1      14.5          0.8
                         Stature (cm)            447       172.4        6.7          0.3        538         158.3       6.8          0.4
                                    2
                         BMI (kg=m )             447        26.7        4.0          0.2        538          26.7       5.3          0.3
                         Res (ohms)              447       470.8       62.6          3.9        538         567.9      82.1          5.2
                         S2=Res (cm2=ohms)       447        64.3        9.9          0.6        538          45.2       8.0          0.5


increased during adolescence in all racial-ethnic groups. A              13 to 19 y of age was not as pronounced as it was in males.
progressive, but lesser increase in the adult male age groups            Estimated means for TBW and FFM for females gradually
followed until about age 60 y, after which the estimated                 increased across age groups until age 45 – 55 y after which
means for TBW and FFM decreased. Females in all racial-                  they decreased for both.
ethnic groups had comparatively lower estimates for mean                    Among males, estimated TBW and FFM means were gene-
TBW and FFM than males. Among females, the increase from                 rally larger for non-Hispanic whites than non-Hispanic

                                                                                                                                International Journal of Obesity
Body composition estimates from NHANES III
                                                                      WC Chumlea et al
1600
                        Table 2 Selected anthropometric and impedance measures according to age and sex for non-Hispanic black people: NHANES III
                        (Res and S2=Res computed with RJL-Valhalla conversion factor)

                                                                           Non-Hispanic black males                Non-Hispanic black females

                        Age groups         Measurements             n          Mean        s.d.       s.e.    n        Mean         s.d.        s.e.

                        12 – 13.9 y      Weight (kg)               124          52.1       16.7       1.5    156        55.1       13.3          1.2
                                         Stature (cm)              124         157.9       10.1       1.0    156       159.6        7.3          0.7
                                         BMI (kg=m2)               124          20.7        5.2       0.5    156        21.5        4.4          0.4
                                         Res (ohms)                124         568.1       75.2       8.6    156       601.1       74.7          8.6
                                          2         2
                                         S =Res (cm =ohms)         124          45.2       10.2       1.1    156        43.1        6.3          0.7
                        14 – 15.9 y      Weight (kg)               131          64.4       15.4       1.4    102        62.0       16.3          1.8
                                         Stature (cm)              131         171.5        7.7       0.8    102       163.1        7.1          0.8
                                                    2
                                         BMI (kg=m )               131          21.8        4.7       0.4    102        23.2        5.3          0.6
                                         Res (ohms)                131         511.2       67.3       7.5    102       608.8       90.9         12.8
                                         S2=Res (cm2=ohms)         131          58.8       10.0       1.1    102        44.8        8.3          1.1
                        16 – 17.9 y      Weight (kg)               126          68.7       14.5       1.3    126        64.0       15.8          1.6
                                         Stature (cm)              126         173.8        7.2       0.7    126       163.9        7.0          0.7
                                         BMI (kg=m2)               126          22.7        4.1       0.4    126        23.8        5.7          0.6
                                         Res (ohms)                126         493.3       58.3       6.6    126       611.4       72.4          9.2
                                          2         2
                                         S =Res (cm =ohms)         126          62.3        9.9       1.1    126        44.6        6.3          0.8
                        18 – 19.9 y      Weight (kg)               118          74.7       16.4       1.5    110        65.8       18.6          2.0
                                         Stature (cm)              118         176.6        7.2       0.7    110       163.6        6.3          0.7
                                                    2
                                         BMI (kg=m )               118          23.8        4.4       0.4    110        24.6        6.7          0.8
                                         Res (ohms)                118         480.8       61.0       7.1    110       610.9       91.2         12.4
                                         S2=Res (cm2=ohms)         118          66.2       11.0       1.2    110        44.9        8.2          1.1
                        20 – 29.9 y      Weight (kg)               462          82.9       20.5       1.0    510        70.4       16.7          0.8
                                         Stature (cm)              462         177.1        7.4       0.4    510       163.7        6.1          0.3
                                         BMI (kg=m2)               462          26.3        5.8       0.3    510        26.2        6.0          0.3
                                         Res (ohms)                462         474.4       63.7       3.8    510       582.5       80.6          5.1
                                          2         2
                                         S =Res (cm =ohms)         462          67.5       11.3       0.7    510        47.0        7.5          0.5
                        30 – 39.9 y      Weight (kg)               454          82.9       17.9       0.9    569        76.7       20.2          1.0
                                         Stature (cm)              454         177.2        6.6       0.3    569       163.7        6.7          0.3
                                                    2
                                         BMI (kg=m )               454          26.4        5.4       0.3    569        28.6        7.4          0.4
                                         Res (ohms)                454         470.4       68.0       4.1    569       561.1       81.4          4.9
                                         S2=Res (cm2=ohms)         454          68.3       11.4       0.7    569        48.9        8.6          0.5
                        40 – 49.9 y      Weight (kg)               339          83.6       17.2       1.0    395        81.5       21.1          1.2
                                         Stature (cm)              339         176.5        7.3       0.4    395       164.2        6.1          0.4
                                         BMI (kg=m2)               339          26.8        4.8       0.3    395        30.2        7.4          0.4
                                         Res (ohms)                339         472.6       63.6       4.4    395       544.8       85.8          6.2
                                          2         2
                                         S =Res (cm =ohms)         339          67.3       11.0       0.7    395        50.7        8.6          0.6
                        50 – 59.9 y      Weight (kg)               191          83.7       19.4       1.4    231        80.7       19.4          1.5
                                         Stature (cm)              191         175.2        6.6       0.5    231       162.5        5.8          0.5
                                                    2
                                         BMI (kg=m )               191          27.2        5.7       0.4    231        30.6        7.1          0.6
                                         Res (ohms)                191         472.8       77.5       7.1    231       547.8       92.7          8.7
                                         S2=Res (cm2=ohms)         191          66.8       12.4       1.1    231        49.6        8.7          0.8
                        60 – 69.9 y      Weight (kg)               258          80.9       16.2       1.0    258        77.6       18.3          1.3
                                         Stature (cm)              258         173.6        6.6       0.5    258       161.1        6.3          0.5
                                         BMI (kg=m2)               258          26.8        4.9       0.3    258        29.9        7.0          0.5
                                         Res (ohms)                258         476.3       78.8       6.3    258       557.7       94.3          8.4
                                          2         2
                                         S =Res (cm =ohms)         258          65.1       11.9       0.9    258        47.8        8.4          0.7
                        70 – 79.9 y      Weight (kg)               145          77.0       15.5       1.3    149        74.0       16.5          1.5
                                         Stature (cm)              145         171.6        7.1       0.7    149       159.4        5.7          0.6
                                                    2
                                         BMI (kg=m )               145          26.2        4.8       0.4    149        29.1        6.3          0.6
                                         Res (ohms)                145         477.8       74.6       7.9    149       551.0       89.9         10.5
                                         S2=Res (cm2=ohms)         145          63.2       11.4       1.2    149        47.4        8.4          0.9


          blacks and then Mexican-Americans (Figures 1 and 2). For                          with the means for non-Hispanic white and Mexican-
          females, estimated mean TBW and FFM values were larger for                        American males (Figures 1 and 2).
          non-Hispanic blacks than non-Hispanic whites and then                                The standard deviations at all the age groups for TBW were
          Mexican-Americans. The TBW and FFM means for non-                                 $6 – 7 l for non-Hispanic white and Mexican-American males
          Hispanic black males declined at an earlier age compared                          and $7 – 8 l for non-Hispanic black males. For the females,

International Journal of Obesity
Body composition estimates from NHANES III
                                                                       WC Chumlea et al
                                                                                                                                                           1601
         Table 3 Selected anthropometric and impedance measures according to age and sex for Mexican-American people: NHANES III
         (Res and S2=Res computed with RJL-Valhalla conversion factor)

                                                        Mexican-American males                       Mexican-American females

         Age groups        Measurements           n        Mean        s.d.       s.e.         n         Mean        s.d.         s.e.

         12 – 13.9 y     Weight (kg)             132        52.7       14.1       1.5        139          53.3      12.3           1.2
                         Stature (cm)            132       156.0        9.2       0.9        139         155.4       6.5           0.7
                         BMI (kg=m2)             132        21.4        4.6       0.5        139          21.9       4.5           0.5
                         Res (ohms)              132       568.4       73.2       9.2        139         608.6      78.9           9.5
                          2         2
                         S =Res (cm =ohms)       132        44.0        9.3       1.1        139          40.5       6.5           0.8
         14 – 15.9 y     Weight (kg)             108        62.5       16.6       1.9        113          56.2      10.7           1.2
                         Stature (cm)            108       167.2        8.5       0.9        113         157.7       6.0           0.7
                                    2
                         BMI (kg=m )             108        22.2        5.1       0.6        113          22.5       3.7           0.4
                         Res (ohms)              108       510.5       61.2       8.5        113         631.4      68.8           9.2
                         S2=Res (cm2=ohms)       108        55.9        9.8       1.3        113          40.0       5.9           0.8
         16 – 17.9 y     Weight (kg)             126        67.9       12.2       1.3        112          62.2      15.5           1.7
                         Stature (cm)            126       170.5        6.7       0.7        112         159.3       5.8           0.7
                         BMI (kg=m2)             126        23.3        3.7       0.4        112          24.5       5.7           0.7
                         Res (ohms)              126       501.0       58.7       7.6        112         600.2      79.8          10.7
                          2         2
                         S =Res (cm =ohms)       126        58.9        8.2       1.0        112          43.1       6.8           0.9
         18 – 19.9 y     Weight (kg)             109        72.8       13.9       1.6          90         59.6      13.1           1.6
                         Stature (cm)            109       171.9        6.3       0.7          90        157.7       5.7           0.7
                                    2
                         BMI (kg=m )             109        24.6        4.4       0.5          90         23.9       4.9           0.6
                         Res (ohms)              109       491.2       63.0       8.7          90        614.3      67.8          10.1
                         S2=Res (cm2=ohms)       109        61.2        8.6       1.2          90         41.0       5.5           0.8
         20 – 29.9 y     Weight (kg)             631        73.9       13.9       0.7        509          64.8      14.5           0.8
                         Stature (cm)            631       170.0        6.4       0.3        509         157.6       6.2           0.3
                         BMI (kg=m2)             631        25.6        4.2       0.2        509          26.1       5.5           0.3
                         Res (ohms)              631       480.0       59.9       3.5        509         586.4      79.6           5.1
                          2         2
                         S =Res (cm =ohms)       631        61.0        9.1       0.5        509          43.1       6.6           0.4
         30 – 39.9 y     Weight (kg)             443        78.4       14.2       0.8        451          70.6      17.1           1.0
                         Stature (cm)            443       170.6        7.0       0.4        451         156.9       6.3           0.4
                                    2
                         BMI (kg=m )             443        26.9        4.3       0.2        451          28.6       6.4           0.4
                         Res (ohms)              443       469.7       59.8       4.1        451         554.1      76.4           5.2
                         S2=Res (cm2=ohms)       443        63.1        9.9       0.7        451          45.3       7.2           0.5
         40 – 49.9 y     Weight (kg)             361        82.0       14.5       0.9        334          73.4      13.9           0.9
                         Stature (cm)            361       169.7        6.3       0.4        334         157.2       5.4           0.4
                         BMI (kg=m2)             361        28.4        4.4       0.3        334          29.7       5.6           0.4
                         Res (ohms)              361       453.0       58.5       4.5        334         549.1      75.6           5.9
                          2         2
                         S =Res (cm =ohms)       361        64.7        9.8       0.7        334          45.8       6.6           0.5
         50 – 59.9 y     Weight (kg)             165        82.6       15.1       1.4        171          71.3      13.7           1.2
                         Stature (cm)            165       169.3        6.0       0.5        171         155.7       5.4           0.5
                                    2
                         BMI (kg=m )             165        28.7        4.5       0.4        171          29.5       5.5           0.5
                         Res (ohms)              165       449.3       62.7       7.1        171         549.0      81.0           8.8
                         S2=Res (cm2=ohms)       165        65.1       10.7       1.2        171          45.1       7.0           0.7
         60 – 69.9 y     Weight (kg)             301        78.2       12.7       0.9        278          70.0      14.1           1.0
                         Stature (cm)            301       168.3        6.0       0.4        278         154.3       5.9           0.4
                         BMI (kg=m2)             301        27.6        4.0       0.3        278          29.5       5.9           0.4
                         Res (ohms)              301       469.3       63.9       5.4        278         548.1      78.5           6.7
                          2         2
                         S =Res (cm =ohms)       301        61.5        9.1       0.7        278          44.4       7.3           0.6
         70 – 79.9 y     Weight (kg)             118        72.3       12.5       1.4        101          65.0      13.0           1.5
                         Stature (cm)            118       165.5        5.7       0.6        101         153.0       5.9           0.7
                                    2
                         BMI (kg=m )             118        26.3        4.0       0.4        101          27.8       5.5           0.7
                         Res (ohms)              118       486.1       68.8       9.1        101         568.8      80.2          11.4
                         S2=Res (cm2=ohms)       118        57.6        9.6       1.2        101          42.1       7.1           1.0


the standard deviations were $4 – 5 l for non-Hispanic white           deviations at all the age groups for FFM were $9 – 10 kg for
and Mexican-American females and $5 – 6 l for non-                     non-Hispanic white males, $8 – 9 kg for Mexican-American
Hispanic black females. This same pattern of larger standard           males and $9 – 11 kg for non-Hispanic black males. For the
deviations in non-Hispanic blacks also occurred for FFM, but           females, the standard deviations were $5 – 6 kg for non-
here the standard deviations for non-Hispanic whites were              Hispanic white females $5 – 6 kg for Mexican-American
larger than those of the Mexican-Americans. The standard               females and $5 – 8 kg for non-Hispanic black females.

                                                                                                                                International Journal of Obesity
Body composition estimates from NHANES III
                                                                         WC Chumlea et al
1602
                          Table 4     Total body water (l) according to age, sex and ethnicity: NHANES III

                                                    Non-Hispanic white                       Non-Hispanic black                   Mexican-American

                          Age (y)            Mean           s.d.         s.e.         Mean           s.d.         s.e.    Mean           s.d.        s.e.

                          Males
                          12 – 13.9          31.3            6.3         0.8          30.7           7.0          0.7     30.2           6.2         0.7
                          14 – 15.9          40.6            7.0         0.9          38.9           6.7          0.7     37.2           6.9         0.9
                          16 – 17.9          43.1            6.2         0.8          41.2           6.6          0.7     39.6           5.5         0.6
                          18 – 19.9          43.2            5.8         0.8          44.1           7.5          0.8     41.5           5.9         0.7
                          20 – 29.9          45.5            6.9         0.4          46.1           8.0          0.4     41.6           6.1         0.3
                          30 – 39.9          47.2            7.6         0.4          46.5           7.7          0.4     43.4           6.5         0.4
                          40 – 49.9          48.0            7.8         0.5          46.1           7.5          0.5     44.7           6.6         0.5
                          50 – 59.9          47.9            6.5         0.4          45.9           8.5          0.7     45.0           7.1         0.7
                          60 – 69.9          46.2            6.6         0.4          44.7           7.7          0.5     42.6           5.9         0.4
                          70 – 79.9          44.0            6.4         0.4          43.2           7.4          0.7     39.9           6.3         0.7

                          Females
                          12 – 13.9          28.5            4.2         0.6          29.3           4.1          0.4      27.9          4.2         0.5
                          14 – 15.9          29.9            3.7         0.5          30.9           5.3          0.7      28.1          3.7         0.4
                          16 – 17.9          30.7            4.0         0.5          31.0           4.2          0.5      30.2          4.5         0.6
                          18 – 19.9          31.9            4.2         0.6          31.4           5.5          0.7     28..9          3.7         0.5
                          20 – 29.9          31.8            4.5         0.3          32.8           4.9          0.3      30.5          4.3         0.2
                          30 – 39.9          33.5            5.1         0.3          34.4           5.8          0.3      32.2          4.8         0.3
                          40 – 49.9          33.3            5.2         0.3          35.8           6.0          0.4      32.6          4.3         0.3
                          50 – 59.9          33.8            5.1         0.3          35.2           5.8          0.5      32.1          4.4         0.4
                          60 – 69.9          32.5            4.8         0.3          34.0           5.6          0.4      31.6          4.6         0.4
                          70 – 79.9          31.6            4.9         0.3          33.4           5.3          0.6      30.1          4.4         0.6


          Total body fat and percentage body fat. As presented in                               followed by Mexican-American and then non-Hispanic
          Tables 6 and 7 and Figures 3 and 4, females had larger                                white females. Plots of these TBF means by sex, race and
          estimated TBF and %BF means than males at all ages.                                   the selected age groups are presented in Figure 3. Between 13
          Across racial-ethnic groups, TBF means for males did not                              and 19 y of age, Mexican-American males tended to have
          shown any appreciable differences. In contrast, estimates for                         larger TBF means than non-Hispanic white and black males,
          TBF means were largest for non-Hispanic black females,                                after which these differences were small except for 25 y of age.


                         Table 5 Fat-free mass (kg) according to age, sex and ethnicity: NHANES III

                                                    Non-Hispanic white                       Non-Hispanic black                   Mexican-American

                         Age (y)            Mean            s.d.         s.e.         Mean           s.d.          s.e.   Mean            s.d.        s.e.

                         Males
                         12 – 13.9          41.8             8.2         1.0          40.9            9.3          0.9     40.3           8.2         0.9
                         14 – 15.9          54.3             9.6         1.2          52.2            9.0          0.9     49.8           9.3         1.2
                         16 – 17.9          57.8             8.4         1.0          55.3            8.9          0.9     53.0           7.5         0.9
                         18 – 19.9          58.0             8.0         1.1          59.2           10.2          1.0     55.7           8.0         1.0
                         20 – 29.9          61.3             9.5         0.6          62.2           11.1          0.6     55.7           8.3         0.4
                         30 – 39.9          63.6            10.5         0.6          62.6           10.5          0.5     58.1           8.9         0.5
                         40 – 49.9          64.6            10.6         0.6          62.2           10.3          0.6     59.8           8.9         0.6
                         50 – 59.9          64.6             8.8         0.5          61.9           11.5          0.9     60.2           9.6         1.0
                         60 – 69.9          62.3             8.9         0.5          60.1           10.3          0.7     57.0           7.9         0.6
                         70 – 79.9          59.1             8.6         0.5          58.0           10.0          0.9     53.1           8.3         1.0

                         Females
                         12 – 13.9          38.1             5.6         0.7          39.3            5.5          0.5     37.3           5.3         0.6
                         14 – 15.9          40.4             4.8         0.6          41.8            7.0          0.9     37.8           4.8         0.6
                         16 – 17.9          41.6             5.5         0.7          42.0            5.6          0.6     40.5           6.0         0.7
                         18 – 19.9          43.1             5.6         0.8          42.6            7.1          0.8     38.8           4.9         0.7
                         20 – 29.9          42.8             5.9         0.4          44.3            6.5          0.4     40.8           5.6         0.3
                         30 – 39.9          45.0             6.9         0.4          46.4            7.8          0.4     42.8           6.4         0.4
                         40 – 49.9          44.8             6.9         0.4          48.2            7.9          0.5     43.5           5.5         0.4
                         50 – 59.9          45.4             6.7         0.4          47.3            7.6          0.6     42.6           5.8         0.6
                         60 – 69.9          43.6             6.3         0.4          45.7            7.3          0.6     41.9           6.0         0.5
                         70 – 79.9          42.3             6.5         0.4          44.7            6.8          0.7     39.8           5.6         0.7


International Journal of Obesity
Body composition estimates from NHANES III
                                                                            WC Chumlea et al
                                                                                                                                                                 1603
          Table 6 Total body fat (kg) according to age, sex and ethnicity: NHANES III

                                  Non-Hispanic white                     Non-Hispanic black                        Mexican-American

          Age (y)         Mean            s.d.          s.e.     Mean            s.d.         s.e.         Mean            s.d.          s.e.

          Males
          12 – 13.9        10.0            6.0          0.7      11.2            9.1          0.9           12.3            7.5          0.8
          14 – 15.9        14.0           12.2          1.6      12.2            8.4          0.9           12.6            8.9          1.1
          16 – 17.9        13.1            7.5          0.9      13.4            7.3          0.8           14.9            6.1          0.7
          18 – 19.9        15.1            8.5          1.1      15.5            7.9          0.8           17.1            7.2          0.9
          20 – 29.9        17.9            8.7          0.5      20.7           11.4          0.6           18.3            7.3          0.4
          30 – 39.9        20.4            8.5          0.5      20.3            9.5          0.5           20.3            7.1          0.4
          40 – 49.9        21.3            8.5          0.5      21.4            8.7          0.6           22.2            7.3          0.5
          50 – 59.9        22.3            8.3          0.5      21.8            9.7          0.8           22.4            7.1          0.7
          60 – 69.9        22.7            7.7          0.4      20.7            8.3          0.6           21.2            6.7          0.5
          70 – 79.9        20.3            6.8          0.4      19.3            7.7          0.7           19.2            5.8          0.7

          Females
          12 – 13.9        14.0            8.7          1.0      15.8            8.7          0.8           16.0           7.6           0.8
          14 – 15.9        17.4            6.9          0.8      20.2           10.1          1.1           18.4           6.9           0.8
          16 – 17.9        19.5           10.1          1.2      22.0           11.4          1.1           21.6          10.3           1.2
          18 – 19.9        20.6           10.3          1.3      23.2           12.6          1.3           20.7           8.9           1.1
          20 – 29.9        20.5            9.6          0.6      26.0           11.3          0.6           24.1           9.8           0.5
          30 – 39.9        24.1           12.3          0.6      30.4           13.5          0.6           27.8          11.5           0.6
          40 – 49.9        25.9           10.9          0.6      33.3           14.1          0.8           29.9           9.4           0.6
          50 – 59.9        28.6           11.6          0.7      33.4           12.9          1.0           28.7           9.0           0.8
          60 – 69.9        26.7            9.9          0.6      31.9           12.1          0.8           28.1           9.3           0.7
          70 – 79.9        24.8            9.3          0.5      29.3           10.8          1.0           25.2           8.8           1.0


Non-Hispanic black females had larger TBF means than                        consistently for all males and females with each older age
Mexican-American and non-Hispanic white females at                          category until about 55 – 65 y of age. Afterwards, there was a
almost all ages, and this difference was greater after 25 y of              consistent decline in TBF means in both sexes.
age. At the same time, Mexican-American females also had                       Estimates for mean %BF were slightly larger for Mexican-
larger TBF means than non-Hispanic white females at most                    American males than for non-Hispanic white or non-
ages. In the plots for all age groups, mean TBF increased                   Hispanic black males where estimates for mean %BF were


           Table 7 Percentage body fat according to age, sex and ethnicity: NHANES III

                                   Non-Hispanic white                    Non-Hispanic black                        Mexican-American

           Age (y)          Mean           s.d.         s.e.     Mean            s.d.         s.e.         Mean           s.d.         s.e.

           Males
           12 – 13.9        18.4           7.3          1.0       19.5           8.9          1.1          22.0           8.2          1.0
           14 – 15.9        18.4           8.3          1.2       17.8           7.5          9.0          18.8           7.7          1.1
           16 – 17.9        17.7           6.8          0.9       18.6           6.4          0.8          21.3           5.4          0.7
           18 – 19.9        19.6           6.9          1.0       19.9           6.0          0.8          22.7           5.7          0.8
           20 – 29.9        21.8           6.2          0.4       23.7           7.0          0.4          24.1           6.0          0.4
           30 – 39.9        23.6           5.8          0.4       23.6           6.7          0.4          25.4           5.4          0.4
           40 – 49.9        24.2           5.7          0.4       24.9           6.1          0.5          26.6           5.3          0.4
           50 – 59.9        25.1           6.0          0.4       25.1           6.7          0.7          26.7           5.3          0.6
           60 – 69.9        26.2           5.5          0.3       24.9           6.6          0.6          26.7           5.2          0.4
           70 – 79.9        25.1           5.5          0.3       24.3           6.3          0.7          26.1           5.2          0.7

           Females
           12 – 13.9        24.8           9.7          1.2       26.9           8.8          0.8          28.6           7.6          0.8
           14 – 15.9        29.1           6.5          0.8       30.9           8.0          0.9          31.8           6.3          0.7
           16 – 17.9        30.7           6.9          0.9       32.6           8.5          0.9          33.3           7.1          0.8
           18 – 19.9        30.8           7.9          1.0       33.3           8.7          1.0          33.5           6.8          0.9
           20 – 29.9        31.0           7.5          0.5       35.5           7.5          0.4          35.8           7.0          0.4
           30 – 39.9        33.0           8.5          0.5       38.0           7.7          0.4          38.0           7.1          0.4
           40 – 49.9        35.4           6.9          0.4       39.4           7.0          0.4          39.9           5.5          0.4
           50 – 59.9        37.3           7.1          0.4       40.0           7.5          0.6          39.4           5.7          0.5
           60 – 69.9        36.9           6.9          0.4       39.8           6.9          0.5          39.4           5.7          0.4
           70 – 79.9        35.9           6.9          0.4       38.5           6.7          0.6          37.8           6.8          0.8


                                                                                                                                      International Journal of Obesity
Body composition estimates from NHANES III
                                                                  WC Chumlea et al
1604


                                                                                     Figure 2 Estimated means for fat-free mass (FFM) by 2 y age groups
                                                                                     from 12 to 20 y and by 10 y age groups from 20 to 80 y for non-Hispanic
          Figure 1 Estimated means for total body water (TBW) by 2 y age             white (W), non-Hispanic black (B) and Mexican-American (M) males and
          groups from 12 to 20 y and by 10 y age groups from 20 to 80 y for          females.
          non-Hispanic white (W), non-Hispanic black (B) and Mexican-American
          (M) males and females.


                                                                                     Between 13 and 19 y of age, Mexican-American females had
          quite similar across age groups. However, estimated %BF                    larger %BF means than non-Hispanic black and white
          means were noticeably similar across adult ages for non-                   females and non-Hispanic black females had larger means
          Hispanic black and Mexican-American females. Non-Hispa-                    than non-Hispanic white females. After the 19 y age group,
          nic whites had the lowest estimated %BF means at all ages.                 there were small differences in %BF means between
          Plots of these %BF means by sex, race and the selected age                 Mexican-American and non-Hispanic black females, both
          groups are presented in Figure 4. The %BF means reflect to                  of which were larger than the %BF means for non-Hispanic
          some degree the sex, ethnic and age patterns for TBF.                      white females. For all race groups, mean %BF increases with
          These sex differences were greatest for non-Hispanic blacks                each older age category until about 55 – 65 y of age. After-
          then Mexican-Americans and non-Hispanic whites. At the                     wards, %BF means declined, but this decline was not as steep
          25 y age category, the mean %BF for males was about                        as it was for TBF means at the same ages. The exception was
          21 – 23%, but in females the means were 30 – 35%. At the                   for males between 13 and 19 y where %BF means decreased
          13 y age group, girls were on average as fat as males would                and then increased for Mexican-Americans or remained
          ever get.                                                                  approximately stable for non-Hispanic white and black
             Between 13 and 19 y of age, Mexican-American males had                  males. Between the 13 and 55 y age groups, mean %BF for
          larger %BF means than non-Hispanic white and black males                   males increased about 5 – 7 percentage points, while in
          at all ages. At most other ages, there were small differences              females the corresponding increase was about 11 – 13
          between non-Hispanic black and white males in %BF means.                   percentage points.

International Journal of Obesity
Body composition estimates from NHANES III
                                                                          WC Chumlea et al
                                                                                                                                                       1605


Figure 3 Estimated means for total body fat (TBF) by 2 y age groups       Figure 4 Estimated means for percentage body fat (%BF) by 2 y age
from 12 to 20 y and by 10 y age groups from 20 to 80 y for non-Hispanic   groups from 12 to 20 y and 10 y age groups from 20 to 80 y for non-
white (W), non-Hispanic black (B) and Mexican-American (M) males and      Hispanic white (W), non-Hispanic black (B) and Mexican-American (M)
females.                                                                  males and females.


                                                                          Discussion
   Standard deviations for TBF were $6 – 8 kg for non-                    The application of the selected equations22 to the NHANES
Hispanic white males, $5 – 6 kg for Mexican-American                      III BIA data presents for the first time estimates of national
males and $7 – 9 kg for non-Hispanic black males. For the                 distributions for TBW, FFM, TBF and %BF for non-Hispanic
females, the standard deviations were $8 – 11 kg for non-                 whites and blacks and Mexican-Americans from 12 to 80 y of
Hispanic white females, $8 – 10 kg for Mexican-American                   age. The selected equations are the most accurate and precise
females and $10 – 14 kg for non-Hispanic black females.                   available for predicting TBW and FFM, and they are reason-
This same pattern of larger standard deviations in non-                   ably generalizable for individuals with body composition
Hispanic blacks again occurred for %BF, but here the                      values at the extremes of the distribution.22
standard deviations for non-Hispanic whites were larger                       The patterns of the means for TBW, FFM, TBF and %BF
than those of the Mexican-Americans. The standard                         across the age groups reflect expected associations with age
deviations at all the age groups for %BF were $5 – 7% for                 and sex. These patterns with age demonstrate sex differences
non-Hispanic white males, $5 – 6% for Mexican-American                    in the growth of these body constituents or the changes that
males and $6 – 7% for non-Hispanic black males. For the                   occur during adulthood with the aging process. The large
females, the standard deviations were $7 – 8% for non-                    means for TBF and %BF reflect the high prevalence of obesity
Hispanic white females $5 – 7% for Mexican-American                       that has been reported previously using the NHANES III BMI
females and $7 – 8% for non-Hispanic black females.                       data.1,2

                                                                                                                            International Journal of Obesity
Body composition estimates from NHANES III
                                                                  WC Chumlea et al
1606
          Body composition distributions                                             females compared with non-Hispanic white females. The
          Similar to other reports, males in this study generally have a             TBF and %BF means from NHANES III data are consistent
          larger estimated mean TBW and FFM than females, who have                   with the previously reported high prevalence of overweight1,2
          larger estimated TBF and %BF means than males.27,28 The                    and shifts in the BMI distribution observed between NHANES
          estimated means values from ages 12 – 20 y demonstrate the                 II and NHANES III.38 However, it is not appropriate to deter-
          sex and age relationships with body composition that occur                 mine the prevalence of obesity from these mean estimates for
          during adolescent growth.29 Mean TBF increases during                      TBF and %BF in the absence of definite cut-off criteria.37
          adolescence, but the effects of the relatively greater accretion               These mean reference values are not an indication of an
          of FFM in males than females result in a decline in estimated              ideal or desirable level of FFM, TBW, TBF or %BF, and should
          mean %BF for males around 14 – 16 y of age. Mean TBF                       be used cautiously as comparative reference data. The mean
          increases through adulthood. There is also an increase in                  BMI for adult men (BMI ¼ 26.6) and women (BMI ¼ 26.5)1
          mean FFM through much of adulthood but a decline is                        currently exceeds the recommended BMI threshold for
          observed at the oldest age groups.30 These are not serial                  healthy weight (BMI < 25.0).39 Similarly, the mean %BF for
          data, so the contrast between means at adjacent age groups                 adult men and women exceeds the threshold of %BF values
          may reflect actual trends in the changes in these body                      that indicate obesity at a BMI > 30.0 in men (%BF > 25%)
          composition estimates or, alternatively, differences between               and women (%BF > 39%),37 beginning at age 50 – 59 y in
          the samples comprising the several age groups.                             non-Hispanic white and black men, at age 30 – 39 y in
             Overall, the racial-ethnic differences between non-                     Mexican-American men and at age 40 – 49 y in non-Hispanic
          Hispanic white and non-Hispanic black females conform to                   black and Mexican-American women. The highest mean
          previously reported differences for smaller samples. Non-                  estimate for %BF in non-Hispanic white women was 37.3%
          Hispanic black females had slightly larger mean values for                 at ages 50 – 59 y.
          TBW, FFM, TBF and=or %BF than non-Hispanic white                               One new aspect of these data is the availability of TBW
          females,9,28,31 – 34 even though the prediction equations                  means. Prior to the present investigation, only small sets of
          tended to under-estimate TBW and FFM in non-Hispanic                       TBW reference data were available31 and most of these
          blacks.22 Similar comparisons with Mexican-American                        databases have limited application to the general US popula-
          females are very limited.28,34 Reported ethnic differences in              tion. These TBW means provide a general reference for the
          body composition between non-Hispanic white and non-                       US population by sex, age and race-ethnicity at the time the
          Hispanic black adult males differ from the present findings.                NHANES III was conducted (1988 – 1994).
          Others report that non-Hispanic black males have larger                        The FFM means provide a limited reference to assist in
          amounts of TBW than non-Hispanic white males.31,35                         determining the degree of sarcopenia or muscle loss among
          Similar differences in FFM or its equivalent between non-                  the elderly.10 Low muscle mass is a major contributor to the
          Hispanic whites and non-Hispanic blacks have been reported                 loss of functional ability and health.40 One limitation in
          by Ellis,28,34 but several other investigators have not found              defining or in establishing a diagnosis of sarcopenia has been
          such differences to be statistically significant.9,36 Comparisons           the absence of a sex-, age- and racial-ethnic-specific FFM
          with Mexican-American males have been few.28,34 Except for                 reference.10 The present findings provide national estimates
          possible differences in bone mineral, racial-ethnic differ-                as a reference to compare with results from other studies of
          ences in these means for TBW, FFM, and TBF at an age or                    body composition, particularly FFM, in the elderly and
          across age are not clear at a population level. A reason for this          persons with weight-related chronic disease.
          lack of clarity is insufficient body composition data from any
          racial-ethnic group other than non-Hispanic whites.
             The present body composition estimates were derived                     Study limitations
          from prediction equations, and they are subject to estima-                 These reported body composition estimates are not based
          tion errors. Comparisons of these findings across racial-                   on criterion measures. The mean estimates were calculated
          ethnic groups should be judged accordingly. The standard                   from predicted values from the bioelectrical impedance Res
          deviations for the means for TBW, FFM, TBF and %BF                         values and stature in NHANES III. The Valhalla Res values
          approximate the normal range for these variables in the                    were translated into their RJL equivalents (see Appendix),
          population. This range is reasonably constant from one age                 and then TBW and FFM were predicted through regression
          group to the next within racial-ethnic groups. However, the                equations. In the conversion sample, there was a very small
          standard deviations reported are calculated for estimated not              consistent difference between RJL and Valhalla Res mea-
          measured values and therefore may underestimate the true                   sures of 2.5 ohms for males and 9.6 ohms for females
          variability in the data.                                                   (Appendix, Figure 1). The high r2 values for these conver-
                                                                                     sions are identical to previously reported correlations for
                                                                                     Res between Valhalla and RJL impedance analyzers.44
          Body composition changes in the population                                 Others have reported larger systematic differences between
          One observation from these mean distributions is the high level            Valhalla and RJL analyzers for Res values45 than were noted
          of %BF among non-Hispanic black and Mexican-American                       in the present conversions. However, the present systematic

International Journal of Obesity
Body composition estimates from NHANES III
                                                                  WC Chumlea et al
                                                                                                                                           1607
differences in Res between Valhalla and RJL impedance             values compared with the mean estimates presented in this
analyzers for males and females are less than the reported        report.
variation in repeated measures of Res using a single impe-           The findings in this report conform to the many existing
dance machine.46 – 48                                             relationships of body composition with age and sex. What is
    In the prediction equations, TBW was estimated from           new, is the availability of these mean estimates for TBW,
isotope dilution, and FFM was estimated with a multi-             FFM, TBF and %BF along with their corresponding distribu-
compartment model based on densitometry, TBW and                  tions at specific age categories and the availability of these
bone mineral content from dual-energy X-ray absorptiome-          data for the three racial-ethnic groups in the NHANES III.
try using pooled data from large convenience samples from         These means and standard deviations provide a picture of
multiple study centers.22 TBF and %BF were then estimated         specific aspects of body composition that could only be
from FFM and weight. In each of these steps, validity errors      inferred from the NHANES III BMI data. The newest informa-
can be potentially introduced.                                    tion from the present analysis is the estimates for mean TBW,
    The reported mean body composition values are estimates       FFM, TBF and %BF for Mexican-American males and females.
about which there is variation as a function of the several       These limited data have not been available in the past.
methods and samples used. The magnitude of this variation            Measured values for TBW, FFM, TBF and %BF determined
is difficult to quantify, but is assumed to be equivalent to the   by DXA, hydrostatic weighing, or data collected using other
pure errors from the cross validation of the prediction           reference body composition methods in other studies can be
equations.22 Pure errors for the TBW and FFM equations are        compared with the means reported for the NHANES III
$4 l or kg for males and $3 l or kg for females. Cross-           sample. Systematic differences among body composition
validation results indicated that the equations applied in        methods and the between-method limits of agreement are
this study slightly over-predict TBW by $0.7 and 0.6 l and        approximately 2.0 kg for FFM and 3 – 5% for %BF,27,42 and
FFM by $0.3 and 0.6 kg for males and females, respectively.       should be considered when interpreting the data or making
The equations used to predict TBW tend to underestimate           inferences.
TBW in black males ($2 l) and females ($1.4 l) and over-             This study presents descriptive summary distributions for
estimate TBW in white males ($0.5 l) and females ($0.3 l).        body composition estimates derived from the 1988 – 1994
The FFM equations tend to underestimate FFM in black              NHANES III. In the future, improved estimates of FFM and
males ($2.1 kg) and females ($1.6 kg) and overestimate            TBF may become available. The present descriptive data
FFM in white males ($0.4 kg) and females ($0.3 kg). These         should be regarded as interim results and should be applied
estimates may be acceptable for comparisons within racial-        and referenced with an awareness of the identified potential
ethnic groups, but should be used cautiously in comparisons       caveats.
across racial-ethnic groups.
    There are other possible limitations. BIA prediction equa-
tions have limitations similar to those of skinfold prediction    Acknowledgement
equations including large standard errors of the estimates        We gratefully acknowledge Katalin Losonczy and Margaret
and population specificity.41 The BIA prediction equations         Carroll for their computer programming to calculate the
were applied to Mexican-American participants in NHANES           reported means and complex sample variance estimates.
III but were neither derived nor validated independently on       Supported by funding from the Centers for Disease Control
samples of Mexican-Americans so the validity of these equa-       and Prevention, the US Army Medical Research and Materiel
tions for this group is unknown. There were also a few non-       Command, the Nutritional Services Branch, the National
Hispanic blacks available in the samples used to develop the      Institute of Diabetes and Digestive and Kidney Diseases
prediction equations resulting in potential bias for estimates    and grants HD-27063, HD-12252 and HL-53404 from the
among this group. Also, the performance of the prediction         National Institutes of Health. Mention of a trademark or
equations when applied to the NHANES III data could not be        proprietary product does not constitute a guarantee of war-
independently verified.                                            ranty of the product by the United States Department of
                                                                  Agriculture and does not imply its approval to the exclusion
                                                                  of other products that may also be suitable. US Department
Conclusion                                                        of Agriculture, Agricultural Research Service, Northern
These mean body composition estimates (Tables 4 – 7 and           Plains Area is an equal opportunity=affirmative action
Figures 1 – 4) are the first provided for the US population.       employer and all agency services are available without
NHANES III did not have criterion body composition mea-           discrimination.
sures, but the availability of 50 kHz BIA data allowed the
estimation of TBW, FFM, TBF and %BF using externally
derived equations based on isotope dilution for TBW and
                                                                  References
multicomponent models for FFM. These prediction equa-
                                                                   1 Kuczmarski RJ, Flegal K, Campbell S, Johnson CL. Increasing
tions for TBW and FFM22 can be applied to other population           prevalence of overweight among US adults. JAMA 1994; 272:
groups in the US, and the calculated TBW, FFM, TBF or %BF            205 – 211.

                                                                                                                International Journal of Obesity
Body composition estimates from NHANES III
                                                                   WC Chumlea et al
1608
           2 Flegal KM, Carroll MD, Kuczmarski RJ, Johnson CL. Overweight             25 SAS I. SAS Procedures Guide, Version 6, 3rd edn SAS Institute Inc.:
             and obesity in the United States: prevalence and trends,                    Cary, NC; 1990.
             1960 – 1994. Int J Obes Relat Metab Disord 1998; 22: 39 – 47.            26 Shah BV, Barnwell BG, Bieler GS. SUDAAN User’s manual, Release
           3 National Center for Health Statistics. NCHS Public Health                   6.40.: Research Triangle Institute: Research Triangle Park, NC;
             Service. Health United States.: US Government Printing Office:               1995.
             Washington, DC; 2000.                                                    27 Forbes G. Growth, aging nutrition, and activity. In:. Human body
           4 Chumlea WC, Guo SS, Glaser RM, Vellas B. Sarcopenia, function               composition.: Springer: New York; 1987.
             and health. Nutr Hlth Aging 1997; 1: 7 – 12.                             28 Ellis KJ (ed). The reference child and adolescent models of body
           5 Lukaski H. Sarcopenia: assessment of muscle mass. J Nutr 1997;              composition: a contemporary comparison.: Annals of New York
             127: 994S – 997S.                                                           Academy of Science: New York; 2000.
           6 Allison DB, Zannolli R, Faith MS, et al. Weight loss increases           29 Guo SS, Zeller C, Chumlea WC, Roche AF, Siervogel RM. Body
             and fat loss decreases all-cause mortality rate: results from two           composition and secular trends in children and young
             independent cohort studies. Int J Obes Relat Metab Disord 1999;             adults: the Fels Longitudinal Study 1929 – 1996. Am J Clin Nutr
             23: 603 – 611.                                                              1997; 66: 220.
           7 Kannel W, Cupples L, Ramaswami R, Stokes J, Kreger B, Higgins M.         30 Baumgartner RN, Stauber PM, Mchugh, D, Koehler KM, Garry PJ.
             Regional Obesity and Risk of Cardiovascular Disease — the                   Cross-sectional age differences in body composition in person
             Framingham Study. J Clin Epidemiol 1991; 44: 183 – 190.                     60 þ years of age. J Gerontol Ser A Biol Sci Med 1995; 50:
           8 Steen B. Body water in the elderly — a review. J Nutr Hlth Aging            M307 – M316.
             1997; 1: 142 – 145.                                                      31 Chumlea WC, Guo SS, Zeller CM, et al. Total body water
           9 Gallagher D, Visser M, Sepulveda D, Pierson RN, Harris T,                   reference values and prediction equations for adults. Kidney Int
             Heymsfield SB. How useful is body mass index for comparison                  2001; 59: 2250 – 2258.
             of body fatness across age, sex, and ethnic groups. Am J Epidemiol       32 Malina R, Little B, Buschang P. Estimated body composition and
             1996; 143: 228 – 239.                                                       strength of chronically mild-to-moderately undernourished rural
          10 Chumlea WC, Vellas B, Guo SS. Malnutrition or healthy senes-                boys in Southern Mexico. Hum Growth Phys Fit Nutr 1991; 31:
             cence. Proc Nutr Soc 1998; 57: 593 – 598.                                   119 – 132.
          11 Kuczmarski MF, Kuczmarski R, Najjar M. Descriptive anthro-               33 Aloia JF, Mikhail M, Pagan CD, Arunachalam A, Yeh JK,
             pometric reference data for older Americans. J Am Diet Assoc                Flaster E. Biochemical and hormonal variables in black and
             2000; 100: 59 – 66.                                                         white women matched for age and weight. J Lab Clin Med 1998;
          12 Schoeller DA (ed). Bioelectrical impedance analysis: what does it           132: 383 – 389.
             measure?, Annals of the New York Academy of Sciences: New York;          34 Ellis KJ. Body composition of a young, multiethnic, male popula-
             2000.                                                                       tion. Am J Clin Nutr 1997; 66: 1323 – 1331.
          13 Lohman TG, Harris M, Teixeira PJ, Weiss L (eds). Assessing body          35 Ellis K. Reference man and woman more fully characterized —
             composition and changes in body composition.: Annals of the                 variations on the basis of body size, age, sex, and race. Biol Trace
             New York Academy of Sciences: New York; 2000.                               Elem Res 1990; 26: 385 – 400.
          14 National Institutes of Health. Bioelectrical impedance analysis in       36 Barondess DA, Nelson DA, Schlaen SE. Whole body bone, fat, and
             body composition measurement. Am J Clin Nutr 1996; 64:                      lean mass in black and white men. J Bone Miner Res 1997; 12:
             524S – 532S.                                                                967 – 971.
          15 US Department of Health and Human Services. National center              37 Gallagher D, Heymsfield SB, Heo M, Jebb SA, Murgatroyd PR,
             for health statistics. The Third National Health and Nutrition              Sakamoto Y. Healthy percentage body fat ranges: an approach for
             Examination Survey (NHANES III, 1988 – 1994).: Centers for Disease          developing guidelines based on body mass index. Am J Clin Nutr
             Control and Prevention: Washington, DC; 1996.                               2000; 72: 694 – 701.
          16 Lukaski H, Johnson P, Bolonchuk W, Lykken G. Assessment of fat-          38 Flegal K, Troiano RP. Changes in the distribution of body mass
             free mass using bioelectrical impedance measurements of the                 index of adults and children in the US population. Int J Obes Relat
             human body 1,2. Am J Clin Nutr 1985; 41: 810 – 817.                         Metab Disord 2000; 24: 807 – 818.
          17 Chumlea WC, Guo S. Bioelectrical impedance and body compo-               39 WHO. Obesity: preventing and Managing the global epidemic.: Report
             sition: present status and future directions. Nutr Rev 1994; 52:            of a WHO Consultation on Obesity. WHO: Geneva; 1997.
             123 – 131.                                                               40 Dutta C, Hadley EC, Lexell J. Sarcopenia and physical perfor-
          18 Cordain L, Whicker R, Johnson J. Body composition determina-                mance in old age: overview.. Muscle Nerve 1997; 5(Suppl): S5 – 9.
             tion in children using bioelectrical impedance. Growth Devl Aging        41 Roubenoff R. Applications of bioelectrical impedance analysis
             1988; 52: 37 – 40.                                                          for body composition to epidemiologic studies. Am J Clin Nutr
          19 Kushner R, Schoeller D. Estimation of total body water by bio-              1996; 64: 459S – 462S.
             electrical impedance analysis. Am J Clin Nutr 1986; 44: 417 – 424.       42 Lohman T, Going S, Pamenter R, et al. Effects of resistance
          20 Wang J, Thornton J, Burastero S, Heymsfield S, Pierson R. Bio-               training on regional and total bone mineral density in premeno-
             impedance analysis for estimation of total body potassium, total            pausal women: a randomized prospective study. J Bone Miner Res
             body water, and fat-free mass in white, black, and Asian adults.            1995; 10: 1015 – 1024.
             Am J Hum Biol 1995; 7: 33 – 40.                                          43 Roche AF. Growth, maturation and body composition: the Fels
          21 Ellis KJ, Bell SJ, Chertow GM, et al. Bioelectrical impedance               Longitudinal Study 1929 – 1991.: Cambridge University Press:
             methods in clinical research: a follow-up to the NIH Technology             Cambridge; 1992.
             Assessment Conference. Nutrition 1999; 15: 874 – 880.                    44 Gray D, Bray GA, Gemayel N, Kaplan K. Effect of obesity on
          22 Guo SS, Chumlea WC, Heymsfield SB, et al. Development of                     bioelectrical impedance. Am J Clin Nutr 1989; 49: 255 – 260.
             bioelectrical impedance prediction equations for body composi-           45 Deurenberg P, Smit HE, Kusters CSL. Is the bioelectrical impe-
             tion using a multicomponent model for use in epidemiological                dance method suitable for epidemiological field studies? Eur J Clin
             surveys. Am J Clin Nutr (in press).                                         Nutr 1989; 43: 647 – 654.
          23 US Department of Health and Human Services. National Center              46 Roche A, Chumlea W, Guo S. Identification=validation of new
             for Health Statistics. NHANES III Anthropometric Procedure Video,           anthropometric techniques for quantifying body composition,
             Stock no. 017-022-01355-5. U.S. Government Printing Office:                  TR-86=058. US Army Natick Research and Development Center:
             Washington, DC; 1996.                                                       Natick, MA; 1986.
          24 Kuczmarski RJ, Chumlea WC. Bioelectrical impedance analysis              47 Jackson A, Pollock M, Graves J, Mahar M. Reliability and validity
             measurements as part of a national nutrition survey. Am J Clin              of bioelectrical impedance in determining body composition.
             Nutr 1996; 64: 453S – 458S.                                                 J Appl Physiol 1988; 64: 529 – 534.


International Journal of Obesity
NHANES Body Composition Estimates Using BIA Data

More Related Content

What's hot

What's hot (10)

MetSyn_Poster.Final
MetSyn_Poster.FinalMetSyn_Poster.Final
MetSyn_Poster.Final
 
Published Manuscript
Published ManuscriptPublished Manuscript
Published Manuscript
 
What % of Civilians Meet Military Weight stds
What % of Civilians Meet Military Weight stdsWhat % of Civilians Meet Military Weight stds
What % of Civilians Meet Military Weight stds
 
11. obesity in children from sonora
11. obesity in children from sonora11. obesity in children from sonora
11. obesity in children from sonora
 
2007 List SKIN PROTEOMICS
2007 List SKIN PROTEOMICS2007 List SKIN PROTEOMICS
2007 List SKIN PROTEOMICS
 
P 422
P 422P 422
P 422
 
Effect of pilates ingles
Effect of pilates   inglesEffect of pilates   ingles
Effect of pilates ingles
 
Plugin jago -effect of-4_weeks_of_pilates_on_the_
Plugin jago -effect of-4_weeks_of_pilates_on_the_Plugin jago -effect of-4_weeks_of_pilates_on_the_
Plugin jago -effect of-4_weeks_of_pilates_on_the_
 
The Effect of Roux-en-Y Gastric Bypass and Sleeve Gastrectomy Surgery on Diet...
The Effect of Roux-en-Y Gastric Bypass and Sleeve Gastrectomy Surgery on Diet...The Effect of Roux-en-Y Gastric Bypass and Sleeve Gastrectomy Surgery on Diet...
The Effect of Roux-en-Y Gastric Bypass and Sleeve Gastrectomy Surgery on Diet...
 
B vitamins
B vitaminsB vitamins
B vitamins
 

Viewers also liked

Welkomswoord door Henny De Baets
Welkomswoord door Henny De BaetsWelkomswoord door Henny De Baets
Welkomswoord door Henny De BaetsOVAM
 
Correlation between organ dysfunctions and vertebral displacements
Correlation between organ dysfunctions and vertebral displacementsCorrelation between organ dysfunctions and vertebral displacements
Correlation between organ dysfunctions and vertebral displacementsES-Teck India
 
2009 07 Flying High Presentation
2009 07  Flying  High  Presentation2009 07  Flying  High  Presentation
2009 07 Flying High Presentationshawbodymagic
 
Power Start Presentation
Power Start PresentationPower Start Presentation
Power Start Presentationshawbodymagic
 
C2CNetwork Newsletter 1
C2CNetwork Newsletter 1C2CNetwork Newsletter 1
C2CNetwork Newsletter 1OVAM
 

Viewers also liked (8)

Welkomswoord door Henny De Baets
Welkomswoord door Henny De BaetsWelkomswoord door Henny De Baets
Welkomswoord door Henny De Baets
 
Compensation Plan J
Compensation Plan JCompensation Plan J
Compensation Plan J
 
Correlation between organ dysfunctions and vertebral displacements
Correlation between organ dysfunctions and vertebral displacementsCorrelation between organ dysfunctions and vertebral displacements
Correlation between organ dysfunctions and vertebral displacements
 
2009 07 Flying High Presentation
2009 07  Flying  High  Presentation2009 07  Flying  High  Presentation
2009 07 Flying High Presentation
 
Power Start Presentation
Power Start PresentationPower Start Presentation
Power Start Presentation
 
C2CNetwork Newsletter 1
C2CNetwork Newsletter 1C2CNetwork Newsletter 1
C2CNetwork Newsletter 1
 
Sdptg 3
Sdptg 3Sdptg 3
Sdptg 3
 
Oxidative stress
Oxidative stressOxidative stress
Oxidative stress
 

Similar to NHANES Body Composition Estimates Using BIA Data

Albumina sarcopenia
Albumina sarcopeniaAlbumina sarcopenia
Albumina sarcopeniavegaline
 
BODY FAT DEPOSITION AND RISK FACTORS OF CARDIOVASCULAR DISEASES IN MEN
BODY FAT DEPOSITION AND RISK FACTORS OF CARDIOVASCULAR DISEASES IN MENBODY FAT DEPOSITION AND RISK FACTORS OF CARDIOVASCULAR DISEASES IN MEN
BODY FAT DEPOSITION AND RISK FACTORS OF CARDIOVASCULAR DISEASES IN MENProf William Alves Lima
 
Development and Validation of prediction for estimating resting energy expend...
Development and Validation of prediction for estimating resting energy expend...Development and Validation of prediction for estimating resting energy expend...
Development and Validation of prediction for estimating resting energy expend...IOSR Journals
 
Interpreting Health Status Of Indian Population Using Phase Angle As Health P...
Interpreting Health Status Of Indian Population Using Phase Angle As Health P...Interpreting Health Status Of Indian Population Using Phase Angle As Health P...
Interpreting Health Status Of Indian Population Using Phase Angle As Health P...IJRES Journal
 
Nutritional Status And Somatotype Study on Sabar males of Purulia
Nutritional Status And Somatotype Study on Sabar males of PuruliaNutritional Status And Somatotype Study on Sabar males of Purulia
Nutritional Status And Somatotype Study on Sabar males of Puruliapratanubanerjee3
 
XNN001 Nutrition assessment in individuals and populations
XNN001 Nutrition assessment in individuals and populationsXNN001 Nutrition assessment in individuals and populations
XNN001 Nutrition assessment in individuals and populationsramseyr
 
Assessing the Relationship between Body Composition and Spinal Curvatures in ...
Assessing the Relationship between Body Composition and Spinal Curvatures in ...Assessing the Relationship between Body Composition and Spinal Curvatures in ...
Assessing the Relationship between Body Composition and Spinal Curvatures in ...peertechzpublication
 
New standards of weight and body composition by frame size and heigth for ass...
New standards of weight and body composition by frame size and heigth for ass...New standards of weight and body composition by frame size and heigth for ass...
New standards of weight and body composition by frame size and heigth for ass...Alejandra Licea
 
A Study Of Age At Menarche And Body Composition In School Girls Of Metro cities
A Study Of Age At Menarche And Body Composition In School Girls Of Metro citiesA Study Of Age At Menarche And Body Composition In School Girls Of Metro cities
A Study Of Age At Menarche And Body Composition In School Girls Of Metro citiesijcite
 
HtWt_Full-Report2006_Approved-Final
HtWt_Full-Report2006_Approved-FinalHtWt_Full-Report2006_Approved-Final
HtWt_Full-Report2006_Approved-FinalDr. Zeenat Mahal
 
Am j clin nutr 1976-martorell-46-53
Am j clin nutr 1976-martorell-46-53Am j clin nutr 1976-martorell-46-53
Am j clin nutr 1976-martorell-46-53Yanuarti Petrika
 
Which US States Present the Greatest Military Injury Risks
Which US States Present the Greatest Military Injury RisksWhich US States Present the Greatest Military Injury Risks
Which US States Present the Greatest Military Injury RisksJA Larson
 

Similar to NHANES Body Composition Estimates Using BIA Data (20)

A03120101015
A03120101015A03120101015
A03120101015
 
Albumina sarcopenia
Albumina sarcopeniaAlbumina sarcopenia
Albumina sarcopenia
 
A04302001017
A04302001017A04302001017
A04302001017
 
CUN-BAE PDF
CUN-BAE PDFCUN-BAE PDF
CUN-BAE PDF
 
BODY FAT DEPOSITION AND RISK FACTORS OF CARDIOVASCULAR DISEASES IN MEN
BODY FAT DEPOSITION AND RISK FACTORS OF CARDIOVASCULAR DISEASES IN MENBODY FAT DEPOSITION AND RISK FACTORS OF CARDIOVASCULAR DISEASES IN MEN
BODY FAT DEPOSITION AND RISK FACTORS OF CARDIOVASCULAR DISEASES IN MEN
 
Methods
MethodsMethods
Methods
 
Development and Validation of prediction for estimating resting energy expend...
Development and Validation of prediction for estimating resting energy expend...Development and Validation of prediction for estimating resting energy expend...
Development and Validation of prediction for estimating resting energy expend...
 
jgi_01104.pdf
jgi_01104.pdfjgi_01104.pdf
jgi_01104.pdf
 
PR AMR falls and cancer treatment full article
PR AMR falls and cancer treatment full articlePR AMR falls and cancer treatment full article
PR AMR falls and cancer treatment full article
 
Interpreting Health Status Of Indian Population Using Phase Angle As Health P...
Interpreting Health Status Of Indian Population Using Phase Angle As Health P...Interpreting Health Status Of Indian Population Using Phase Angle As Health P...
Interpreting Health Status Of Indian Population Using Phase Angle As Health P...
 
Nutritional Status And Somatotype Study on Sabar males of Purulia
Nutritional Status And Somatotype Study on Sabar males of PuruliaNutritional Status And Somatotype Study on Sabar males of Purulia
Nutritional Status And Somatotype Study on Sabar males of Purulia
 
XNN001 Nutrition assessment in individuals and populations
XNN001 Nutrition assessment in individuals and populationsXNN001 Nutrition assessment in individuals and populations
XNN001 Nutrition assessment in individuals and populations
 
Assessing the Relationship between Body Composition and Spinal Curvatures in ...
Assessing the Relationship between Body Composition and Spinal Curvatures in ...Assessing the Relationship between Body Composition and Spinal Curvatures in ...
Assessing the Relationship between Body Composition and Spinal Curvatures in ...
 
New standards of weight and body composition by frame size and heigth for ass...
New standards of weight and body composition by frame size and heigth for ass...New standards of weight and body composition by frame size and heigth for ass...
New standards of weight and body composition by frame size and heigth for ass...
 
Waist circumference
Waist circumferenceWaist circumference
Waist circumference
 
A Study Of Age At Menarche And Body Composition In School Girls Of Metro cities
A Study Of Age At Menarche And Body Composition In School Girls Of Metro citiesA Study Of Age At Menarche And Body Composition In School Girls Of Metro cities
A Study Of Age At Menarche And Body Composition In School Girls Of Metro cities
 
HtWt_Full-Report2006_Approved-Final
HtWt_Full-Report2006_Approved-FinalHtWt_Full-Report2006_Approved-Final
HtWt_Full-Report2006_Approved-Final
 
Am j clin nutr 1976-martorell-46-53
Am j clin nutr 1976-martorell-46-53Am j clin nutr 1976-martorell-46-53
Am j clin nutr 1976-martorell-46-53
 
Which US States Present the Greatest Military Injury Risks
Which US States Present the Greatest Military Injury RisksWhich US States Present the Greatest Military Injury Risks
Which US States Present the Greatest Military Injury Risks
 
Associations of Obesity Indices with Cardiorespiratory Fitness in Bengali Sch...
Associations of Obesity Indices with Cardiorespiratory Fitness in Bengali Sch...Associations of Obesity Indices with Cardiorespiratory Fitness in Bengali Sch...
Associations of Obesity Indices with Cardiorespiratory Fitness in Bengali Sch...
 

More from ES-Teck India

EIS Technology: New marker using bioimpedance technology in screening for ADHD
EIS Technology: New marker using bioimpedance technology in screening for ADHDEIS Technology: New marker using bioimpedance technology in screening for ADHD
EIS Technology: New marker using bioimpedance technology in screening for ADHDES-Teck India
 
ESO system, ES-BC system and EIS-GS system - Miami University study
ESO system, ES-BC system and EIS-GS system - Miami University study ESO system, ES-BC system and EIS-GS system - Miami University study
ESO system, ES-BC system and EIS-GS system - Miami University study ES-Teck India
 
EIS technology : bioimpedance application in selective serotonin reuptake
EIS technology : bioimpedance application in selective serotonin reuptakeEIS technology : bioimpedance application in selective serotonin reuptake
EIS technology : bioimpedance application in selective serotonin reuptakeES-Teck India
 
EIS Technology: bioimpedance chronoamperometry in adjunct to screen the prost...
EIS Technology: bioimpedance chronoamperometry in adjunct to screen the prost...EIS Technology: bioimpedance chronoamperometry in adjunct to screen the prost...
EIS Technology: bioimpedance chronoamperometry in adjunct to screen the prost...ES-Teck India
 
Summary of clinical investigations es teck complex system
Summary of clinical investigations es teck complex systemSummary of clinical investigations es teck complex system
Summary of clinical investigations es teck complex systemES-Teck India
 
Pulse wave reflection
Pulse wave reflectionPulse wave reflection
Pulse wave reflectionES-Teck India
 
Ptg and cardiac output.jsp
Ptg and cardiac output.jspPtg and cardiac output.jsp
Ptg and cardiac output.jspES-Teck India
 
Guidelines heart rate_variability_ft_1996[1]
Guidelines heart rate_variability_ft_1996[1]Guidelines heart rate_variability_ft_1996[1]
Guidelines heart rate_variability_ft_1996[1]ES-Teck India
 
Arterioscler thromb vasc_biol_22_147
Arterioscler thromb vasc_biol_22_147Arterioscler thromb vasc_biol_22_147
Arterioscler thromb vasc_biol_22_147ES-Teck India
 
Serotonin ssri effects
Serotonin ssri effectsSerotonin ssri effects
Serotonin ssri effectsES-Teck India
 
Serotonin and blood flow
Serotonin and blood flowSerotonin and blood flow
Serotonin and blood flowES-Teck India
 

More from ES-Teck India (20)

EIS Technology: New marker using bioimpedance technology in screening for ADHD
EIS Technology: New marker using bioimpedance technology in screening for ADHDEIS Technology: New marker using bioimpedance technology in screening for ADHD
EIS Technology: New marker using bioimpedance technology in screening for ADHD
 
ESO system, ES-BC system and EIS-GS system - Miami University study
ESO system, ES-BC system and EIS-GS system - Miami University study ESO system, ES-BC system and EIS-GS system - Miami University study
ESO system, ES-BC system and EIS-GS system - Miami University study
 
Es teck india
Es teck indiaEs teck india
Es teck india
 
EIS technology : bioimpedance application in selective serotonin reuptake
EIS technology : bioimpedance application in selective serotonin reuptakeEIS technology : bioimpedance application in selective serotonin reuptake
EIS technology : bioimpedance application in selective serotonin reuptake
 
EIS Technology: bioimpedance chronoamperometry in adjunct to screen the prost...
EIS Technology: bioimpedance chronoamperometry in adjunct to screen the prost...EIS Technology: bioimpedance chronoamperometry in adjunct to screen the prost...
EIS Technology: bioimpedance chronoamperometry in adjunct to screen the prost...
 
Summary of clinical investigations es teck complex system
Summary of clinical investigations es teck complex systemSummary of clinical investigations es teck complex system
Summary of clinical investigations es teck complex system
 
Stptg 4
Stptg 4Stptg 4
Stptg 4
 
Stptg 2
Stptg 2Stptg 2
Stptg 2
 
Sdptg1
Sdptg1Sdptg1
Sdptg1
 
Pulseox[1]
Pulseox[1]Pulseox[1]
Pulseox[1]
 
Pulse wave reflection
Pulse wave reflectionPulse wave reflection
Pulse wave reflection
 
Pulse wave indice
Pulse wave indicePulse wave indice
Pulse wave indice
 
Pulse wave analysis
Pulse wave analysisPulse wave analysis
Pulse wave analysis
 
Ptg and cardiac output.jsp
Ptg and cardiac output.jspPtg and cardiac output.jsp
Ptg and cardiac output.jsp
 
Guidelines heart rate_variability_ft_1996[1]
Guidelines heart rate_variability_ft_1996[1]Guidelines heart rate_variability_ft_1996[1]
Guidelines heart rate_variability_ft_1996[1]
 
Arterioscler thromb vasc_biol_22_147
Arterioscler thromb vasc_biol_22_147Arterioscler thromb vasc_biol_22_147
Arterioscler thromb vasc_biol_22_147
 
Angitensin and ptg
Angitensin and ptgAngitensin and ptg
Angitensin and ptg
 
About pulseoximetry
About pulseoximetryAbout pulseoximetry
About pulseoximetry
 
Serotonin ssri effects
Serotonin ssri effectsSerotonin ssri effects
Serotonin ssri effects
 
Serotonin and blood flow
Serotonin and blood flowSerotonin and blood flow
Serotonin and blood flow
 

Recently uploaded

Dwarka Sector 6 Call Girls ( 9873940964 ) Book Hot And Sexy Girls In A Few Cl...
Dwarka Sector 6 Call Girls ( 9873940964 ) Book Hot And Sexy Girls In A Few Cl...Dwarka Sector 6 Call Girls ( 9873940964 ) Book Hot And Sexy Girls In A Few Cl...
Dwarka Sector 6 Call Girls ( 9873940964 ) Book Hot And Sexy Girls In A Few Cl...rajnisinghkjn
 
Call Girl Surat Madhuri 7001305949 Independent Escort Service Surat
Call Girl Surat Madhuri 7001305949 Independent Escort Service SuratCall Girl Surat Madhuri 7001305949 Independent Escort Service Surat
Call Girl Surat Madhuri 7001305949 Independent Escort Service Suratnarwatsonia7
 
College Call Girls Vyasarpadi Whatsapp 7001305949 Independent Escort Service
College Call Girls Vyasarpadi Whatsapp 7001305949 Independent Escort ServiceCollege Call Girls Vyasarpadi Whatsapp 7001305949 Independent Escort Service
College Call Girls Vyasarpadi Whatsapp 7001305949 Independent Escort ServiceNehru place Escorts
 
Housewife Call Girls Bangalore - Call 7001305949 Rs-3500 with A/C Room Cash o...
Housewife Call Girls Bangalore - Call 7001305949 Rs-3500 with A/C Room Cash o...Housewife Call Girls Bangalore - Call 7001305949 Rs-3500 with A/C Room Cash o...
Housewife Call Girls Bangalore - Call 7001305949 Rs-3500 with A/C Room Cash o...narwatsonia7
 
Hematology and Immunology - Leukocytes Functions
Hematology and Immunology - Leukocytes FunctionsHematology and Immunology - Leukocytes Functions
Hematology and Immunology - Leukocytes FunctionsMedicoseAcademics
 
Call Girls In Andheri East Call 9920874524 Book Hot And Sexy Girls
Call Girls In Andheri East Call 9920874524 Book Hot And Sexy GirlsCall Girls In Andheri East Call 9920874524 Book Hot And Sexy Girls
Call Girls In Andheri East Call 9920874524 Book Hot And Sexy Girlsnehamumbai
 
Call Girls Whitefield Just Call 7001305949 Top Class Call Girl Service Available
Call Girls Whitefield Just Call 7001305949 Top Class Call Girl Service AvailableCall Girls Whitefield Just Call 7001305949 Top Class Call Girl Service Available
Call Girls Whitefield Just Call 7001305949 Top Class Call Girl Service Availablenarwatsonia7
 
VIP Call Girls Mumbai Arpita 9910780858 Independent Escort Service Mumbai
VIP Call Girls Mumbai Arpita 9910780858 Independent Escort Service MumbaiVIP Call Girls Mumbai Arpita 9910780858 Independent Escort Service Mumbai
VIP Call Girls Mumbai Arpita 9910780858 Independent Escort Service Mumbaisonalikaur4
 
Russian Call Girls Chickpet - 7001305949 Booking and charges genuine rate for...
Russian Call Girls Chickpet - 7001305949 Booking and charges genuine rate for...Russian Call Girls Chickpet - 7001305949 Booking and charges genuine rate for...
Russian Call Girls Chickpet - 7001305949 Booking and charges genuine rate for...narwatsonia7
 
Russian Call Girls Gunjur Mugalur Road : 7001305949 High Profile Model Escort...
Russian Call Girls Gunjur Mugalur Road : 7001305949 High Profile Model Escort...Russian Call Girls Gunjur Mugalur Road : 7001305949 High Profile Model Escort...
Russian Call Girls Gunjur Mugalur Road : 7001305949 High Profile Model Escort...narwatsonia7
 
Call Girls Kanakapura Road Just Call 7001305949 Top Class Call Girl Service A...
Call Girls Kanakapura Road Just Call 7001305949 Top Class Call Girl Service A...Call Girls Kanakapura Road Just Call 7001305949 Top Class Call Girl Service A...
Call Girls Kanakapura Road Just Call 7001305949 Top Class Call Girl Service A...narwatsonia7
 
call girls in Connaught Place DELHI 🔝 >༒9540349809 🔝 genuine Escort Service ...
call girls in Connaught Place  DELHI 🔝 >༒9540349809 🔝 genuine Escort Service ...call girls in Connaught Place  DELHI 🔝 >༒9540349809 🔝 genuine Escort Service ...
call girls in Connaught Place DELHI 🔝 >༒9540349809 🔝 genuine Escort Service ...saminamagar
 
Call Girls Thane Just Call 9910780858 Get High Class Call Girls Service
Call Girls Thane Just Call 9910780858 Get High Class Call Girls ServiceCall Girls Thane Just Call 9910780858 Get High Class Call Girls Service
Call Girls Thane Just Call 9910780858 Get High Class Call Girls Servicesonalikaur4
 
Noida Sector 135 Call Girls ( 9873940964 ) Book Hot And Sexy Girls In A Few C...
Noida Sector 135 Call Girls ( 9873940964 ) Book Hot And Sexy Girls In A Few C...Noida Sector 135 Call Girls ( 9873940964 ) Book Hot And Sexy Girls In A Few C...
Noida Sector 135 Call Girls ( 9873940964 ) Book Hot And Sexy Girls In A Few C...rajnisinghkjn
 
High Profile Call Girls Jaipur Vani 8445551418 Independent Escort Service Jaipur
High Profile Call Girls Jaipur Vani 8445551418 Independent Escort Service JaipurHigh Profile Call Girls Jaipur Vani 8445551418 Independent Escort Service Jaipur
High Profile Call Girls Jaipur Vani 8445551418 Independent Escort Service Jaipurparulsinha
 
Call Girls Service Nandiambakkam | 7001305949 At Low Cost Cash Payment Booking
Call Girls Service Nandiambakkam | 7001305949 At Low Cost Cash Payment BookingCall Girls Service Nandiambakkam | 7001305949 At Low Cost Cash Payment Booking
Call Girls Service Nandiambakkam | 7001305949 At Low Cost Cash Payment BookingNehru place Escorts
 
Pharmaceutical Marketting: Unit-5, Pricing
Pharmaceutical Marketting: Unit-5, PricingPharmaceutical Marketting: Unit-5, Pricing
Pharmaceutical Marketting: Unit-5, PricingArunagarwal328757
 
Call Girl Bangalore Nandini 7001305949 Independent Escort Service Bangalore
Call Girl Bangalore Nandini 7001305949 Independent Escort Service BangaloreCall Girl Bangalore Nandini 7001305949 Independent Escort Service Bangalore
Call Girl Bangalore Nandini 7001305949 Independent Escort Service Bangalorenarwatsonia7
 
Call Girl Service Bidadi - For 7001305949 Cheap & Best with original Photos
Call Girl Service Bidadi - For 7001305949 Cheap & Best with original PhotosCall Girl Service Bidadi - For 7001305949 Cheap & Best with original Photos
Call Girl Service Bidadi - For 7001305949 Cheap & Best with original Photosnarwatsonia7
 
Book Call Girls in Yelahanka - For 7001305949 Cheap & Best with original Photos
Book Call Girls in Yelahanka - For 7001305949 Cheap & Best with original PhotosBook Call Girls in Yelahanka - For 7001305949 Cheap & Best with original Photos
Book Call Girls in Yelahanka - For 7001305949 Cheap & Best with original Photosnarwatsonia7
 

Recently uploaded (20)

Dwarka Sector 6 Call Girls ( 9873940964 ) Book Hot And Sexy Girls In A Few Cl...
Dwarka Sector 6 Call Girls ( 9873940964 ) Book Hot And Sexy Girls In A Few Cl...Dwarka Sector 6 Call Girls ( 9873940964 ) Book Hot And Sexy Girls In A Few Cl...
Dwarka Sector 6 Call Girls ( 9873940964 ) Book Hot And Sexy Girls In A Few Cl...
 
Call Girl Surat Madhuri 7001305949 Independent Escort Service Surat
Call Girl Surat Madhuri 7001305949 Independent Escort Service SuratCall Girl Surat Madhuri 7001305949 Independent Escort Service Surat
Call Girl Surat Madhuri 7001305949 Independent Escort Service Surat
 
College Call Girls Vyasarpadi Whatsapp 7001305949 Independent Escort Service
College Call Girls Vyasarpadi Whatsapp 7001305949 Independent Escort ServiceCollege Call Girls Vyasarpadi Whatsapp 7001305949 Independent Escort Service
College Call Girls Vyasarpadi Whatsapp 7001305949 Independent Escort Service
 
Housewife Call Girls Bangalore - Call 7001305949 Rs-3500 with A/C Room Cash o...
Housewife Call Girls Bangalore - Call 7001305949 Rs-3500 with A/C Room Cash o...Housewife Call Girls Bangalore - Call 7001305949 Rs-3500 with A/C Room Cash o...
Housewife Call Girls Bangalore - Call 7001305949 Rs-3500 with A/C Room Cash o...
 
Hematology and Immunology - Leukocytes Functions
Hematology and Immunology - Leukocytes FunctionsHematology and Immunology - Leukocytes Functions
Hematology and Immunology - Leukocytes Functions
 
Call Girls In Andheri East Call 9920874524 Book Hot And Sexy Girls
Call Girls In Andheri East Call 9920874524 Book Hot And Sexy GirlsCall Girls In Andheri East Call 9920874524 Book Hot And Sexy Girls
Call Girls In Andheri East Call 9920874524 Book Hot And Sexy Girls
 
Call Girls Whitefield Just Call 7001305949 Top Class Call Girl Service Available
Call Girls Whitefield Just Call 7001305949 Top Class Call Girl Service AvailableCall Girls Whitefield Just Call 7001305949 Top Class Call Girl Service Available
Call Girls Whitefield Just Call 7001305949 Top Class Call Girl Service Available
 
VIP Call Girls Mumbai Arpita 9910780858 Independent Escort Service Mumbai
VIP Call Girls Mumbai Arpita 9910780858 Independent Escort Service MumbaiVIP Call Girls Mumbai Arpita 9910780858 Independent Escort Service Mumbai
VIP Call Girls Mumbai Arpita 9910780858 Independent Escort Service Mumbai
 
Russian Call Girls Chickpet - 7001305949 Booking and charges genuine rate for...
Russian Call Girls Chickpet - 7001305949 Booking and charges genuine rate for...Russian Call Girls Chickpet - 7001305949 Booking and charges genuine rate for...
Russian Call Girls Chickpet - 7001305949 Booking and charges genuine rate for...
 
Russian Call Girls Gunjur Mugalur Road : 7001305949 High Profile Model Escort...
Russian Call Girls Gunjur Mugalur Road : 7001305949 High Profile Model Escort...Russian Call Girls Gunjur Mugalur Road : 7001305949 High Profile Model Escort...
Russian Call Girls Gunjur Mugalur Road : 7001305949 High Profile Model Escort...
 
Call Girls Kanakapura Road Just Call 7001305949 Top Class Call Girl Service A...
Call Girls Kanakapura Road Just Call 7001305949 Top Class Call Girl Service A...Call Girls Kanakapura Road Just Call 7001305949 Top Class Call Girl Service A...
Call Girls Kanakapura Road Just Call 7001305949 Top Class Call Girl Service A...
 
call girls in Connaught Place DELHI 🔝 >༒9540349809 🔝 genuine Escort Service ...
call girls in Connaught Place  DELHI 🔝 >༒9540349809 🔝 genuine Escort Service ...call girls in Connaught Place  DELHI 🔝 >༒9540349809 🔝 genuine Escort Service ...
call girls in Connaught Place DELHI 🔝 >༒9540349809 🔝 genuine Escort Service ...
 
Call Girls Thane Just Call 9910780858 Get High Class Call Girls Service
Call Girls Thane Just Call 9910780858 Get High Class Call Girls ServiceCall Girls Thane Just Call 9910780858 Get High Class Call Girls Service
Call Girls Thane Just Call 9910780858 Get High Class Call Girls Service
 
Noida Sector 135 Call Girls ( 9873940964 ) Book Hot And Sexy Girls In A Few C...
Noida Sector 135 Call Girls ( 9873940964 ) Book Hot And Sexy Girls In A Few C...Noida Sector 135 Call Girls ( 9873940964 ) Book Hot And Sexy Girls In A Few C...
Noida Sector 135 Call Girls ( 9873940964 ) Book Hot And Sexy Girls In A Few C...
 
High Profile Call Girls Jaipur Vani 8445551418 Independent Escort Service Jaipur
High Profile Call Girls Jaipur Vani 8445551418 Independent Escort Service JaipurHigh Profile Call Girls Jaipur Vani 8445551418 Independent Escort Service Jaipur
High Profile Call Girls Jaipur Vani 8445551418 Independent Escort Service Jaipur
 
Call Girls Service Nandiambakkam | 7001305949 At Low Cost Cash Payment Booking
Call Girls Service Nandiambakkam | 7001305949 At Low Cost Cash Payment BookingCall Girls Service Nandiambakkam | 7001305949 At Low Cost Cash Payment Booking
Call Girls Service Nandiambakkam | 7001305949 At Low Cost Cash Payment Booking
 
Pharmaceutical Marketting: Unit-5, Pricing
Pharmaceutical Marketting: Unit-5, PricingPharmaceutical Marketting: Unit-5, Pricing
Pharmaceutical Marketting: Unit-5, Pricing
 
Call Girl Bangalore Nandini 7001305949 Independent Escort Service Bangalore
Call Girl Bangalore Nandini 7001305949 Independent Escort Service BangaloreCall Girl Bangalore Nandini 7001305949 Independent Escort Service Bangalore
Call Girl Bangalore Nandini 7001305949 Independent Escort Service Bangalore
 
Call Girl Service Bidadi - For 7001305949 Cheap & Best with original Photos
Call Girl Service Bidadi - For 7001305949 Cheap & Best with original PhotosCall Girl Service Bidadi - For 7001305949 Cheap & Best with original Photos
Call Girl Service Bidadi - For 7001305949 Cheap & Best with original Photos
 
Book Call Girls in Yelahanka - For 7001305949 Cheap & Best with original Photos
Book Call Girls in Yelahanka - For 7001305949 Cheap & Best with original PhotosBook Call Girls in Yelahanka - For 7001305949 Cheap & Best with original Photos
Book Call Girls in Yelahanka - For 7001305949 Cheap & Best with original Photos
 

NHANES Body Composition Estimates Using BIA Data

  • 1. International Journal of Obesity (2002) 26, 1596–1609 ß 2002 Nature Publishing Group All rights reserved 0307–0565/02 $25.00 www.nature.com/ijo PAPER Body composition estimates from NHANES III bioelectrical impedance data WC Chumlea1, SS Guo1*, RJ Kuczmarski2, KM Flegal3, CL Johnson3, SB Heymsfield4, HC Lukaski5, K Friedl6 and VS Hubbard7 1 Department of Community, Health Wright State University School of Medicine, Dayton, Ohio, USA;2National Institutes of Health Division of Digestive Diseases and Nutrition, NIDDK, Bethesda, Maryland, USA; 3Centers for Disease Control and Prevention, National Center for Health Statistics, Division of Health Examination Statistics, Hyattsville, Maryland, USA; 4Obesity Research Center, St Lukes-Roosevelt Hospital, Columbia University, New York, USA; 5US Department of Agriculture, Agriculture Research Service, Grand Forks HNRC, Grand Forks, North Dakota, USA; 6Military Operational Medicine Program, Military Medical Research and Materiel Command, Frederick, Maryland, USA; and 7National Institutes of Health, Division of Nutrition Research Coordination and Nutritional Sciences Branch, NIDDK, Bethesda, Maryland, USA BACKGROUND: Body composition estimates for the US population are important in order to analyze trends in obesity, sarcopenia and other weight-related health conditions. National body composition estimates have not previously been available. OBJECTIVE: To use transformed bioelectrical impedance analysis (BIA) data in sex-specific, multicomponent model-derived prediction formulae, to estimate total body water (TBW), fat-free mass (FFM), total body fat (TBF), and percentage body fat (%BF) using a nationally representative sample of the US population. DESIGN: Anthropometric and BIA data were from the third National Health and Nutrition Examination Survey (NHANES III; 1988 – 1994). Sex-specific BIA prediction equations developed for this study were applied to the NHANES data, and mean values for TBW, FFM, TBF and %BF were estimated for selected age, sex and racial-ethnic groups. RESULTS: Among the non-Hispanic white, non-Hispanic black, and Mexican-American participants aged 12 – 80 y examined in NHANES III, 15 912 had data available for weight, stature and BIA resistance measures. Males had higher mean TBW and FFM than did females, regardless of age or racial-ethnic status. Mean TBW and FFM increased from the adolescent years to mid- adulthood and declined in older adult age groups. Females had higher mean TBF and %BF estimates than males at each age group. Mean TBF also increased with older age groups to approximately 60 y of age after which it decreased. CONCLUSIONS: These mean body composition estimates for TBW, FFM, TBF and %BF based upon NHANES III BIA data provide a descriptive reference for non-Hispanic whites, non-Hispanic blacks and Mexican Americans in the US population. International Journal of Obesity (2002) 26, 1596 – 1611. doi:10.1038/sj.ijo.0802167 Keywords: body composition; obesity; BIA; NHANES; health surveys Introduction constituents that link obesity, aging, and chronic disease with Overweight and obesity are increasing in the US population.1,2 subsequent morbidity and mortality.6 – 8 There exists little Excess adiposity is the major weight-related health concern up accurate information at present on estimates of TBW, FFM, to the seventh decade of life, but an increased lifespan3 TBF, and percentage fat (%BF) for the US population as a indicates the importance of lean tissue loss and its association whole.9 – 11 Systems capable of reliably quantifying body com- with frailty and sarcopenia in the elderly.4,5 Fat and lean position under controlled conditions, such as bioelectrical components of the body including total body fat (TBF), impedance analysis (BIA) and dual-energy X-ray absorptiom- fat-free mass (FFM), and total body water (TBW) are important etry (DXA), have been introduced and subsequently validated over the past two decades.12,13 This technology and the increasing clinical and research importance of body com- position highlight the need for improved information on *Correspondence: SS Guo, Lifespan Health Research Center, Department population estimates of TBW, FFM, TBF and %BF. of Community Health, 3171 Research Blvd, Kettering Ohio, OH 45420, Prior surveys and studies of body composition in the USA. E-mail: shumei.guo@wright.edu US population are based largely on anthropometric data Received 11 October 2001; revised 15 May 2002; including measures of body weight, stature, skinfold thick- accepted 1 July 2002
  • 2. Body composition estimates from NHANES III WC Chumlea et al 1597 nesses and circumferences. These provide correlates of Hispanic black males, 2606 non-Hispanic black females, fatness (ie body mass index; BMI) or approximate estimates 2494 Mexican American males, and 2298 Mexican American of regional and total body fatness. These data for the US females, for development of the body composition distribu- population collected over the past 30 y have a limited tion data. ability to quantify body composition. The report of the 1994 NIH-sponsored Technology Assessment Conference, ‘Bioelectrical Impedance Analysis in Body Composition Measurements Measurement’,14 recommended that national reference Documentation for the NHANES III procedures includes distributions for body composition be developed using BIA written descriptions15 and a video demonstration.23 Body data from the Third National Health and Nutrition Exam- weight was measured with an electronic load cell scale to the ination Survey.15 BIA systems are calibrated for the popula- nearest 0.01 kg. Participants wore only under-shorts and tion under study by developing prediction formulae based disposable paper shirts, pants and foam slippers but no on criterion methods from resistance, stature and other adjustment was made for this minimal clothing weight easily acquired variables.16 – 20 Most of these predictive equa- (0.18 kg) in the analyses. Stature was measured to the nearest tions are based on limited samples and two-component 0.1 cm using a fixed stadiometer. Participants were posi- models that describe fat and FFM only.21 To use the tioned with heels, buttocks, back and head against the NHANES III BIA data to estimate national body composition upright surface of the stadiometer with the head positioned distributions, a set of externally derived BIA prediction in the Frankfort horizontal plane. equations were developed using isotope dilution to predict Participants had a single, tetrapolar BIA measurement of TBW and a multicomponent model to predict FFM.22 resistance (Res) and reactance at 50 kHz taken between the These equations provided estimates for the major body right wrist and ankle while in a supine position, using compartments when applied to the NHANES III data for Valhalla 1990B Bio-Resistance Body Composition Analyzer non-Hispanic whites, non-Hispanic blacks and Mexican- (Valhalla Scientific, San Diego, CA, USA).24 the decision Americans aged 12 – 80 y. This report fulfills the recommen- regarding the selection of the impedance analyzer was dation of the 1994 NIH Conference14 with the presentation made ca 1986. The reactance values were not used in the of cross-sectional estimates for mean TBW, FFM, TBF and body composition prediction equations22 and, therefore, %BF by sex and age for these three racial-ethnic groups in the are not presented or discussed further. The measure- US population. ment accuracy of the Valhalla impedance machines used in NHANES III was independently certified by the National Institute of Standards and Technology following Methods the survey. Sample The NHANES III was a nationally representative, two-phase, 6 y, cross-sectional survey conducted from 1988 until 1994.15 The complex sampling plan used a stratified, multistage, Body composition calculations probability cluster design. The initial sampling of house- Conversion of NHANES III BIA values. The TBW and FFM holds, identification of participants, and the collection of prediction equations22 used Res data from RJL bioelectrical data in mobile examination centers in NHANES III were impedance analyzers (RJL, Clinton Twp, MI, USA). The similar to that in previous NHANES.15 An individual’s NHANES III BIA data were obtained with a Valhalla impe- racial-ethnic status was self-identified. dance analyzer. However, all BIA resistance data reported The total NHANES III sample consisted of 31 311 exami- in this manuscript are converted RJL Res values because ned participants. Children younger than 12 y of age and there are no prediction equations from large-scale studies pregnant women were not eligible for the BIA procedure in using Valhalla bioimpedance instruments. Before applying NHANES III. There were also very few participants over 80 y the TBW and FFM prediction equations to these data, of age. After excluding 12 562 participants with ages < 12 y the Valhalla Res value for each NHANES III subject or > 80 y, 798 participants with race-ethnicity other than was converted to an equivalent RJL Res value using equa- non-Hispanic white, non-Hispanic black or Mexican tions developed from a separate, independent sample. American and 2039 participants missing weight, stature Details of this conversion process are presented in the and=or BIA resistance, the available analytic sample con- Appendix. tained 15 912 participants. The developed BIA prediction equations22 were applied to this sub-sample, but additional Prediction equations. The TBW and FFM, BIA prediction exclusions were made when predicted TBW exceeded 80% of equations listed below22 were applied to the respective body weight (n ¼ 1), or when the calculated TBF was NHANES III anthropometric and converted BIA resistance negative (n ¼ 8). These last exclusions resulted in a final data for each selected NHANES III participant to derive sample of 15 903 participants, 2880 non-Hispanic white estimates for TBW and FFM. The converted NHANES III, males, 3277 non-Hispanic white females, 2348 non- RJL resistance values were used to calculated the impedance International Journal of Obesity
  • 3. Body composition estimates from NHANES III WC Chumlea et al 1598 index of stature squared divided by resistance (S2=Res) in the Estimated means for TBW, FFM, TBF, and %BF are shown in TBW and FFM prediction equations. Tables 4 – 7 and Figures 1 – 4, and they are summarized in the following text. Males TBW ¼ 1:203 þ 0:176 weight þ 0:449 S2 =Res r 2 ¼ 0:84; RMSE ¼ 3:81 Females TBW ¼ 3:747 þ 0:113 weight þ 0:45 S2 =Res Anthropometry and BIA r 2 ¼ 0:79; RMSE ¼ 2:61 The number of participants in NHANES III available to construct the body composition distributions by age, sex Males FFM ¼ À10:678 þ 0:262 weight þ 0:652 S2 =Res and racial-ethnic groups are presented in Tables 1 – 3 along þ 0:015 Res r 2 ¼ 0:90; RMSE ¼ 3:9 kg with descriptive statistics for the measured and calculated Females FFM ¼ À9:529 þ 0:168 weight þ 0:696 S2 =Res independent variables. As expected, across racial-ethnic þ 0:016 Res r 2 ¼ 0:83; RMSE ¼ 2:9 kg groups at ages ! 14 y, mean statures and weights were larger for males than females. Within each race-ethnic Estimates for TBF and %BF for each NHANES III participant group for males and females, mean weights and BMIs were derived from their corresponding estimated FFM using increased almost consistently up to age 60 y and decreased the equations TBF ¼ weight 7 FFM and %BF ¼ TBF=weight. afterwards. The BMI means were larger among non-Hispanic black and Mexican-American females than non-Hispanic white females at almost all ages, but especially in the Statistical methods adults. Non-Hispanic black adult females had the largest Descriptive statistics including means, standard deviations mean BMI values. Among the adult males, the BMI means and standard errors for estimates of TBW, FFM, TBF and %BF were approximately equal to most ages. were calculated for defined age, sex and racial-ethnic groups. The females had larger mean estimates for Res than the The age groups were defined at 2 y intervals from 12 to 20 y males. Means estimates for S2=Res were larger for males than of age and at 10 y intervals thereafter. These means were also the females at all ages. This is consistent with an expected presented graphically with the values plotted at the middle greater fluid volume associated with a greater FFM among of each age group. The mean values for TBW, FFM, TBF and males. %BF were estimated using SAS25 and include the appropriate The Res means for non-Hispanic white females exceeded survey sampling weights to produce representative estimates those of non-Hispanic black females at all but one age group. for selected groups in the civilian, non-institutionalized The non-Hispanic white females also had larger Res means population of the US. The sample weights account for than the Mexican-American females at all but two of the sampling variability and adjust the data for differential younger age groups. There was no consistent pattern probability of selection of persons in the NHANES III com- between the non-Hispanic black and Mexican-American plex sample survey design. females in Res means as they varied by age groups. However, mean estimates for S2=Res for non-Hispanic black females Variance estimation. The means presented in this report were consistently larger than those of non-Hispanic white are based on data collected from a complex sample design, females at all but one age group, and both these groups of and techniques that account for this design were used to females had mean estimates larger than those of Mexican- estimate the standard errors of these means (ie the square American females at all age groups. root of their variance). Variance estimates based on the The non-Hispanic black males had larger Res means than complex sample design are different from and generally the non-Hispanic white males at all ages, but Res means larger than those obtained under the assumption of simple varied between the non-Hispanic black and Mexican- random sampling. SUDAAN, a statistical software package American males by age groups. This variation by age that incorporates the sample weights and accounts for the groups also existed for mean Res values between the complex sample design through Taylor Series linearization non-Hispanic white and Mexican-American males. Mean was used to estimate the design effects.26 Details of the estimates for S2=Res for non-Hispanic white males were variance estimation process are found in the Appendix. consistently larger than those of non-Hispanic black males at all but one age group, and both these groups of males had larger mean estimates than those of Mexican-American Results males at all age groups. Tests of statistical significance were not performed because the results for several of the variables are calculated esti- mates, and the objective of this paper was to present descrip- Comparative distributions of body compartments tive information only. A qualitative review of these findings Total body water and fat-free mass. As shown in Tables 4 suggests that differences among the groups conform to and 5 and Figures 1 and 2, the means for TBW and FFM findings from other large and small-scale studies. Means for within racial-ethnic groups had similar patterns across age weight, stature, BMI, Res and S2=Res are shown in Tables 1 – 3. groups. Among males, the estimated TBW and FFM means International Journal of Obesity
  • 4. Body composition estimates from NHANES III WC Chumlea et al 1599 Table 1 Selected anthropometric and impedance measures according to age and sex for non-Hispanic white people: NHANES III (Res and S2=Res computed with RJL-Valhalla conversion factor) Non-Hispanic white males Non-Hispanic white females Age groups Measurements n Mean s.d. s.e. n Mean s.d. s.e. 12 – 13.9 y Weight (kg) 88 51.7 12.3 1.5 101 52.1 13.3 1.6 Stature (cm) 88 159.6 8.4 0.9 101 157.8 8.2 1.0 BMI (kg=m2) 88 20.1 3.5 0.4 101 20.9 4.7 0.6 Res (ohms) 88 559.9 77.7 10.8 101 603.4 70.9 10.2 2 2 S =Res (cm =ohms) 88 46.8 9.9 1.3 101 41.9 6.6 1.0 14 – 15.9 y Weight (kg) 82 68.3 20.5 2.5 120 57.8 10.5 1.2 Stature (cm) 82 172.2 7.6 0.8 120 162.6 6.0 0.7 2 BMI (kg=m ) 82 23.0 6.3 0.8 120 21.9 3.8 0.4 Res (ohms) 82 494.2 60.1 8.7 120 616.1 75.0 10.0 S2=Res (cm2=ohms) 82 60.9 8.8 1.2 120 43.6 6.3 0.8 16 – 17.9 y Weight (kg) 96 70.9 13.8 1.6 104 61.1 14.5 1.7 Stature (cm) 96 177.0 7.9 0.8 104 164.5 6.6 0.8 BMI (kg=m2) 96 22.6 4.0 0.5 104 22.5 4.9 0.6 Res (ohms) 96 486.5 61.1 8.2 104 616.7 74.6 10.6 2 2 S =Res (cm =ohms) 96 65.4 9.4 1.2 104 44.6 6.3 0.9 18 – 19.9 y Weight (kg) 76 73.1 15.0 1.9 90 63.7 15.0 1.9 Stature (cm) 76 176.9 6.7 0.8 90 164.9 5.8 0.7 2 BMI (kg=m ) 76 23.3 4.2 0.6 90 23.4 5.5 0.7 Res (ohms) 76 489.5 52.7 7.9 90 592.0 70.9 10.8 S2=Res (cm2=ohms) 76 64.7 8.1 1.2 90 46.6 6.2 0.9 20 – 29.9 y Weight (kg) 384 79.2 16.6 0.9 426 63.2 14.3 0.8 Stature (cm) 384 177.5 6.7 0.3 426 163.6 6.7 0.4 BMI (kg=m2) 384 25.1 4.9 0.3 426 23.6 5.1 0.3 Res (ohms) 384 473.4 59.4 4.0 426 587.6 77.2 5.5 2 2 S =Res (cm =ohms) 384 67.7 9.9 0.6 426 46.4 7.1 0.5 30 – 39.9 y Weight (kg) 436 84.0 17.1 0.9 543 69.1 18.0 0.9 Stature (cm) 436 177.8 6.8 0.3 543 164.6 6.3 0.3 2 BMI (kg=m ) 436 26.5 4.6 0.3 543 25.5 6.5 0.3 Res (ohms) 436 463.8 60.4 3.8 543 567.2 74.1 4.7 S2=Res (cm2=ohms) 436 69.5 11.3 0.7 543 48.7 7.7 0.5 40 – 49.9 y Weight (kg) 410 86.0 17.0 0.9 454 70.7 16.8 1.0 Stature (cm) 410 177.3 6.7 0.3 454 163.4 6.1 0.3 BMI (kg=m2) 410 27.3 4.9 0.3 454 26.6 6.5 0.4 Res (ohms) 410 455.9 62.4 4.1 454 569.4 83.5 5.7 2 2 S =Res (cm =ohms) 410 70.4 11.5 0.7 454 48.0 7.9 0.5 50 – 59.9 y Weight (kg) 396 86.9 15.0 0.8 454 73.9 17.4 1.0 Stature (cm) 396 176.7 6.2 0.3 454 162.4 6.0 0.3 2 BMI (kg=m ) 396 27.8 4.6 0.3 454 28.0 6.4 0.4 Res (ohms) 396 453.6 60.7 4.0 454 559.0 80.5 5.5 S2=Res (cm2=ohms) 396 70.1 9.9 0.6 454 48.2 7.6 0.5 60 – 69.9 y Weight (kg) 465 84.9 14.7 0.8 447 70.3 15.1 0.9 Stature (cm) 465 175.3 6.3 0.3 447 160.8 6.1 0.4 BMI (kg=m2) 465 27.6 4.2 0.2 447 27.2 5.6 0.3 Res (ohms) 465 467.3 63.4 3.9 447 572.6 84.3 5.8 2 2 S =Res (cm =ohms) 465 67.0 9.9 0.6 447 46.2 7.6 0.5 70 – 79.9 y Weight (kg) 447 79.3 13.3 0.7 538 67.1 14.5 0.8 Stature (cm) 447 172.4 6.7 0.3 538 158.3 6.8 0.4 2 BMI (kg=m ) 447 26.7 4.0 0.2 538 26.7 5.3 0.3 Res (ohms) 447 470.8 62.6 3.9 538 567.9 82.1 5.2 S2=Res (cm2=ohms) 447 64.3 9.9 0.6 538 45.2 8.0 0.5 increased during adolescence in all racial-ethnic groups. A 13 to 19 y of age was not as pronounced as it was in males. progressive, but lesser increase in the adult male age groups Estimated means for TBW and FFM for females gradually followed until about age 60 y, after which the estimated increased across age groups until age 45 – 55 y after which means for TBW and FFM decreased. Females in all racial- they decreased for both. ethnic groups had comparatively lower estimates for mean Among males, estimated TBW and FFM means were gene- TBW and FFM than males. Among females, the increase from rally larger for non-Hispanic whites than non-Hispanic International Journal of Obesity
  • 5. Body composition estimates from NHANES III WC Chumlea et al 1600 Table 2 Selected anthropometric and impedance measures according to age and sex for non-Hispanic black people: NHANES III (Res and S2=Res computed with RJL-Valhalla conversion factor) Non-Hispanic black males Non-Hispanic black females Age groups Measurements n Mean s.d. s.e. n Mean s.d. s.e. 12 – 13.9 y Weight (kg) 124 52.1 16.7 1.5 156 55.1 13.3 1.2 Stature (cm) 124 157.9 10.1 1.0 156 159.6 7.3 0.7 BMI (kg=m2) 124 20.7 5.2 0.5 156 21.5 4.4 0.4 Res (ohms) 124 568.1 75.2 8.6 156 601.1 74.7 8.6 2 2 S =Res (cm =ohms) 124 45.2 10.2 1.1 156 43.1 6.3 0.7 14 – 15.9 y Weight (kg) 131 64.4 15.4 1.4 102 62.0 16.3 1.8 Stature (cm) 131 171.5 7.7 0.8 102 163.1 7.1 0.8 2 BMI (kg=m ) 131 21.8 4.7 0.4 102 23.2 5.3 0.6 Res (ohms) 131 511.2 67.3 7.5 102 608.8 90.9 12.8 S2=Res (cm2=ohms) 131 58.8 10.0 1.1 102 44.8 8.3 1.1 16 – 17.9 y Weight (kg) 126 68.7 14.5 1.3 126 64.0 15.8 1.6 Stature (cm) 126 173.8 7.2 0.7 126 163.9 7.0 0.7 BMI (kg=m2) 126 22.7 4.1 0.4 126 23.8 5.7 0.6 Res (ohms) 126 493.3 58.3 6.6 126 611.4 72.4 9.2 2 2 S =Res (cm =ohms) 126 62.3 9.9 1.1 126 44.6 6.3 0.8 18 – 19.9 y Weight (kg) 118 74.7 16.4 1.5 110 65.8 18.6 2.0 Stature (cm) 118 176.6 7.2 0.7 110 163.6 6.3 0.7 2 BMI (kg=m ) 118 23.8 4.4 0.4 110 24.6 6.7 0.8 Res (ohms) 118 480.8 61.0 7.1 110 610.9 91.2 12.4 S2=Res (cm2=ohms) 118 66.2 11.0 1.2 110 44.9 8.2 1.1 20 – 29.9 y Weight (kg) 462 82.9 20.5 1.0 510 70.4 16.7 0.8 Stature (cm) 462 177.1 7.4 0.4 510 163.7 6.1 0.3 BMI (kg=m2) 462 26.3 5.8 0.3 510 26.2 6.0 0.3 Res (ohms) 462 474.4 63.7 3.8 510 582.5 80.6 5.1 2 2 S =Res (cm =ohms) 462 67.5 11.3 0.7 510 47.0 7.5 0.5 30 – 39.9 y Weight (kg) 454 82.9 17.9 0.9 569 76.7 20.2 1.0 Stature (cm) 454 177.2 6.6 0.3 569 163.7 6.7 0.3 2 BMI (kg=m ) 454 26.4 5.4 0.3 569 28.6 7.4 0.4 Res (ohms) 454 470.4 68.0 4.1 569 561.1 81.4 4.9 S2=Res (cm2=ohms) 454 68.3 11.4 0.7 569 48.9 8.6 0.5 40 – 49.9 y Weight (kg) 339 83.6 17.2 1.0 395 81.5 21.1 1.2 Stature (cm) 339 176.5 7.3 0.4 395 164.2 6.1 0.4 BMI (kg=m2) 339 26.8 4.8 0.3 395 30.2 7.4 0.4 Res (ohms) 339 472.6 63.6 4.4 395 544.8 85.8 6.2 2 2 S =Res (cm =ohms) 339 67.3 11.0 0.7 395 50.7 8.6 0.6 50 – 59.9 y Weight (kg) 191 83.7 19.4 1.4 231 80.7 19.4 1.5 Stature (cm) 191 175.2 6.6 0.5 231 162.5 5.8 0.5 2 BMI (kg=m ) 191 27.2 5.7 0.4 231 30.6 7.1 0.6 Res (ohms) 191 472.8 77.5 7.1 231 547.8 92.7 8.7 S2=Res (cm2=ohms) 191 66.8 12.4 1.1 231 49.6 8.7 0.8 60 – 69.9 y Weight (kg) 258 80.9 16.2 1.0 258 77.6 18.3 1.3 Stature (cm) 258 173.6 6.6 0.5 258 161.1 6.3 0.5 BMI (kg=m2) 258 26.8 4.9 0.3 258 29.9 7.0 0.5 Res (ohms) 258 476.3 78.8 6.3 258 557.7 94.3 8.4 2 2 S =Res (cm =ohms) 258 65.1 11.9 0.9 258 47.8 8.4 0.7 70 – 79.9 y Weight (kg) 145 77.0 15.5 1.3 149 74.0 16.5 1.5 Stature (cm) 145 171.6 7.1 0.7 149 159.4 5.7 0.6 2 BMI (kg=m ) 145 26.2 4.8 0.4 149 29.1 6.3 0.6 Res (ohms) 145 477.8 74.6 7.9 149 551.0 89.9 10.5 S2=Res (cm2=ohms) 145 63.2 11.4 1.2 149 47.4 8.4 0.9 blacks and then Mexican-Americans (Figures 1 and 2). For with the means for non-Hispanic white and Mexican- females, estimated mean TBW and FFM values were larger for American males (Figures 1 and 2). non-Hispanic blacks than non-Hispanic whites and then The standard deviations at all the age groups for TBW were Mexican-Americans. The TBW and FFM means for non- $6 – 7 l for non-Hispanic white and Mexican-American males Hispanic black males declined at an earlier age compared and $7 – 8 l for non-Hispanic black males. For the females, International Journal of Obesity
  • 6. Body composition estimates from NHANES III WC Chumlea et al 1601 Table 3 Selected anthropometric and impedance measures according to age and sex for Mexican-American people: NHANES III (Res and S2=Res computed with RJL-Valhalla conversion factor) Mexican-American males Mexican-American females Age groups Measurements n Mean s.d. s.e. n Mean s.d. s.e. 12 – 13.9 y Weight (kg) 132 52.7 14.1 1.5 139 53.3 12.3 1.2 Stature (cm) 132 156.0 9.2 0.9 139 155.4 6.5 0.7 BMI (kg=m2) 132 21.4 4.6 0.5 139 21.9 4.5 0.5 Res (ohms) 132 568.4 73.2 9.2 139 608.6 78.9 9.5 2 2 S =Res (cm =ohms) 132 44.0 9.3 1.1 139 40.5 6.5 0.8 14 – 15.9 y Weight (kg) 108 62.5 16.6 1.9 113 56.2 10.7 1.2 Stature (cm) 108 167.2 8.5 0.9 113 157.7 6.0 0.7 2 BMI (kg=m ) 108 22.2 5.1 0.6 113 22.5 3.7 0.4 Res (ohms) 108 510.5 61.2 8.5 113 631.4 68.8 9.2 S2=Res (cm2=ohms) 108 55.9 9.8 1.3 113 40.0 5.9 0.8 16 – 17.9 y Weight (kg) 126 67.9 12.2 1.3 112 62.2 15.5 1.7 Stature (cm) 126 170.5 6.7 0.7 112 159.3 5.8 0.7 BMI (kg=m2) 126 23.3 3.7 0.4 112 24.5 5.7 0.7 Res (ohms) 126 501.0 58.7 7.6 112 600.2 79.8 10.7 2 2 S =Res (cm =ohms) 126 58.9 8.2 1.0 112 43.1 6.8 0.9 18 – 19.9 y Weight (kg) 109 72.8 13.9 1.6 90 59.6 13.1 1.6 Stature (cm) 109 171.9 6.3 0.7 90 157.7 5.7 0.7 2 BMI (kg=m ) 109 24.6 4.4 0.5 90 23.9 4.9 0.6 Res (ohms) 109 491.2 63.0 8.7 90 614.3 67.8 10.1 S2=Res (cm2=ohms) 109 61.2 8.6 1.2 90 41.0 5.5 0.8 20 – 29.9 y Weight (kg) 631 73.9 13.9 0.7 509 64.8 14.5 0.8 Stature (cm) 631 170.0 6.4 0.3 509 157.6 6.2 0.3 BMI (kg=m2) 631 25.6 4.2 0.2 509 26.1 5.5 0.3 Res (ohms) 631 480.0 59.9 3.5 509 586.4 79.6 5.1 2 2 S =Res (cm =ohms) 631 61.0 9.1 0.5 509 43.1 6.6 0.4 30 – 39.9 y Weight (kg) 443 78.4 14.2 0.8 451 70.6 17.1 1.0 Stature (cm) 443 170.6 7.0 0.4 451 156.9 6.3 0.4 2 BMI (kg=m ) 443 26.9 4.3 0.2 451 28.6 6.4 0.4 Res (ohms) 443 469.7 59.8 4.1 451 554.1 76.4 5.2 S2=Res (cm2=ohms) 443 63.1 9.9 0.7 451 45.3 7.2 0.5 40 – 49.9 y Weight (kg) 361 82.0 14.5 0.9 334 73.4 13.9 0.9 Stature (cm) 361 169.7 6.3 0.4 334 157.2 5.4 0.4 BMI (kg=m2) 361 28.4 4.4 0.3 334 29.7 5.6 0.4 Res (ohms) 361 453.0 58.5 4.5 334 549.1 75.6 5.9 2 2 S =Res (cm =ohms) 361 64.7 9.8 0.7 334 45.8 6.6 0.5 50 – 59.9 y Weight (kg) 165 82.6 15.1 1.4 171 71.3 13.7 1.2 Stature (cm) 165 169.3 6.0 0.5 171 155.7 5.4 0.5 2 BMI (kg=m ) 165 28.7 4.5 0.4 171 29.5 5.5 0.5 Res (ohms) 165 449.3 62.7 7.1 171 549.0 81.0 8.8 S2=Res (cm2=ohms) 165 65.1 10.7 1.2 171 45.1 7.0 0.7 60 – 69.9 y Weight (kg) 301 78.2 12.7 0.9 278 70.0 14.1 1.0 Stature (cm) 301 168.3 6.0 0.4 278 154.3 5.9 0.4 BMI (kg=m2) 301 27.6 4.0 0.3 278 29.5 5.9 0.4 Res (ohms) 301 469.3 63.9 5.4 278 548.1 78.5 6.7 2 2 S =Res (cm =ohms) 301 61.5 9.1 0.7 278 44.4 7.3 0.6 70 – 79.9 y Weight (kg) 118 72.3 12.5 1.4 101 65.0 13.0 1.5 Stature (cm) 118 165.5 5.7 0.6 101 153.0 5.9 0.7 2 BMI (kg=m ) 118 26.3 4.0 0.4 101 27.8 5.5 0.7 Res (ohms) 118 486.1 68.8 9.1 101 568.8 80.2 11.4 S2=Res (cm2=ohms) 118 57.6 9.6 1.2 101 42.1 7.1 1.0 the standard deviations were $4 – 5 l for non-Hispanic white deviations at all the age groups for FFM were $9 – 10 kg for and Mexican-American females and $5 – 6 l for non- non-Hispanic white males, $8 – 9 kg for Mexican-American Hispanic black females. This same pattern of larger standard males and $9 – 11 kg for non-Hispanic black males. For the deviations in non-Hispanic blacks also occurred for FFM, but females, the standard deviations were $5 – 6 kg for non- here the standard deviations for non-Hispanic whites were Hispanic white females $5 – 6 kg for Mexican-American larger than those of the Mexican-Americans. The standard females and $5 – 8 kg for non-Hispanic black females. International Journal of Obesity
  • 7. Body composition estimates from NHANES III WC Chumlea et al 1602 Table 4 Total body water (l) according to age, sex and ethnicity: NHANES III Non-Hispanic white Non-Hispanic black Mexican-American Age (y) Mean s.d. s.e. Mean s.d. s.e. Mean s.d. s.e. Males 12 – 13.9 31.3 6.3 0.8 30.7 7.0 0.7 30.2 6.2 0.7 14 – 15.9 40.6 7.0 0.9 38.9 6.7 0.7 37.2 6.9 0.9 16 – 17.9 43.1 6.2 0.8 41.2 6.6 0.7 39.6 5.5 0.6 18 – 19.9 43.2 5.8 0.8 44.1 7.5 0.8 41.5 5.9 0.7 20 – 29.9 45.5 6.9 0.4 46.1 8.0 0.4 41.6 6.1 0.3 30 – 39.9 47.2 7.6 0.4 46.5 7.7 0.4 43.4 6.5 0.4 40 – 49.9 48.0 7.8 0.5 46.1 7.5 0.5 44.7 6.6 0.5 50 – 59.9 47.9 6.5 0.4 45.9 8.5 0.7 45.0 7.1 0.7 60 – 69.9 46.2 6.6 0.4 44.7 7.7 0.5 42.6 5.9 0.4 70 – 79.9 44.0 6.4 0.4 43.2 7.4 0.7 39.9 6.3 0.7 Females 12 – 13.9 28.5 4.2 0.6 29.3 4.1 0.4 27.9 4.2 0.5 14 – 15.9 29.9 3.7 0.5 30.9 5.3 0.7 28.1 3.7 0.4 16 – 17.9 30.7 4.0 0.5 31.0 4.2 0.5 30.2 4.5 0.6 18 – 19.9 31.9 4.2 0.6 31.4 5.5 0.7 28..9 3.7 0.5 20 – 29.9 31.8 4.5 0.3 32.8 4.9 0.3 30.5 4.3 0.2 30 – 39.9 33.5 5.1 0.3 34.4 5.8 0.3 32.2 4.8 0.3 40 – 49.9 33.3 5.2 0.3 35.8 6.0 0.4 32.6 4.3 0.3 50 – 59.9 33.8 5.1 0.3 35.2 5.8 0.5 32.1 4.4 0.4 60 – 69.9 32.5 4.8 0.3 34.0 5.6 0.4 31.6 4.6 0.4 70 – 79.9 31.6 4.9 0.3 33.4 5.3 0.6 30.1 4.4 0.6 Total body fat and percentage body fat. As presented in followed by Mexican-American and then non-Hispanic Tables 6 and 7 and Figures 3 and 4, females had larger white females. Plots of these TBF means by sex, race and estimated TBF and %BF means than males at all ages. the selected age groups are presented in Figure 3. Between 13 Across racial-ethnic groups, TBF means for males did not and 19 y of age, Mexican-American males tended to have shown any appreciable differences. In contrast, estimates for larger TBF means than non-Hispanic white and black males, TBF means were largest for non-Hispanic black females, after which these differences were small except for 25 y of age. Table 5 Fat-free mass (kg) according to age, sex and ethnicity: NHANES III Non-Hispanic white Non-Hispanic black Mexican-American Age (y) Mean s.d. s.e. Mean s.d. s.e. Mean s.d. s.e. Males 12 – 13.9 41.8 8.2 1.0 40.9 9.3 0.9 40.3 8.2 0.9 14 – 15.9 54.3 9.6 1.2 52.2 9.0 0.9 49.8 9.3 1.2 16 – 17.9 57.8 8.4 1.0 55.3 8.9 0.9 53.0 7.5 0.9 18 – 19.9 58.0 8.0 1.1 59.2 10.2 1.0 55.7 8.0 1.0 20 – 29.9 61.3 9.5 0.6 62.2 11.1 0.6 55.7 8.3 0.4 30 – 39.9 63.6 10.5 0.6 62.6 10.5 0.5 58.1 8.9 0.5 40 – 49.9 64.6 10.6 0.6 62.2 10.3 0.6 59.8 8.9 0.6 50 – 59.9 64.6 8.8 0.5 61.9 11.5 0.9 60.2 9.6 1.0 60 – 69.9 62.3 8.9 0.5 60.1 10.3 0.7 57.0 7.9 0.6 70 – 79.9 59.1 8.6 0.5 58.0 10.0 0.9 53.1 8.3 1.0 Females 12 – 13.9 38.1 5.6 0.7 39.3 5.5 0.5 37.3 5.3 0.6 14 – 15.9 40.4 4.8 0.6 41.8 7.0 0.9 37.8 4.8 0.6 16 – 17.9 41.6 5.5 0.7 42.0 5.6 0.6 40.5 6.0 0.7 18 – 19.9 43.1 5.6 0.8 42.6 7.1 0.8 38.8 4.9 0.7 20 – 29.9 42.8 5.9 0.4 44.3 6.5 0.4 40.8 5.6 0.3 30 – 39.9 45.0 6.9 0.4 46.4 7.8 0.4 42.8 6.4 0.4 40 – 49.9 44.8 6.9 0.4 48.2 7.9 0.5 43.5 5.5 0.4 50 – 59.9 45.4 6.7 0.4 47.3 7.6 0.6 42.6 5.8 0.6 60 – 69.9 43.6 6.3 0.4 45.7 7.3 0.6 41.9 6.0 0.5 70 – 79.9 42.3 6.5 0.4 44.7 6.8 0.7 39.8 5.6 0.7 International Journal of Obesity
  • 8. Body composition estimates from NHANES III WC Chumlea et al 1603 Table 6 Total body fat (kg) according to age, sex and ethnicity: NHANES III Non-Hispanic white Non-Hispanic black Mexican-American Age (y) Mean s.d. s.e. Mean s.d. s.e. Mean s.d. s.e. Males 12 – 13.9 10.0 6.0 0.7 11.2 9.1 0.9 12.3 7.5 0.8 14 – 15.9 14.0 12.2 1.6 12.2 8.4 0.9 12.6 8.9 1.1 16 – 17.9 13.1 7.5 0.9 13.4 7.3 0.8 14.9 6.1 0.7 18 – 19.9 15.1 8.5 1.1 15.5 7.9 0.8 17.1 7.2 0.9 20 – 29.9 17.9 8.7 0.5 20.7 11.4 0.6 18.3 7.3 0.4 30 – 39.9 20.4 8.5 0.5 20.3 9.5 0.5 20.3 7.1 0.4 40 – 49.9 21.3 8.5 0.5 21.4 8.7 0.6 22.2 7.3 0.5 50 – 59.9 22.3 8.3 0.5 21.8 9.7 0.8 22.4 7.1 0.7 60 – 69.9 22.7 7.7 0.4 20.7 8.3 0.6 21.2 6.7 0.5 70 – 79.9 20.3 6.8 0.4 19.3 7.7 0.7 19.2 5.8 0.7 Females 12 – 13.9 14.0 8.7 1.0 15.8 8.7 0.8 16.0 7.6 0.8 14 – 15.9 17.4 6.9 0.8 20.2 10.1 1.1 18.4 6.9 0.8 16 – 17.9 19.5 10.1 1.2 22.0 11.4 1.1 21.6 10.3 1.2 18 – 19.9 20.6 10.3 1.3 23.2 12.6 1.3 20.7 8.9 1.1 20 – 29.9 20.5 9.6 0.6 26.0 11.3 0.6 24.1 9.8 0.5 30 – 39.9 24.1 12.3 0.6 30.4 13.5 0.6 27.8 11.5 0.6 40 – 49.9 25.9 10.9 0.6 33.3 14.1 0.8 29.9 9.4 0.6 50 – 59.9 28.6 11.6 0.7 33.4 12.9 1.0 28.7 9.0 0.8 60 – 69.9 26.7 9.9 0.6 31.9 12.1 0.8 28.1 9.3 0.7 70 – 79.9 24.8 9.3 0.5 29.3 10.8 1.0 25.2 8.8 1.0 Non-Hispanic black females had larger TBF means than consistently for all males and females with each older age Mexican-American and non-Hispanic white females at category until about 55 – 65 y of age. Afterwards, there was a almost all ages, and this difference was greater after 25 y of consistent decline in TBF means in both sexes. age. At the same time, Mexican-American females also had Estimates for mean %BF were slightly larger for Mexican- larger TBF means than non-Hispanic white females at most American males than for non-Hispanic white or non- ages. In the plots for all age groups, mean TBF increased Hispanic black males where estimates for mean %BF were Table 7 Percentage body fat according to age, sex and ethnicity: NHANES III Non-Hispanic white Non-Hispanic black Mexican-American Age (y) Mean s.d. s.e. Mean s.d. s.e. Mean s.d. s.e. Males 12 – 13.9 18.4 7.3 1.0 19.5 8.9 1.1 22.0 8.2 1.0 14 – 15.9 18.4 8.3 1.2 17.8 7.5 9.0 18.8 7.7 1.1 16 – 17.9 17.7 6.8 0.9 18.6 6.4 0.8 21.3 5.4 0.7 18 – 19.9 19.6 6.9 1.0 19.9 6.0 0.8 22.7 5.7 0.8 20 – 29.9 21.8 6.2 0.4 23.7 7.0 0.4 24.1 6.0 0.4 30 – 39.9 23.6 5.8 0.4 23.6 6.7 0.4 25.4 5.4 0.4 40 – 49.9 24.2 5.7 0.4 24.9 6.1 0.5 26.6 5.3 0.4 50 – 59.9 25.1 6.0 0.4 25.1 6.7 0.7 26.7 5.3 0.6 60 – 69.9 26.2 5.5 0.3 24.9 6.6 0.6 26.7 5.2 0.4 70 – 79.9 25.1 5.5 0.3 24.3 6.3 0.7 26.1 5.2 0.7 Females 12 – 13.9 24.8 9.7 1.2 26.9 8.8 0.8 28.6 7.6 0.8 14 – 15.9 29.1 6.5 0.8 30.9 8.0 0.9 31.8 6.3 0.7 16 – 17.9 30.7 6.9 0.9 32.6 8.5 0.9 33.3 7.1 0.8 18 – 19.9 30.8 7.9 1.0 33.3 8.7 1.0 33.5 6.8 0.9 20 – 29.9 31.0 7.5 0.5 35.5 7.5 0.4 35.8 7.0 0.4 30 – 39.9 33.0 8.5 0.5 38.0 7.7 0.4 38.0 7.1 0.4 40 – 49.9 35.4 6.9 0.4 39.4 7.0 0.4 39.9 5.5 0.4 50 – 59.9 37.3 7.1 0.4 40.0 7.5 0.6 39.4 5.7 0.5 60 – 69.9 36.9 6.9 0.4 39.8 6.9 0.5 39.4 5.7 0.4 70 – 79.9 35.9 6.9 0.4 38.5 6.7 0.6 37.8 6.8 0.8 International Journal of Obesity
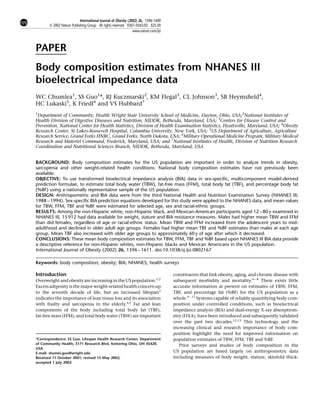
  • 9. Body composition estimates from NHANES III WC Chumlea et al 1604 Figure 2 Estimated means for fat-free mass (FFM) by 2 y age groups from 12 to 20 y and by 10 y age groups from 20 to 80 y for non-Hispanic Figure 1 Estimated means for total body water (TBW) by 2 y age white (W), non-Hispanic black (B) and Mexican-American (M) males and groups from 12 to 20 y and by 10 y age groups from 20 to 80 y for females. non-Hispanic white (W), non-Hispanic black (B) and Mexican-American (M) males and females. Between 13 and 19 y of age, Mexican-American females had quite similar across age groups. However, estimated %BF larger %BF means than non-Hispanic black and white means were noticeably similar across adult ages for non- females and non-Hispanic black females had larger means Hispanic black and Mexican-American females. Non-Hispa- than non-Hispanic white females. After the 19 y age group, nic whites had the lowest estimated %BF means at all ages. there were small differences in %BF means between Plots of these %BF means by sex, race and the selected age Mexican-American and non-Hispanic black females, both groups are presented in Figure 4. The %BF means reflect to of which were larger than the %BF means for non-Hispanic some degree the sex, ethnic and age patterns for TBF. white females. For all race groups, mean %BF increases with These sex differences were greatest for non-Hispanic blacks each older age category until about 55 – 65 y of age. After- then Mexican-Americans and non-Hispanic whites. At the wards, %BF means declined, but this decline was not as steep 25 y age category, the mean %BF for males was about as it was for TBF means at the same ages. The exception was 21 – 23%, but in females the means were 30 – 35%. At the for males between 13 and 19 y where %BF means decreased 13 y age group, girls were on average as fat as males would and then increased for Mexican-Americans or remained ever get. approximately stable for non-Hispanic white and black Between 13 and 19 y of age, Mexican-American males had males. Between the 13 and 55 y age groups, mean %BF for larger %BF means than non-Hispanic white and black males males increased about 5 – 7 percentage points, while in at all ages. At most other ages, there were small differences females the corresponding increase was about 11 – 13 between non-Hispanic black and white males in %BF means. percentage points. International Journal of Obesity
  • 10. Body composition estimates from NHANES III WC Chumlea et al 1605 Figure 3 Estimated means for total body fat (TBF) by 2 y age groups Figure 4 Estimated means for percentage body fat (%BF) by 2 y age from 12 to 20 y and by 10 y age groups from 20 to 80 y for non-Hispanic groups from 12 to 20 y and 10 y age groups from 20 to 80 y for non- white (W), non-Hispanic black (B) and Mexican-American (M) males and Hispanic white (W), non-Hispanic black (B) and Mexican-American (M) females. males and females. Discussion Standard deviations for TBF were $6 – 8 kg for non- The application of the selected equations22 to the NHANES Hispanic white males, $5 – 6 kg for Mexican-American III BIA data presents for the first time estimates of national males and $7 – 9 kg for non-Hispanic black males. For the distributions for TBW, FFM, TBF and %BF for non-Hispanic females, the standard deviations were $8 – 11 kg for non- whites and blacks and Mexican-Americans from 12 to 80 y of Hispanic white females, $8 – 10 kg for Mexican-American age. The selected equations are the most accurate and precise females and $10 – 14 kg for non-Hispanic black females. available for predicting TBW and FFM, and they are reason- This same pattern of larger standard deviations in non- ably generalizable for individuals with body composition Hispanic blacks again occurred for %BF, but here the values at the extremes of the distribution.22 standard deviations for non-Hispanic whites were larger The patterns of the means for TBW, FFM, TBF and %BF than those of the Mexican-Americans. The standard across the age groups reflect expected associations with age deviations at all the age groups for %BF were $5 – 7% for and sex. These patterns with age demonstrate sex differences non-Hispanic white males, $5 – 6% for Mexican-American in the growth of these body constituents or the changes that males and $6 – 7% for non-Hispanic black males. For the occur during adulthood with the aging process. The large females, the standard deviations were $7 – 8% for non- means for TBF and %BF reflect the high prevalence of obesity Hispanic white females $5 – 7% for Mexican-American that has been reported previously using the NHANES III BMI females and $7 – 8% for non-Hispanic black females. data.1,2 International Journal of Obesity
  • 11. Body composition estimates from NHANES III WC Chumlea et al 1606 Body composition distributions females compared with non-Hispanic white females. The Similar to other reports, males in this study generally have a TBF and %BF means from NHANES III data are consistent larger estimated mean TBW and FFM than females, who have with the previously reported high prevalence of overweight1,2 larger estimated TBF and %BF means than males.27,28 The and shifts in the BMI distribution observed between NHANES estimated means values from ages 12 – 20 y demonstrate the II and NHANES III.38 However, it is not appropriate to deter- sex and age relationships with body composition that occur mine the prevalence of obesity from these mean estimates for during adolescent growth.29 Mean TBF increases during TBF and %BF in the absence of definite cut-off criteria.37 adolescence, but the effects of the relatively greater accretion These mean reference values are not an indication of an of FFM in males than females result in a decline in estimated ideal or desirable level of FFM, TBW, TBF or %BF, and should mean %BF for males around 14 – 16 y of age. Mean TBF be used cautiously as comparative reference data. The mean increases through adulthood. There is also an increase in BMI for adult men (BMI ¼ 26.6) and women (BMI ¼ 26.5)1 mean FFM through much of adulthood but a decline is currently exceeds the recommended BMI threshold for observed at the oldest age groups.30 These are not serial healthy weight (BMI < 25.0).39 Similarly, the mean %BF for data, so the contrast between means at adjacent age groups adult men and women exceeds the threshold of %BF values may reflect actual trends in the changes in these body that indicate obesity at a BMI > 30.0 in men (%BF > 25%) composition estimates or, alternatively, differences between and women (%BF > 39%),37 beginning at age 50 – 59 y in the samples comprising the several age groups. non-Hispanic white and black men, at age 30 – 39 y in Overall, the racial-ethnic differences between non- Mexican-American men and at age 40 – 49 y in non-Hispanic Hispanic white and non-Hispanic black females conform to black and Mexican-American women. The highest mean previously reported differences for smaller samples. Non- estimate for %BF in non-Hispanic white women was 37.3% Hispanic black females had slightly larger mean values for at ages 50 – 59 y. TBW, FFM, TBF and=or %BF than non-Hispanic white One new aspect of these data is the availability of TBW females,9,28,31 – 34 even though the prediction equations means. Prior to the present investigation, only small sets of tended to under-estimate TBW and FFM in non-Hispanic TBW reference data were available31 and most of these blacks.22 Similar comparisons with Mexican-American databases have limited application to the general US popula- females are very limited.28,34 Reported ethnic differences in tion. These TBW means provide a general reference for the body composition between non-Hispanic white and non- US population by sex, age and race-ethnicity at the time the Hispanic black adult males differ from the present findings. NHANES III was conducted (1988 – 1994). Others report that non-Hispanic black males have larger The FFM means provide a limited reference to assist in amounts of TBW than non-Hispanic white males.31,35 determining the degree of sarcopenia or muscle loss among Similar differences in FFM or its equivalent between non- the elderly.10 Low muscle mass is a major contributor to the Hispanic whites and non-Hispanic blacks have been reported loss of functional ability and health.40 One limitation in by Ellis,28,34 but several other investigators have not found defining or in establishing a diagnosis of sarcopenia has been such differences to be statistically significant.9,36 Comparisons the absence of a sex-, age- and racial-ethnic-specific FFM with Mexican-American males have been few.28,34 Except for reference.10 The present findings provide national estimates possible differences in bone mineral, racial-ethnic differ- as a reference to compare with results from other studies of ences in these means for TBW, FFM, and TBF at an age or body composition, particularly FFM, in the elderly and across age are not clear at a population level. A reason for this persons with weight-related chronic disease. lack of clarity is insufficient body composition data from any racial-ethnic group other than non-Hispanic whites. The present body composition estimates were derived Study limitations from prediction equations, and they are subject to estima- These reported body composition estimates are not based tion errors. Comparisons of these findings across racial- on criterion measures. The mean estimates were calculated ethnic groups should be judged accordingly. The standard from predicted values from the bioelectrical impedance Res deviations for the means for TBW, FFM, TBF and %BF values and stature in NHANES III. The Valhalla Res values approximate the normal range for these variables in the were translated into their RJL equivalents (see Appendix), population. This range is reasonably constant from one age and then TBW and FFM were predicted through regression group to the next within racial-ethnic groups. However, the equations. In the conversion sample, there was a very small standard deviations reported are calculated for estimated not consistent difference between RJL and Valhalla Res mea- measured values and therefore may underestimate the true sures of 2.5 ohms for males and 9.6 ohms for females variability in the data. (Appendix, Figure 1). The high r2 values for these conver- sions are identical to previously reported correlations for Res between Valhalla and RJL impedance analyzers.44 Body composition changes in the population Others have reported larger systematic differences between One observation from these mean distributions is the high level Valhalla and RJL analyzers for Res values45 than were noted of %BF among non-Hispanic black and Mexican-American in the present conversions. However, the present systematic International Journal of Obesity
  • 12. Body composition estimates from NHANES III WC Chumlea et al 1607 differences in Res between Valhalla and RJL impedance values compared with the mean estimates presented in this analyzers for males and females are less than the reported report. variation in repeated measures of Res using a single impe- The findings in this report conform to the many existing dance machine.46 – 48 relationships of body composition with age and sex. What is In the prediction equations, TBW was estimated from new, is the availability of these mean estimates for TBW, isotope dilution, and FFM was estimated with a multi- FFM, TBF and %BF along with their corresponding distribu- compartment model based on densitometry, TBW and tions at specific age categories and the availability of these bone mineral content from dual-energy X-ray absorptiome- data for the three racial-ethnic groups in the NHANES III. try using pooled data from large convenience samples from These means and standard deviations provide a picture of multiple study centers.22 TBF and %BF were then estimated specific aspects of body composition that could only be from FFM and weight. In each of these steps, validity errors inferred from the NHANES III BMI data. The newest informa- can be potentially introduced. tion from the present analysis is the estimates for mean TBW, The reported mean body composition values are estimates FFM, TBF and %BF for Mexican-American males and females. about which there is variation as a function of the several These limited data have not been available in the past. methods and samples used. The magnitude of this variation Measured values for TBW, FFM, TBF and %BF determined is difficult to quantify, but is assumed to be equivalent to the by DXA, hydrostatic weighing, or data collected using other pure errors from the cross validation of the prediction reference body composition methods in other studies can be equations.22 Pure errors for the TBW and FFM equations are compared with the means reported for the NHANES III $4 l or kg for males and $3 l or kg for females. Cross- sample. Systematic differences among body composition validation results indicated that the equations applied in methods and the between-method limits of agreement are this study slightly over-predict TBW by $0.7 and 0.6 l and approximately 2.0 kg for FFM and 3 – 5% for %BF,27,42 and FFM by $0.3 and 0.6 kg for males and females, respectively. should be considered when interpreting the data or making The equations used to predict TBW tend to underestimate inferences. TBW in black males ($2 l) and females ($1.4 l) and over- This study presents descriptive summary distributions for estimate TBW in white males ($0.5 l) and females ($0.3 l). body composition estimates derived from the 1988 – 1994 The FFM equations tend to underestimate FFM in black NHANES III. In the future, improved estimates of FFM and males ($2.1 kg) and females ($1.6 kg) and overestimate TBF may become available. The present descriptive data FFM in white males ($0.4 kg) and females ($0.3 kg). These should be regarded as interim results and should be applied estimates may be acceptable for comparisons within racial- and referenced with an awareness of the identified potential ethnic groups, but should be used cautiously in comparisons caveats. across racial-ethnic groups. There are other possible limitations. BIA prediction equa- tions have limitations similar to those of skinfold prediction Acknowledgement equations including large standard errors of the estimates We gratefully acknowledge Katalin Losonczy and Margaret and population specificity.41 The BIA prediction equations Carroll for their computer programming to calculate the were applied to Mexican-American participants in NHANES reported means and complex sample variance estimates. III but were neither derived nor validated independently on Supported by funding from the Centers for Disease Control samples of Mexican-Americans so the validity of these equa- and Prevention, the US Army Medical Research and Materiel tions for this group is unknown. There were also a few non- Command, the Nutritional Services Branch, the National Hispanic blacks available in the samples used to develop the Institute of Diabetes and Digestive and Kidney Diseases prediction equations resulting in potential bias for estimates and grants HD-27063, HD-12252 and HL-53404 from the among this group. Also, the performance of the prediction National Institutes of Health. Mention of a trademark or equations when applied to the NHANES III data could not be proprietary product does not constitute a guarantee of war- independently verified. ranty of the product by the United States Department of Agriculture and does not imply its approval to the exclusion of other products that may also be suitable. US Department Conclusion of Agriculture, Agricultural Research Service, Northern These mean body composition estimates (Tables 4 – 7 and Plains Area is an equal opportunity=affirmative action Figures 1 – 4) are the first provided for the US population. employer and all agency services are available without NHANES III did not have criterion body composition mea- discrimination. sures, but the availability of 50 kHz BIA data allowed the estimation of TBW, FFM, TBF and %BF using externally derived equations based on isotope dilution for TBW and References multicomponent models for FFM. These prediction equa- 1 Kuczmarski RJ, Flegal K, Campbell S, Johnson CL. Increasing tions for TBW and FFM22 can be applied to other population prevalence of overweight among US adults. JAMA 1994; 272: groups in the US, and the calculated TBW, FFM, TBF or %BF 205 – 211. International Journal of Obesity
  • 13. Body composition estimates from NHANES III WC Chumlea et al 1608 2 Flegal KM, Carroll MD, Kuczmarski RJ, Johnson CL. Overweight 25 SAS I. SAS Procedures Guide, Version 6, 3rd edn SAS Institute Inc.: and obesity in the United States: prevalence and trends, Cary, NC; 1990. 1960 – 1994. Int J Obes Relat Metab Disord 1998; 22: 39 – 47. 26 Shah BV, Barnwell BG, Bieler GS. SUDAAN User’s manual, Release 3 National Center for Health Statistics. NCHS Public Health 6.40.: Research Triangle Institute: Research Triangle Park, NC; Service. Health United States.: US Government Printing Office: 1995. Washington, DC; 2000. 27 Forbes G. Growth, aging nutrition, and activity. In:. Human body 4 Chumlea WC, Guo SS, Glaser RM, Vellas B. Sarcopenia, function composition.: Springer: New York; 1987. and health. Nutr Hlth Aging 1997; 1: 7 – 12. 28 Ellis KJ (ed). The reference child and adolescent models of body 5 Lukaski H. Sarcopenia: assessment of muscle mass. J Nutr 1997; composition: a contemporary comparison.: Annals of New York 127: 994S – 997S. Academy of Science: New York; 2000. 6 Allison DB, Zannolli R, Faith MS, et al. Weight loss increases 29 Guo SS, Zeller C, Chumlea WC, Roche AF, Siervogel RM. Body and fat loss decreases all-cause mortality rate: results from two composition and secular trends in children and young independent cohort studies. Int J Obes Relat Metab Disord 1999; adults: the Fels Longitudinal Study 1929 – 1996. Am J Clin Nutr 23: 603 – 611. 1997; 66: 220. 7 Kannel W, Cupples L, Ramaswami R, Stokes J, Kreger B, Higgins M. 30 Baumgartner RN, Stauber PM, Mchugh, D, Koehler KM, Garry PJ. Regional Obesity and Risk of Cardiovascular Disease — the Cross-sectional age differences in body composition in person Framingham Study. J Clin Epidemiol 1991; 44: 183 – 190. 60 þ years of age. J Gerontol Ser A Biol Sci Med 1995; 50: 8 Steen B. Body water in the elderly — a review. J Nutr Hlth Aging M307 – M316. 1997; 1: 142 – 145. 31 Chumlea WC, Guo SS, Zeller CM, et al. Total body water 9 Gallagher D, Visser M, Sepulveda D, Pierson RN, Harris T, reference values and prediction equations for adults. Kidney Int Heymsfield SB. How useful is body mass index for comparison 2001; 59: 2250 – 2258. of body fatness across age, sex, and ethnic groups. Am J Epidemiol 32 Malina R, Little B, Buschang P. Estimated body composition and 1996; 143: 228 – 239. strength of chronically mild-to-moderately undernourished rural 10 Chumlea WC, Vellas B, Guo SS. Malnutrition or healthy senes- boys in Southern Mexico. Hum Growth Phys Fit Nutr 1991; 31: cence. Proc Nutr Soc 1998; 57: 593 – 598. 119 – 132. 11 Kuczmarski MF, Kuczmarski R, Najjar M. Descriptive anthro- 33 Aloia JF, Mikhail M, Pagan CD, Arunachalam A, Yeh JK, pometric reference data for older Americans. J Am Diet Assoc Flaster E. Biochemical and hormonal variables in black and 2000; 100: 59 – 66. white women matched for age and weight. J Lab Clin Med 1998; 12 Schoeller DA (ed). Bioelectrical impedance analysis: what does it 132: 383 – 389. measure?, Annals of the New York Academy of Sciences: New York; 34 Ellis KJ. Body composition of a young, multiethnic, male popula- 2000. tion. Am J Clin Nutr 1997; 66: 1323 – 1331. 13 Lohman TG, Harris M, Teixeira PJ, Weiss L (eds). Assessing body 35 Ellis K. Reference man and woman more fully characterized — composition and changes in body composition.: Annals of the variations on the basis of body size, age, sex, and race. Biol Trace New York Academy of Sciences: New York; 2000. Elem Res 1990; 26: 385 – 400. 14 National Institutes of Health. Bioelectrical impedance analysis in 36 Barondess DA, Nelson DA, Schlaen SE. Whole body bone, fat, and body composition measurement. Am J Clin Nutr 1996; 64: lean mass in black and white men. J Bone Miner Res 1997; 12: 524S – 532S. 967 – 971. 15 US Department of Health and Human Services. National center 37 Gallagher D, Heymsfield SB, Heo M, Jebb SA, Murgatroyd PR, for health statistics. The Third National Health and Nutrition Sakamoto Y. Healthy percentage body fat ranges: an approach for Examination Survey (NHANES III, 1988 – 1994).: Centers for Disease developing guidelines based on body mass index. Am J Clin Nutr Control and Prevention: Washington, DC; 1996. 2000; 72: 694 – 701. 16 Lukaski H, Johnson P, Bolonchuk W, Lykken G. Assessment of fat- 38 Flegal K, Troiano RP. Changes in the distribution of body mass free mass using bioelectrical impedance measurements of the index of adults and children in the US population. Int J Obes Relat human body 1,2. Am J Clin Nutr 1985; 41: 810 – 817. Metab Disord 2000; 24: 807 – 818. 17 Chumlea WC, Guo S. Bioelectrical impedance and body compo- 39 WHO. Obesity: preventing and Managing the global epidemic.: Report sition: present status and future directions. Nutr Rev 1994; 52: of a WHO Consultation on Obesity. WHO: Geneva; 1997. 123 – 131. 40 Dutta C, Hadley EC, Lexell J. Sarcopenia and physical perfor- 18 Cordain L, Whicker R, Johnson J. Body composition determina- mance in old age: overview.. Muscle Nerve 1997; 5(Suppl): S5 – 9. tion in children using bioelectrical impedance. Growth Devl Aging 41 Roubenoff R. Applications of bioelectrical impedance analysis 1988; 52: 37 – 40. for body composition to epidemiologic studies. Am J Clin Nutr 19 Kushner R, Schoeller D. Estimation of total body water by bio- 1996; 64: 459S – 462S. electrical impedance analysis. Am J Clin Nutr 1986; 44: 417 – 424. 42 Lohman T, Going S, Pamenter R, et al. Effects of resistance 20 Wang J, Thornton J, Burastero S, Heymsfield S, Pierson R. Bio- training on regional and total bone mineral density in premeno- impedance analysis for estimation of total body potassium, total pausal women: a randomized prospective study. J Bone Miner Res body water, and fat-free mass in white, black, and Asian adults. 1995; 10: 1015 – 1024. Am J Hum Biol 1995; 7: 33 – 40. 43 Roche AF. Growth, maturation and body composition: the Fels 21 Ellis KJ, Bell SJ, Chertow GM, et al. Bioelectrical impedance Longitudinal Study 1929 – 1991.: Cambridge University Press: methods in clinical research: a follow-up to the NIH Technology Cambridge; 1992. Assessment Conference. Nutrition 1999; 15: 874 – 880. 44 Gray D, Bray GA, Gemayel N, Kaplan K. Effect of obesity on 22 Guo SS, Chumlea WC, Heymsfield SB, et al. Development of bioelectrical impedance. Am J Clin Nutr 1989; 49: 255 – 260. bioelectrical impedance prediction equations for body composi- 45 Deurenberg P, Smit HE, Kusters CSL. Is the bioelectrical impe- tion using a multicomponent model for use in epidemiological dance method suitable for epidemiological field studies? Eur J Clin surveys. Am J Clin Nutr (in press). Nutr 1989; 43: 647 – 654. 23 US Department of Health and Human Services. National Center 46 Roche A, Chumlea W, Guo S. Identification=validation of new for Health Statistics. NHANES III Anthropometric Procedure Video, anthropometric techniques for quantifying body composition, Stock no. 017-022-01355-5. U.S. Government Printing Office: TR-86=058. US Army Natick Research and Development Center: Washington, DC; 1996. Natick, MA; 1986. 24 Kuczmarski RJ, Chumlea WC. Bioelectrical impedance analysis 47 Jackson A, Pollock M, Graves J, Mahar M. Reliability and validity measurements as part of a national nutrition survey. Am J Clin of bioelectrical impedance in determining body composition. Nutr 1996; 64: 453S – 458S. J Appl Physiol 1988; 64: 529 – 534. International Journal of Obesity