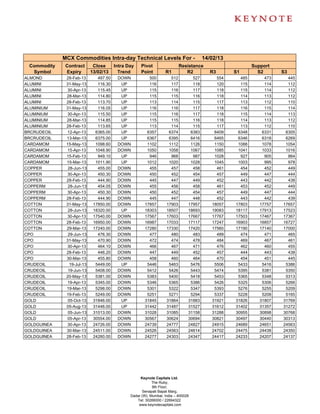
2. MCX Commodities Intra-day Technical Levels For - 14/02/13
Commodity Contract Close Intra Day Pivot Resistance Support
Symbol Expiry 13/02/13 Trend Point R1 R2 R3 S1 S2 S3
GOLDM 04-May-13 30835.00 DOWN 30845 30890 30944 31043 30791 30746 30647
GOLDM 05-Apr-13 30571.00 DOWN 30584 30637 30704 30824 30517 30464 30344
GOLDM 05-Mar-13 30259.00 DOWN 30280 30339 30418 30556 30201 30142 30004
GOLDPETAL 30-Apr-13 3088.00 DOWN 3089 3092 3095 3101 3086 3083 3077
GOLDPETAL 30-Mar-13 3061.00 DOWN 3063 3067 3073 3083 3057 3053 3043
GOLDPETAL 28-Feb-13 3031.00 DOWN 3033 3037 3043 3053 3027 3023 3013
GOLDPTLDEL 28-Feb-13 3049.00 DOWN 3049 3058 3067 3085 3040 3031 3013
GOLDPTLDEL 30-Mar-13 3080.00 UP 3079 3087 3093 3107 3073 3065 3051
GOLDPTLDEL 30-Apr-13 3113.00 UP 3106 3132 3150 3194 3088 3062 3018
KAPAS 30-Mar-13 854.80 DOWN 859 867 880 900 847 839 819
KAPAS 30-Apr-13 898.40 DOWN 902 907 916 931 893 887 873
KAPASKHALI 30-Apr-13 1342.00 DOWN 1348 1359 1375 1402 1332 1321 1294
KAPASKHALI 30-Mar-13 1310.50 DOWN 1317 1328 1346 1374 1300 1289 1260
KAPASKHALI 28-Feb-13 1280.00 DOWN 1287 1298 1317 1347 1268 1257 1227
LEAD 31-May-13 130.25 DOWN 131 131 132 134 130 129 127
LEAD 30-Apr-13 130.30 DOWN 131 131 132 134 130 129 128
LEAD 28-Mar-13 130.10 DOWN 130 131 132 134 129 129 127
LEAD 28-Feb-13 129.55 DOWN 130 131 132 134 129 128 126
LEADMINI 31-May-13 130.35 DOWN 131 131 132 134 130 129 128
LEADMINI 30-Apr-13 130.20 DOWN 131 131 132 134 130 129 127
LEADMINI 28-Mar-13 130.05 DOWN 130 131 132 134 129 129 127
LEADMINI 28-Feb-13 129.55 DOWN 130 131 132 134 129 128 126
MENTHAOIL 30-Apr-13 1247.40 UP 1244 1255 1263 1281 1237 1226 1208
MENTHAOIL 31-May-13 1140.60 DOWN 1143 1150 1159 1175 1134 1127 1111
MENTHAOIL 30-Mar-13 1292.10 UP 1285 1304 1315 1346 1273 1255 1224
MENTHAOIL 28-Feb-13 1384.70 UP 1379 1395 1406 1433 1368 1352 1325
NATURALGAS 25-Apr-13 187.90 UP 187 189 191 195 185 182 178
NATURALGAS 25-Mar-13 183.40 UP 182 185 187 192 180 177 173
NATURALGAS 25-Feb-13 179.00 UP 178 181 183 187 176 173 168
NICKEL 30-Apr-13 998.90 UP 998 1003 1007 1016 994 989 981
NICKEL 28-Mar-13 995.60 UP 994 999 1003 1012 991 985 977
NICKEL 28-Feb-13 991.10 UP 990 995 999 1008 986 981 971
NICKELM 31-May-13 1001.30 UP 1001 1004 1007 1013 998 995 989
NICKELM 30-Apr-13 998.60 UP 998 1002 1005 1012 995 991 984
NICKELM 28-Mar-13 995.20 UP 994 999 1003 1011 990 985 977
NICKELM 28-Feb-13 991.00 UP 990 995 999 1008 986 980 971
POTATO 15-Apr-13 822.10 DOWN 823 825 828 834 820 817 812
POTATO 15-May-13 823.00 DOWN 824 827 832 839 820 817 809
POTATO 15-Mar-13 835.10 UP 835 840 844 853 830 825 816
SILVER 05-Jul-13 60125.00 DOWN 60235 60369 60614 60993 59990 59856 59477
SILVER 04-May-13 58801.00 DOWN 58945 59131 59460 59975 58616 58430 57915
SILVER 05-Mar-13 57442.00 DOWN 57566 57726 58011 58456 57281 57121 56676
SILVER1000 30-Apr-13 59206.00 DOWN 59621 60582 61958 64295 58245 57284 54947
SILVER1000 28-Feb-13 57233.00 DOWN 57269 57413 57592 57915 57090 56946 56623
SILVER1000 30-Mar-13 57862.00 DOWN 57887 58475 59087 60287 57275 56687 55487
SILVERM 29-Jun-13 60171.00 DOWN 60265 60406 60640 61015 60031 59890 59515
SILVERM 30-Apr-13 58839.00 DOWN 58952 59103 59368 59784 58687 58536 58120
SILVERM 28-Feb-13 57468.00 DOWN 57608 57785 58103 58598 57290 57113 56618
SILVERMIC 29-Jun-13 60185.00 DOWN 60277 60408 60632 60987 60053 59922 59567
Keynote Capitals Ltd.
The Ruby,
9th Floor,
Senapati Bapat Marg,
Dadar (W), Mumbai, India – 400028
Tel: 30266000 / 22694322
www.keynotecapitals.com
3. MCX Commodities Intra-day Technical Levels For - 14/02/13
Commodity Contract Close Intra Day Pivot Resistance Support
Symbol Expiry 13/02/13 Trend Point R1 R2 R3 S1 S2 S3
SILVERMIC 30-Apr-13 58846.00 DOWN 58969 59127 59409 59849 58687 58529 58089
SILVERMIC 28-Feb-13 57474.00 DOWN 57598 57776 58077 58556 57297 57119 56640
STEELRPR 18-Apr-13 31880.00 DOWN 31957 32043 32207 32457 31793 31707 31457
STEELRPR 20-Mar-13 31410.00 DOWN 31457 31543 31677 31897 31323 31237 31017
STEELRPR 20-Feb-13 30920.00 DOWN 30927 31003 31087 31247 30843 30767 30607
ZINC 31-May-13 120.05 UP 120 121 121 123 119 118 117
ZINC 30-Apr-13 119.05 DOWN 119 120 121 122 118 118 116
ZINC 28-Mar-13 118.50 DOWN 119 119 120 122 118 117 116
ZINC 28-Feb-13 117.70 DOWN 118 119 120 121 117 116 115
ZINCMINI 31-May-13 119.50 DOWN 120 120 121 123 119 118 117
ZINCMINI 30-Apr-13 118.90 DOWN 119 120 121 122 118 118 116
ZINCMINI 28-Mar-13 118.45 DOWN 119 119 120 122 118 117 116
ZINCMINI 28-Feb-13 117.65 DOWN 118 119 120 121 117 116 115
Sanjay Bhatia (AVP – Technical Research), Email Id sanjay@keynotecapitals.net
Pivot Point: Intra- Day Trading Tool. - The key to the use of this tool is the use of Stop Loss
Intra Day Trend: It is valid only till the point where Price trades above Pivot Point. For Eg. “UP” would be valid till Price
remains above Pivot Point. It would become “DOWN” in event Price trades below Pivot Point.
Pivot Point (PP): This is a trigger point for Intra Day Buy / Sell based on the price range of the previous day.
R1: Resistance 1: 1st Resistance level over Pivot Point, R2: Resistance 2: Next Resistance level after R1.
R3: Resistance 3: Next Resistance level after R2.
S1: Support 1: 1st Support level after Pivot Point, S2: Support 2: Next Support level after S1.
S3: Support 3: Next Support level after S2.
Note: As per this tool, the trader should take BUY position just above the Pivot Point and keep the Pivot Point level as stop
loss and the first target would be R1 level (Resistance 1). If R1 is crossed then R2 (Resistance 2) becomes the next target
with the stop loss placed at R1 level. If R2 is crossed then R3 (Resistance 3) becomes the next target with the stop loss
placed at R2 level.
Similarly if price goes below the Pivot Point the trader should take a SELL position and keep the Pivot Point level as the
stop loss and the first target would be S1 level (Support 1). If S1 level is breached then S2 level (Support 2) becomes the
next target with the stop loss placed at S1 level. If S2 level is breached then S3 level (Support 3) becomes the next target
with the stop loss placed at S2 level.
Disclaimer: This document is not for public distribution and has been furnished to you solely for your information and must not be reproduced or
redistributed to any other person. Persons into whose possession this document may come are required to observe these restrictions. This material is for
the personal information of the authorized recipient, and we are not soliciting any action based upon it. This report is not to be construed as an offer to
sell or the solicitation of an offer to buy any security in any jurisdiction where such an offer or solicitation would be illegal. It is for the general information
of clients of Keynote Capitals Ltd. It does not constitute a personal recommendation or take into account the particular investment objectives, financial
situations, or needs of individual clients. We have reviewed the report, and in so far as it includes current or historical information, it is believed to be
reliable though its accuracy or completeness cannot be guaranteed. Neither Keynote Capitals Ltd., nor any person connected with it, accepts any liability
arising from the use of this document. The recipients of this material should rely on their own investigations and take their own professional advice. Price
and value of the investments referred to in this material may go up or down. Past performance is not a guide for future performance. Certain transactions
-including those involving futures, options and other derivatives as well as non-investment grade securities - involve substantial risk and are not suitable
for all investors. Reports based on technical analysis centers on studying charts of a stock’s price movement and trading volume, as opposed to focusing
on a company’s fundamentals and as such, may not match with a report on a company’s fundamentals. Opinions expressed are our current opinions as
of the date appearing on this material only. While we endeavor to update on a reasonable basis the information discussed in this material, there may be
regulatory, compliance, or other reasons that prevent us from doing so. Prospective investors and others are cautioned that any forward-looking
statements are not predictions and may be subject to change without notice. Our proprietary trading and investment businesses may make investment
decisions that are inconsistent with the recommendations expressed herein. We and our affiliates, officers, directors, and employees world wide may: (a)
from time to time, have long or short positions in, and buy or sell the securities thereof, of company (ies) mentioned herein or (b) be engaged in any other
transaction involving such securities and earn brokerage or other compensation or act as a market maker in the financial instruments of the company
(ies) discussed herein or act as advisor or lender / borrower to such company (ies) or have other potential conflict of interest with respect to any
recommendation and related information and opinions. The analyst for this report certifies that all of the views expressed in this report accurately reflect
his or her personal views about the subject company or companies and its or their securities, and no part of his or her compensation was, is or will be,
directly or indirectly related to specific recommendations or views expressed in this report. No part of this material may be duplicated in any form and/or
redistributed without Keynote Capitals Ltd’s., prior written consent.
Keynote Capitals Ltd.
The Ruby,
9th Floor,
Senapati Bapat Marg,
Dadar (W), Mumbai, India – 400028
Tel: 30266000 / 22694322
www.keynotecapitals.com