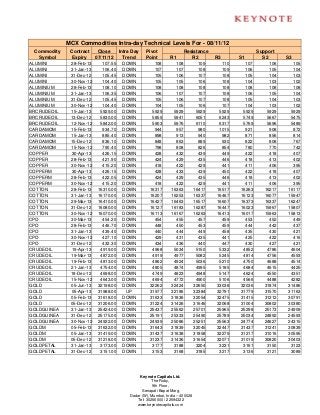
2. MCX Commodities Intra-day Technical Levels For - 08/11/12
Commodity Contract Close Intra Day Pivot Resistance Support
Symbol Expiry 07/11/12 Trend Point R1 R2 R3 S1 S2 S3
GOLDPETAL 30-Nov-12 3124.00 DOWN 3126 3142 3160 3194 3108 3092 3058
GOLDPTLDEL 31-Jan-13 3171.00 UP 3171 3190 3210 3249 3151 3132 3093
GOLDPTLDEL 31-Dec-12 3161.00 DOWN 3166 3185 3210 3254 3141 3122 3078
GOLDPTLDEL 30-Nov-12 3161.00 UP 3148 3187 3212 3276 3123 3084 3020
KAPAS 30-Mar-13 943.20 DOWN 946 952 960 975 937 932 917
KAPAS 30-Apr-13 967.60 DOWN 971 977 986 1001 962 956 941
KAPASKHALI 30-Apr-13 1520.00 DOWN 1520 1520 1520 1520 1520 1520 1520
KAPASKHALI 30-Mar-13 1505.00 DOWN 1505 1505 1505 1505 1505 1505 1505
KAPASKHALI 28-Feb-13 1507.00 DOWN 1511 1519 1531 1551 1499 1491 1471
KAPASKHALI 31-Jan-13 1487.00 DOWN 1491 1500 1513 1534 1478 1470 1448
KAPASKHALI 31-Dec-12 1480.00 DOWN 1486 1498 1515 1544 1469 1457 1428
LEAD 28-Feb-13 118.15 DOWN 118 119 120 122 117 116 115
LEAD 31-Jan-13 118.80 UP 119 120 121 123 118 117 115
LEAD 31-Dec-12 118.75 UP 119 120 121 123 118 116 114
LEAD 30-Nov-12 119.05 UP 119 120 121 123 118 117 115
LEADMINI 28-Feb-13 118.40 DOWN 118 119 121 123 117 116 114
LEADMINI 31-Jan-13 118.65 UP 118 120 121 123 117 116 114
LEADMINI 31-Dec-12 118.70 UP 119 120 121 123 117 116 114
LEADMINI 30-Nov-12 119.05 UP 119 120 121 123 118 117 115
MENTHAOIL 28-Feb-13 1197.80 UP 1197 1208 1217 1237 1188 1177 1157
MENTHAOIL 31-Jan-13 1198.20 DOWN 1201 1207 1215 1230 1193 1187 1173
MENTHAOIL 31-Dec-12 1190.60 DOWN 1193 1200 1209 1226 1184 1177 1161
MENTHAOIL 30-Nov-12 1176.80 DOWN 1179 1186 1196 1212 1170 1163 1147
NATURALGAS 28-Jan-13 205.40 UP 205 207 208 212 204 202 199
NATURALGAS 26-Dec-12 203.70 UP 203 205 207 210 202 200 197
NATURALGAS 27-Nov-12 195.20 UP 195 197 198 202 193 192 188
NICKEL 28-Feb-13 903.50 DOWN 907 915 927 947 895 887 867
NICKEL 31-Jan-13 893.20 DOWN 896 907 920 944 883 873 849
NICKEL 31-Dec-12 881.40 DOWN 886 897 913 939 870 859 833
NICKEL 30-Nov-12 872.00 DOWN 877 887 902 928 862 851 825
NICKELM 28-Feb-13 901.50 DOWN 906 914 927 947 893 885 865
NICKELM 31-Jan-13 893.40 DOWN 897 907 921 945 883 873 849
NICKELM 31-Dec-12 881.90 DOWN 886 897 913 939 871 860 834
NICKELM 30-Nov-12 872.10 DOWN 877 887 902 928 862 851 826
POTATO 15-May-13 732.10 DOWN 732 734 735 738 731 729 726
POTATO 15-Apr-13 698.70 DOWN 699 702 705 711 696 693 687
POTATO 15-Mar-13 732.80 DOWN 733 735 737 741 731 729 725
SILVER 04-May-13 62296.00 DOWN 62613 63304 64311 66009 61606 60915 59217
SILVER 05-Mar-13 61133.00 DOWN 61142 62066 62999 64856 60209 59285 57428
SILVER 05-Dec-12 59252.00 DOWN 59289 60192 61133 62977 58348 57445 55601
SILVER1000 31-Dec-12 59772.00 DOWN 59895 60488 61205 62515 59178 58585 57275
SILVER1000 30-Nov-12 59257.00 DOWN 59299 60177 61097 62895 58379 57501 55703
SILVERM 30-Apr-13 62715.00 DOWN 62754 63651 64587 66420 61818 60921 59088
SILVERM 28-Feb-13 61159.00 DOWN 61179 62080 63001 64823 60258 59357 57535
SILVERM 30-Nov-12 59263.00 DOWN 59308 60204 61146 62984 58366 57470 55632
SILVERMIC 30-Apr-13 62725.00 UP 62637 63745 64764 66891 61618 60510 58383
Keynote Capitals Ltd.
The Ruby,
9th Floor,
Senapati Bapat Marg,
Dadar (W), Mumbai, India – 400028
Tel: 30266000 / 22694322
www.keynotecapitals.com
3. MCX Commodities Intra-day Technical Levels For - 08/11/12
Commodity Contract Close Intra Day Pivot Resistance Support
Symbol Expiry 07/11/12 Trend Point R1 R2 R3 S1 S2 S3
SILVERMIC 28-Feb-13 61159.00 DOWN 61175 62079 63000 64825 60254 59350 57525
SILVERMIC 30-Nov-12 59283.00 DOWN 59310 60218 61154 62998 58374 57466 55622
STEELRPR 18-Jan-13 31240.00 DOWN 31300 31390 31540 31780 31150 31060 30820
STEELRPR 20-Dec-12 31070.00 UP 31033 31367 31663 32293 30737 30403 29773
ZINC 28-Feb-13 106.25 UP 106 106 106 106 106 106 106
ZINC 31-Jan-13 104.30 DOWN 105 105 106 107 104 103 102
ZINC 31-Dec-12 103.60 DOWN 104 104 105 107 103 102 101
ZINC 30-Nov-12 102.20 DOWN 102 103 104 105 102 101 99
ZINCMINI 28-Feb-13 105.40 DOWN 106 106 107 108 105 104 103
ZINCMINI 31-Jan-13 104.65 DOWN 105 105 106 107 104 103 102
ZINCMINI 31-Dec-12 103.60 DOWN 104 104 105 107 103 102 101
ZINCMINI 30-Nov-12 102.20 DOWN 102 103 104 105 102 101 99
Sanjay Bhatia (AVP – Technical Research), Email Id sanjay@keynotecapitals.net
Pivot Point: Intra- Day Trading Tool. - The key to the use of this tool is the use of Stop Loss
Intra Day Trend: It is valid only till the point where Price trades above Pivot Point. For Eg. “UP” would be valid till Price
remains above Pivot Point. It would become “DOWN” in event Price trades below Pivot Point.
Pivot Point (PP): This is a trigger point for Intra Day Buy / Sell based on the price range of the previous day.
R1: Resistance 1: 1st Resistance level over Pivot Point, R2: Resistance 2: Next Resistance level after R1.
R3: Resistance 3: Next Resistance level after R2.
S1: Support 1: 1st Support level after Pivot Point, S2: Support 2: Next Support level after S1.
S3: Support 3: Next Support level after S2.
Note: As per this tool, the trader should take BUY position just above the Pivot Point and keep the Pivot Point level as stop
loss and the first target would be R1 level (Resistance 1). If R1 is crossed then R2 (Resistance 2) becomes the next target
with the stop loss placed at R1 level. If R2 is crossed then R3 (Resistance 3) becomes the next target with the stop loss
placed at R2 level.
Similarly if price goes below the Pivot Point the trader should take a SELL position and keep the Pivot Point level as the
stop loss and the first target would be S1 level (Support 1). If S1 level is breached then S2 level (Support 2) becomes the
next target with the stop loss placed at S1 level. If S2 level is breached then S3 level (Support 3) becomes the next target
with the stop loss placed at S2 level.
Disclaimer: This document is not for public distribution and has been furnished to you solely for your information and must not be reproduced or
redistributed to any other person. Persons into whose possession this document may come are required to observe these restrictions. This material is
for the personal information of the authorized recipient, and we are not soliciting any action based upon it. This report is not to be construed as an offer
to sell or the solicitation of an offer to buy any security in any jurisdiction where such an offer or solicitation would be illegal. It is for the general
information of clients of Keynote Capitals Ltd. It does not constitute a personal recommendation or take into account the particular investment
objectives, financial situations, or needs of individual clients. We have reviewed the report, and in so far as it includes current or historical information,
it is believed to be reliable though its accuracy or completeness cannot be guaranteed. Neither Keynote Capitals Ltd., nor any person connected with
it, accepts any liability arising from the use of this document. The recipients of this material should rely on their own investigations and take their own
professional advice. Price and value of the investments referred to in this material may go up or down. Past performance is not a guide for future
performance. Certain transactions -including those involving futures, options and other derivatives as well as non-investment grade securities - involve
substantial risk and are not suitable for all investors. Reports based on technical analysis centers on studying charts of a stock’s price movement and
trading volume, as opposed to focusing on a company’s fundamentals and as such, may not match with a report on a company’s fundamentals.
Opinions expressed are our current opinions as of the date appearing on this material only. While we endeavor to update on a reasonable basis the
information discussed in this material, there may be regulatory, compliance, or other reasons that prevent us from doing so. Prospective investors and
others are cautioned that any forward-looking statements are not predictions and may be subject to change without notice. Our proprietary trading and
investment businesses may make investment decisions that are inconsistent with the recommendations expressed herein. We and our affiliates,
officers, directors, and employees world wide may: (a) from time to time, have long or short positions in, and buy or sell the securities thereof, of
company (ies) mentioned herein or (b) be engaged in any other transaction involving such securities and earn brokerage or other compensation or act
as a market maker in the financial instruments of the company (ies) discussed herein or act as advisor or lender / borrower to such company (ies) or
have other potential conflict of interest with respect to any recommendation and related information and opinions. The analyst for this report certifies
that all of the views expressed in this report accurately reflect his or her personal views about the subject company or companies and its or their
securities, and no part of his or her compensation was, is or will be, directly or indirectly related to specific recommendations or views expressed in this
report. No part of this material may be duplicated in any form and/or redistributed without Keynote Capitals Ltd’s., prior written consent.
Keynote Capitals Ltd.
The Ruby,
9th Floor,
Senapati Bapat Marg,
Dadar (W), Mumbai, India – 400028
Tel: 30266000 / 22694322
www.keynotecapitals.com