KBank Capital Market perspectives May 18 markets wrap up - positioning for thb near-term
•
0 likes•595 views

Foreign Exchange Market wrap up

Recommended
More Related Content
What's hot
What's hot (20)
Viewers also liked
Viewers also liked (10)
Similar to KBank Capital Market perspectives May 18 markets wrap up - positioning for thb near-term
Similar to KBank Capital Market perspectives May 18 markets wrap up - positioning for thb near-term (20)
More from KBank Fx Dealing Room
More from KBank Fx Dealing Room (20)
Recently uploaded
Recently uploaded (20)
KBank Capital Market perspectives May 18 markets wrap up - positioning for thb near-term
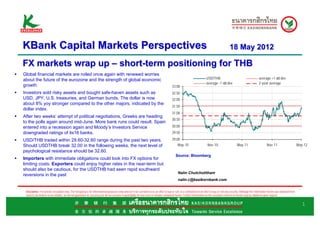
- 1. KBank Capital Markets Perspectives 18 May 2012 FX markets wrap up – short-term positioning for THB Global financial markets are roiled once again with renewed worries about the future of the eurozone and the strength of global economic USD/THB average +1 std dev average -1 std dev 2-year average growth. 33.00 Investors sold risky assets and bought safe-haven assets such as 32.50 USD, JPY, U.S. treasuries, and German bunds. The dollar is now 32.00 about 8% yoy stronger compared to the other majors, indicated by the 31.50 dollar index. 31.00 After two weeks’ attempt of political negotiations, Greeks are heading 30.50 to the polls again around mid-June. More bank runs could result. Spain entered into a recession again and Moody’s Investors Service 30.00 downgraded ratings of its16 banks. 29.50 USD/THB traded within 29.60-32.60 range during the past two years. 29.00 Should USDTHB break 32.00 in the following weeks, the next level of May-10 Nov-10 May-11 Nov-11 May-12 psychological resistance should be 32.60. Source: Bloomberg Importers with immediate obligations could look into FX options for limiting costs. Exporters could enjoy higher rates in the near-term but should also be cautious, for the USDTHB had seen rapid southward Nalin Chutchotitham reversions in the past nalin.c@kasikornbank.com Disclaimer: For private circulation only. The foregoing is for informational purposes only and not to be considered as an offer to buy or sell, or a solicitation of an offer to buy or sell any security. Although the information herein was obtained from sources we believe to be reliable, we do not guarantee its accuracy nor do we assume responsibility for any error or mistake contained herein. Further information on the securities referred to herein may be obtained upon request. 1
- 2. The sell-off and flight to safety (1) World stock index and SET Index Global financial markets are roiled once again with renewed worries Lehman's fall 2008 = 100 about Greece, Spain, and the future of the eurozone. At the same time, 200 the strength of global economic growth is also in question as recent data 180 showed weakness in several major economies. Now for the details. 160 Stock markets worldwide slumped for several consecutively days as 140 investors sold the higher-yielding risky assets and sought to minimize 120 100 their losses by buying safe-haven assets such as U.S. dollar, Japanese yen, U.S. treasuries, and German bunds. 80 60 Stock volatility: MSCI World Index which measures worldwide stock 40 performance has slumped 6.4% since end-April 2012 and 8.7% since Jan-08 Jul-08 Jan-09 Jul-09 Jan-10 Jul-10 Jan-11 Jul-11 Jan-12 March’s high. Compared to its 2011 high, the MSCI World index is now MSCI world AC SET Index 13.8% lower but remained 13.7% higher than its low point in Oct 2011. % Trouble in Greece led to strong demand in UST and bunds again The local SET Index had its own topsy-turvy ride but remained about 7.0 36% above its low in Sep 2011 (partly due to floods and partly due to Thailand Germany U.S. eurozone). At about 1170 points, it is 5.8% below its highest close this 6.0 year of 1240 (May 3rd). 5.0 Flight to ‘higher-quality’ bonds: 10-year U.S. treasury yield is now 4.0 trading below 1.80%, its lowest since Sep 2011, despite no additional 3.0 actions from the Federal Reserve and the still-positive economic data coming out of the U.S. Similarly, 10-year bunds (as long-term bonds are 2.0 called in Germany) trades close to 1.45%, 20bp lower than the end of 1.0 April, and hitting a euro-era low. In contrast, 10-year bond yields of Spain 0.0 and Italy rose about 58bp and 37bp, respectively, just this month alone. Jan-08 Jul-08 Jan-09 Jul-09 Jan-10 Jul-10 Jan-11 Jul-11 Jan-12 2
- 3. The sell-off and flight to safety (2) INR AUD EUR KRW THB IDR MYR SGD PHP GBP CNY TWD JPY Green is safe: The U.S. dollar gained strength rapidly during the past 2.0% 1.4% week, similar to the times when Greece entered into EU/IMF bailout program in May 2010, Ireland’s bailout in Nov 2010 (may be slightly 1.0% -0.1% less during Portugal’s bailout in May 2011), and the period towards the 0.0% EU fiscal pact in Q3-Q4 2011. -1.0% -0.6% -0.6% -0.4% The dollar index (a weighted value of the U.S. dollar against JPY, -2.0% -1.4% -1.4% -1.6% GBP, EUR, SEK, CAD, and CHF) rose to 81.6 as of May 17th, the -1.9% -1.8% -3.0% highest level since early-January and is about 3.7% above its 200-day -3.2% average, affirming that the dollar would remain relatively strong for -4.0% some time. Compared to its value a year ago, the dollar is now about -5.0% -4.5% Change against USD, 1-month period, as of May 17th 8% stronger compared to the other majors combined. -6.0% -5.5% Asian currencies had weakened markedly during the past 30 days, especially for the rupee as India’s economy is troubled with large fiscal 90 deficits and high inflation. The commodity-linked Aussie dollar dropped by more than 4%, partly as a result of policy rate cut from 4.25% to 85 3.75% on May 1st. Thai baht weakened about 2.0%. Commodities declined: If you were holding gold since the beginning 80 of the year, you will be back to square one at current values - $1553/ounce. However, if you had bought gold at its peak at end- 75 February (about $1784/ounce), you would have made a 13% loss. WTI crude oil prices trades at its year low near $93/ounce and is around 15% below its year high near $110/ounce. Concerns for global growth 70 had now overshadowed the geopolitical concerns over the reduction of Jan-08 Jul-08 Jan-09 Jul-09 Jan-10 Jul-10 Jan-11 Jul-11 Jan-12 oil exports from Iran. Dollar Index (DXY) 200-day mvg avg 3
- 4. Commodity and FX charts Spot Gold price Speculative positions show market continue to short EUR/USD 2000 120 1900 80 1800 40 1700 0 1600 1500 -40 1400 -80 1300 -120 1200 EUR non-commercial futures position, in '000 contracts, -160 Jan-11 Mar-11 May-11 Jul-11 Sep-11 Nov-11 Jan-12 Mar-12 May-12 Long positions - short positions -200 Gold ($/ounce) 50-day moving average 200-day moving average May-09 Nov-09 May-10 Nov-10 May-11 Nov-11 May-12 Oil futures curve: low prices to continue for some time 82 550 $/barrel WTI futures current 1M ago 3M ago 12M ago 600 108 80 650 106 78 700 104 750 102 76 800 100 98 850 74 96 900 94 72 950 92 Jan-11 Apr-11 Jul-11 Oct-11 Jan-12 Apr-12 1 2 3 4 5 6 7 8 9 10 11 12 delivery in x months ahead Dollar index (LHS) S&P-GoldmanSachs Commodity Index (RHS, inverted) 4
- 5. Greece in trouble again - briefing Economic growth: Greece enters the 5th year of recession while its debt % continues to climb. Official IMF estimates (March 2012) a that Greece 8.0 might be able to bring budget deficit down to 2.0% of GDP 1.2% of GDP 6.0 in 2020, the same time -GDP ratio could decline to 120% only around 4.0 2020. Unemployment rate had climbed from 2.0 International aid: Greece secured EUR110bn in bailout funds back in 0.0 May 2010 and another EUR130bn in its second bailout (involving bond swap deal) during the period between July 2011 – March 2012. If Greece -2.0 continues its economic reforms and fiscal austerity, it is likely that funding -4.0 Greece's GDP growth % yoy would be sufficient for at least 1-2 years’ time. More could be made -6.0 available at a later stage. -8.0 On reforms: the German Der Spiegel wrote that there had been barely 00 01 02 03 04 05 06 07 08 09 10 11 12 any change in the economic structure. Examples highlighted were: protected occupations continue to have high rents (meaning a higher The divided Greeks made clear via election results profit can be charged) while the public sector remains a large part of the economy. Sales of state enterprises had raised only about EUR1.6bn out 2009 91 13 160 21 15 of the EUR50bn target. May 6th election: Greeks show their divided views from recent votes. Socialist Syriza party won 52 seats out of total 300, coming in second place, indicating that more Greeks are supporting the party that wants to 2012 108 52 41 33 26 21 19 0 do away with austerity measures. This view is shared among other leftist no. of seats parties as well. The more established parties that were seen to be more obedient to the EU had a combined 149 seats, insufficient to form a new 0 100 200 300 government. After two weeks’ attempt of political negotiations, Greeks are heading to the polls again around mid-June. New Democracy Syriza Pasok ANEL KKE XA DIMAR LAOS 5
- 6. Spain’s banking problems resurfacing % th The 4 largest economy of the eurozone - Spain - is under scrutiny again 5 Spain's GDP % yoy as economic degradation leads to more problems. Fiscal deficit failed to 4 meet target in 2011, causing S&P to downgrade Spain twice this year to 3 BBB+ (equal to Thailand), 4 notches below its AA- rating in Dec-2011. 2 Unemployment rate continues to soar from end-2010 at 20.5% to end- 1 0 2011 at 23%; Q1 unemployment rate hit 23.8%. -1 Spain’s debt-to-GDP ratio was at 68.5% at end-2011, when it was only -2 40.2% in 2008. While the number is still below the eurozone’s average of -3 87.2%, the increase could be rapid if the state have to bailout more -4 banks. Government bond yields had a 2-year roller-coaster ride as -5 government’s ability to service its debts is deemed poorer from investors’ 05 06 07 08 09 10 11 12 point of view. 10-year bond yield were 5.5% and 5.1% during the end of 2010 and 2011, respectively. Now, it is at 6.35% (7.00% in Nov’11). Spain house price index (Left) U.S. FHFA house price index (right) Banking sector trouble: Spanish cajas (the smaller saving banks) were 130 400 forced to merge into bigger banks during the past few years but their balance sheets continue to weaken. Housing market’s boom since the 120 380 beginning of the euro-era had built up large amounts of loans in the 110 360 banking sector. As house prices slump and joblessness climbs, more bad loans are accumulating on the banks’ balance sheets. Madrid’s 100 340 financial and real estate sector equity index now trades at 26% below end-2011 level and its price-to-book ratio is at 0.56x. 90 320 On May 17th, Moody’s Investors Service had downgraded the long-term debt and deposit rating of 16 banks, including the two largest ones which 80 300 were deemed to have sound financial health. 05 06 07 08 09 10 11 12 6
- 7. The world needs a little help – U.S. and China growth U.S. employment – how long would it take to recover? U.S. economy: During Q1/2011, the U.S. economy grew by 2.2 % qoq 144000 (annualized) from the previous quarter. Other economic indicators, such 142000 as consumer spending and manufacturing output, were showing strong 140000 pick ups in the first quarter. 138000 However, recent indicators had been telling a rather mixed story. In 136000 particular, the change in non-farm payrolls had declined steadily for the 134000 third month, recording an increase of 115,000 payrolls in April, compared 132000 to its 6-month average of 197,000 payrolls. If such low levels of job 130000 increases continue, it may take longer than the year 2014 for 128000 employment to return to pre-crisis level – 13.8 million persons. Should a 05 06 07 08 09 10 11 12 13 14 weak momentum persists, the Federal Reserve will need to intervene again, and this could be one of the old remedies - Q.E. or operation twist. non-farm payrolls, k post crisis low point 200k 300k 400k China’s economy: The Chinese government is targeting growth at 7.5% China’s monetary policy stance could see further changes % RRR % this year, a much lower number compared to its average 10.5% growth 22 8.0 rate during the past 5 years. This is not surprising as China cannot avoid 21 7.5 the impacts from the slowdown in its major trading partners, although the 20 7.0 government has been promoting consumption growth. In April, industrial 19 production grew by 11% yoy year-to-date, compared with the 13.9% 6.5 18 growth in 2011 and 15.7% growth in 2010. In a good way, the cooling of 6.0 China’s economy had helped to contain price pressure: inflation rate had 17 16 5.5 declined from its’ peak of 6.5% last July to 3.4% in April. To help spur 15 5.0 growth, China loosened its monetary policy stance by lowering the reserve requirement ratio to 20%, a third reduction in 6 months’ time. 14 4.5 Yet, deposit and lending rates had stayed unchanged. Should lending Jun-08 Jun-09 Jun-10 Jun-11 see further slowdown, monetary policies may loosen up further. major banks RRR 12mm lending rate (RHS) 7
- 8. Near-term positioning on USDTHB? Our target for the USDTHB at year-end stays unchanged at 29.50. This is based on several assumptions: high possibility of Fed’s Q.E. (or 37 market’s expectation of it), stronger growth in Thailand and continued 36 inflows into the stock and bond markets, current account surplus. 35 For the next 2-3 months, we see higher risk of Thai baht weakening 34 against the U.S. dollar, using the recent years’ experience. Investors are 33 keen to reinvest in Asian assets and risky assets once solutions are 32 available to tackle the problems and panic in the eurozone, but they had 31 always been cautious during times when the cauldron remains hot. 30 Taking the more pessimistic views, one can imagine countless things: 29 Greece’s exit, more bank runs, Spain seeking bailout, Italy’s bond yields Jun-08 Jun-09 Jun-10 Jun-11 surging, more rating downgrades etc. There is still some time until USD/THB USD/THB 200-day moving average Greeks go to the polls, the topsy-turvy trade is likely to continue. USD/THB average +1 std dev average -1 std dev 2-year average 33.00 Chart above: USD/THB traded within 29.60-32.60 range during 32.50 the past two years, and we still see this as the medium-term run range. Should USDTHB break 32.00 in the following weeks, the 32.00 next level of psychological resistance should be 32.60. 31.50 Left chart: 2-year average value of USDTHB is at 30.78 while 31.00 its standard deviation is 0.76. Hence, under usual 30.50 circumstances, we would expect the USDTHB to stay within 30.00 30.02-31.54 range. With the drawn out political uncertainties in 29.50 Greece and several European economies re-entering a 29.00 recession (U.K. and Spain for instance), 31.54 level is not likely May-10 Nov-10 May-11 Nov-11 May-12 to hold. 8
- 9. Recommendations Given our illustrations thus far, Greece’s elections coming in mid-June, 1.60 EURUSD turbulent times and European Union meeting, it is more probable that USD/THB would 1.55 see more up-side risk than down-side risk. The time frame that we are 1.50 looking at is 1-2 months and we recommend our clients to hedge their 1.45 obligations for the near-term. 1.40 Importers with immediate obligations could look into FX options for 1.35 limiting costs. We do fear that bank runs could worsen in Europe, 1.30 especially Greece. Investors have deserted European bonds and equities, 1.25 the next to come would be the deposits in weaker banks. Earlier this week, 1.20 Greece’s central bank reported that EUR800mn of deposits had been EUR/USD 1.15 withdrawn since the election and the ECB had barred access of 4 Greek Jun-08 Jun-09 Jun-10 Jun-11 banks from its lending facility days later. Reuters also reported that nearly one-third of deposits had been withdrawn from Greek banks between Jan- Foreign net-buy in SET remained high – more outflows possible 2010 and Mar-2012. $ mn Foreign net buy in SET (year-to-date, $ mn) On the other hand, exporters should be able to wait for more up-side 6000 gains for converting USD income. However, exporters should also stay cautious for the USDTHB had seen rapid southward reversions in the past. 4000 Recall the quick turn in market sentiments during ECB’s surprise 2000 announcements of the LTRO (long-term refinancing operations) that 0 distributed about EUR1.0trn to banks in 3-year loans. We strongly recommend monitoring the markets closely for the next few months. -2000 Last but not least, we stress that these are short-term recommendations. -4000 We still see a positive outlook for Asian currencies on the longer horizon. -6000 Yet, Europe has never stopped surprising us during the past 3 years! 07 08 09 10 11 12 9
- 10. 10