SlideShare a Scribd company logo
1 of 2
Table 8.1<br />Between-Subjects FactorsValue LabelNQ34 Gender1Male1722Female189<br />Table 8.2<br />Descriptive StatisticsQ34 GenderMeanStd. DeviationNSleekMale3.8110.63342172Female3.8413.61232189Total3.8269.62178361InnovativeMale1.7529.39592172Female1.5617.38170189Total1.6528.39961361<br />Table 8.3<br />Box's Test of Equality of Covariance MatricesaBox's M2.635F.873df13df23.231E7Sig..454Tests the null hypothesis that the observed covariance matrices of the dependent variables are equal across groups.a. Design: Intercept + Q34<br />Table 8,4<br />Multivariate TestsbEffectValueFHypothesis dfError dfSig.Partial Eta SquaredInterceptPillai's Trace.9798.493E3a2.000358.000.000.979Wilks' Lambda.0218.493E3a2.000358.000.000.979Hotelling's Trace47.4448.493E3a2.000358.000.000.979Roy's Largest Root47.4448.493E3a2.000358.000.000.979Q34Pillai's Trace.06211.901a2.000358.000.000.062Wilks' Lambda.93811.901a2.000358.000.000.062Hotelling's Trace.06611.901a2.000358.000.000.062Roy's Largest Root.06611.901a2.000358.000.000.062a. Exact statisticb. Design: Intercept + Q34<br />Levene's Test of Equality of Error VariancesaFdf1df2Sig.Sleek.0031359.957Innovative.8061359.370Tests the null hypothesis that the error variance of the dependent variable is equal across groups.a. Design: Intercept + Q34<br />Table 8.5<br />Tests of Between-Subjects EffectsSourceDependent VariableType III Sum of SquaresdfMean SquareFSig.Partial Eta SquaredCorrected ModelSleek.082a1.082.212.645.001Innovative3.291b13.29121.802.000.057InterceptSleek5273.13515273.1351.361E4.000.974Innovative989.3611989.3616.554E3.000.948Q34Sleek.0821.082.212.645.001Innovative3.29113.29121.802.000.057ErrorSleek139.097359.387Innovative54.195359.151TotalSleek5426.000361Innovative1043.667361Corrected TotalSleek139.179360Innovative57.486360a. R Squared = .001 (Adjusted R Squared = -.002)b. R Squared = .057 (Adjusted R Squared = .055)<br />Estimated Marginal Means<br />Table 8.6<br />Q34 GenderDependent VariableQ34 GenderMeanStd. Error95% Confidence IntervalLower BoundUpper BoundSleekMale3.811.0473.7183.904Female3.841.0453.7523.930InnovativeMale1.753.0301.6951.811Female1.562.0281.5061.617<br />
Appendix 8  Manova Ei Vs Male Female

More Related Content

More from JuliusLim

Appendix 10 Manova Ei Vs Si
Appendix 10   Manova Ei Vs SiAppendix 10   Manova Ei Vs Si
Appendix 10 Manova Ei Vs SiJuliusLim
 
Appendix 9 Manova Ei Vs Ag
Appendix 9   Manova Ei Vs AgAppendix 9   Manova Ei Vs Ag
Appendix 9 Manova Ei Vs AgJuliusLim
 
Appendix 7 Manova Importance Vs Heard
Appendix 7   Manova Importance Vs HeardAppendix 7   Manova Importance Vs Heard
Appendix 7 Manova Importance Vs HeardJuliusLim
 
Appendix 6 Descriptives
Appendix 6   DescriptivesAppendix 6   Descriptives
Appendix 6 DescriptivesJuliusLim
 
Appendix 5 Factor Analysis Q26
Appendix 5   Factor Analysis Q26Appendix 5   Factor Analysis Q26
Appendix 5 Factor Analysis Q26JuliusLim
 
Appendix 4 Factor Analysis Q10
Appendix 4   Factor Analysis Q10Appendix 4   Factor Analysis Q10
Appendix 4 Factor Analysis Q10JuliusLim
 
Appendix 3 Student Vs Ssd
Appendix 3   Student Vs SsdAppendix 3   Student Vs Ssd
Appendix 3 Student Vs SsdJuliusLim
 
Appendix 2 Online Habits
Appendix 2   Online HabitsAppendix 2   Online Habits
Appendix 2 Online HabitsJuliusLim
 
Appendix 1 Profile
Appendix 1   ProfileAppendix 1   Profile
Appendix 1 ProfileJuliusLim
 
Advanced Marketing Research - Final
Advanced Marketing Research - FinalAdvanced Marketing Research - Final
Advanced Marketing Research - FinalJuliusLim
 

More from JuliusLim (10)

Appendix 10 Manova Ei Vs Si
Appendix 10   Manova Ei Vs SiAppendix 10   Manova Ei Vs Si
Appendix 10 Manova Ei Vs Si
 
Appendix 9 Manova Ei Vs Ag
Appendix 9   Manova Ei Vs AgAppendix 9   Manova Ei Vs Ag
Appendix 9 Manova Ei Vs Ag
 
Appendix 7 Manova Importance Vs Heard
Appendix 7   Manova Importance Vs HeardAppendix 7   Manova Importance Vs Heard
Appendix 7 Manova Importance Vs Heard
 
Appendix 6 Descriptives
Appendix 6   DescriptivesAppendix 6   Descriptives
Appendix 6 Descriptives
 
Appendix 5 Factor Analysis Q26
Appendix 5   Factor Analysis Q26Appendix 5   Factor Analysis Q26
Appendix 5 Factor Analysis Q26
 
Appendix 4 Factor Analysis Q10
Appendix 4   Factor Analysis Q10Appendix 4   Factor Analysis Q10
Appendix 4 Factor Analysis Q10
 
Appendix 3 Student Vs Ssd
Appendix 3   Student Vs SsdAppendix 3   Student Vs Ssd
Appendix 3 Student Vs Ssd
 
Appendix 2 Online Habits
Appendix 2   Online HabitsAppendix 2   Online Habits
Appendix 2 Online Habits
 
Appendix 1 Profile
Appendix 1   ProfileAppendix 1   Profile
Appendix 1 Profile
 
Advanced Marketing Research - Final
Advanced Marketing Research - FinalAdvanced Marketing Research - Final
Advanced Marketing Research - Final
 

Appendix 8 Manova Ei Vs Male Female

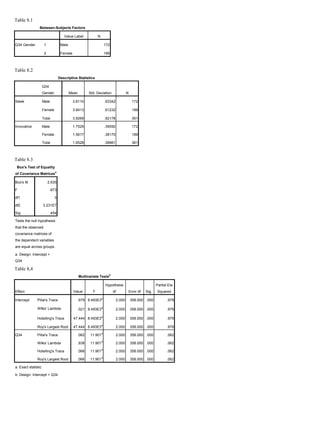
  • 1. Table 8.1<br />Between-Subjects FactorsValue LabelNQ34 Gender1Male1722Female189<br />Table 8.2<br />Descriptive StatisticsQ34 GenderMeanStd. DeviationNSleekMale3.8110.63342172Female3.8413.61232189Total3.8269.62178361InnovativeMale1.7529.39592172Female1.5617.38170189Total1.6528.39961361<br />Table 8.3<br />Box's Test of Equality of Covariance MatricesaBox's M2.635F.873df13df23.231E7Sig..454Tests the null hypothesis that the observed covariance matrices of the dependent variables are equal across groups.a. Design: Intercept + Q34<br />Table 8,4<br />Multivariate TestsbEffectValueFHypothesis dfError dfSig.Partial Eta SquaredInterceptPillai's Trace.9798.493E3a2.000358.000.000.979Wilks' Lambda.0218.493E3a2.000358.000.000.979Hotelling's Trace47.4448.493E3a2.000358.000.000.979Roy's Largest Root47.4448.493E3a2.000358.000.000.979Q34Pillai's Trace.06211.901a2.000358.000.000.062Wilks' Lambda.93811.901a2.000358.000.000.062Hotelling's Trace.06611.901a2.000358.000.000.062Roy's Largest Root.06611.901a2.000358.000.000.062a. Exact statisticb. Design: Intercept + Q34<br />Levene's Test of Equality of Error VariancesaFdf1df2Sig.Sleek.0031359.957Innovative.8061359.370Tests the null hypothesis that the error variance of the dependent variable is equal across groups.a. Design: Intercept + Q34<br />Table 8.5<br />Tests of Between-Subjects EffectsSourceDependent VariableType III Sum of SquaresdfMean SquareFSig.Partial Eta SquaredCorrected ModelSleek.082a1.082.212.645.001Innovative3.291b13.29121.802.000.057InterceptSleek5273.13515273.1351.361E4.000.974Innovative989.3611989.3616.554E3.000.948Q34Sleek.0821.082.212.645.001Innovative3.29113.29121.802.000.057ErrorSleek139.097359.387Innovative54.195359.151TotalSleek5426.000361Innovative1043.667361Corrected TotalSleek139.179360Innovative57.486360a. R Squared = .001 (Adjusted R Squared = -.002)b. R Squared = .057 (Adjusted R Squared = .055)<br />Estimated Marginal Means<br />Table 8.6<br />Q34 GenderDependent VariableQ34 GenderMeanStd. Error95% Confidence IntervalLower BoundUpper BoundSleekMale3.811.0473.7183.904Female3.841.0453.7523.930InnovativeMale1.753.0301.6951.811Female1.562.0281.5061.617<br />