Ultratech Cement Q1FY15: Buy at CMP for target of Rs2592
•
2 likes•189 views

UTCL’s Q1FY15 revenue came in line with expectation while EBITDA and PAT disappointed owing to higher costs. Pricing environment is expected to remain subdued in Q2 due to on-set of monsoon.

Recommended
More Related Content
What's hot
What's hot (19)
Similar to Ultratech Cement Q1FY15: Buy at CMP for target of Rs2592
Similar to Ultratech Cement Q1FY15: Buy at CMP for target of Rs2592 (20)
More from IndiaNotes.com
More from IndiaNotes.com (20)
Recently uploaded
Recently uploaded (20)
Ultratech Cement Q1FY15: Buy at CMP for target of Rs2592
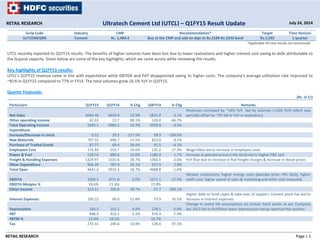
- 1. RETAIL RESEARCH Page | 1 Scrip Code Industry CMP Recommendation* Target Time Horizon ULTCEMEQNR Cement Rs. 2,484.4 Buy at the CMP and add on dips to Rs.2189‐Rs.2246 band Rs.2,592 1 quarter *Applicable till next results are announced UTCL recently reported its Q1FY15 results. The benefits of higher volumes have been lost due to lower realizations and higher interest cost owing to debt attributable to the Gujarat capacity. Given below are some of the key highlights, which we came across while reviewing the results. Key highlights of Q1FY15 results: UTCL’s Q1FY15 revenue came in line with expectation while EBITDA and PAT disappointed owing to higher costs. The company’s average utilization rate improved to ~81% in Q1FY15 compared to 77% in FY14. The total volumes grew 16.1% YoY in Q1FY15. Quarter Financials: (Rs. in Cr) Particulars Q1FY15 Q1FY14 % Chg Q4FY14 % Chg Remarks Net Sales 5649.46 4959.4 13.9% 5831.9 ‐3.1% Revenues increased by ~14% YoY led by volumes (+16% YoY) which was partially offset by ~2% fall in YoY in realization) Other operating income 42.63 22.7 88.1% 128.0 ‐66.7% Total Operating Income 5692.1 4982.1 14.3% 5959.9 ‐4.5% Expenditure Increase/Decrease in stock ‐3.52 20.2 ‐117.5% 58.9 ‐106.0% Raw Materials 797.55 690.7 15.5% 823.0 ‐3.1% Purchase of Traded Goods 87.77 69.4 26.4% 91.5 ‐4.1% Employees Cost 275.84 250.7 10.0% 235.2 17.3% Wage hikes led to increase in employee costs Power & Fuel 1207.6 989.6 22.0% 1186.9 1.7% Increase in petcoke prices (+4% QoQ) led to higher P&F cost Freight & Handling Expenses 1329.97 1101.8 20.7% 1365.5 ‐2.6% YoY Rise due to increase in Rail freight charges & increase in diesel prices Other Expenditure 946.39 787.9 20.1% 927.9 2.0% Total Opex 4641.6 3910.3 18.7% 4688.8 ‐1.0% EBIDTA 1050.5 1071.8 ‐2.0% 1271.1 ‐17.4% Weaker realizations, higher energy costs (petcoke price +4% QoQ), higher staffs cost, higher spend of sales & marketing and other cost impacted. EBIDTA Margins % 18.6% 21.6% 21.8% Other Income 213.11 165.6 28.7% 57.7 269.1% Interest Expenses 100.22 66.0 51.8% 73.9 35.5% Higher debt to fund capex & take‐over of Jaypee's Cement plant has led to increase in interest expenses Depreciation 264.5 252.1 4.9% 278.5 ‐5.0% Change in useful life assumptions on certain fixed assets as per Company Act 2013 led to Rs350mn lower depreciation being reported this quarter. PBT 898.9 919.2 ‐2.2% 976.4 ‐7.9% PBTM % 15.9% 18.5% 16.7% Tax 273.31 246.6 10.8% 138.4 97.5% RETAIL RESEARCH July 24, 2014Ultratech Cement Ltd (UTCL) – Q1FY15 Result Update
- 2. RETAIL RESEARCH Page | 2 Effective Tax Rate % 30.4% 26.8% 14.2% Net Profit 625.6 672.6 ‐7.0% 838.0 ‐25.4% Lower EBIDTA, higher interest cost (+52% YoY) and higher Tax rate (+30.4% YoY) dragged PAT down (Rs.6.26 bn ‐7% YoY) despite higher other income (+28.7% YoY). NPM % 11.1% 13.6% 14.4% Equity Capital 274.36 274.2 0.1% 274.2 0.0% EPS 22.8 24.5 ‐7.1% 30.6 ‐25.4% Total Volumes (Mn Tons) 11.96 10.3 16.1% 12.5 ‐4.4% Recent capacity additions led to YoY growth in dispatches Blended Realisation (Rs./Ton) 4723.6 4815.0 ‐1.9% 4,662.2 1.3% Prices in North and West remained stable QoQ post the sharp rise in Q4FY14. (Source: Company, HDFC sec) Some observations on Q1FY15 results: Cost per ton analysis: Particulars Q1FY15 Q1FY14 % Chg Q4FY14 % Chg Remarks Increase/Decrease in stock ‐2.9 19.6 ‐115.0% 47.1 ‐106.3% Raw Materials 666.8 670.6 ‐0.6% 657.9 1.4% Purchase of Finished Goods 73.4 67.4 8.9% 73.1 0.3% Employee Cost 230.6 243.4 ‐5.2% 188.0 22.7% Employee cost up QoQ owing to lower actuarial provision in Q4FY14 Power & Fuel 1009.7 960.8 5.1% 948.8 6.4% The increase in fuel costs reflects higher pet coke price (+4% QoQ). Freight & Handling Expenses 1112.0 1069.7 4.0% 1091.6 1.9% The sustained diesel price increases led to higher freight costs (+4% YoY). Other Expenditure 791.3 765.0 3.4% 741.8 6.7% Total Cost 3880.9 3796.4 2.2% 3748.4 3.5% EBIDTA 878.3 1040.5 ‐15.6% 1016.1 ‐13.6% (Source: Company, HDFC sec) Other Highlights: UTCL’s revenue increased 14% YoY to Rs56.5 bn in Q1FY15, led by 16.1% YoY (‐4.4% QoQ) rise in volume to 12mmt, which was partially offset by 1.9% YoY (+1.3% QoQ) decline in net realization to Rs4,724/tonne. Inclusion of sales from the recently acquired Gujarat units of Jaypee Corporation for part of June helped growth in volumes. Further, the company’s freight, power & fuel and other expenses grew 4.3%/5.4%/4% YoY to Rs1,112/1,010/791 per tonne during the quarter. Consequently, UTCEM’s EBITDA margin contracted 332bps YoY to 17.8%. The company’s EBITDA/tonne shrunk 17% YoY to Rs843/ton. Also, the company’s tax rate increased to 30.4% in Q1FY15 compared to 26.8% in Q1FY14 (14.2% QoQ). Consequently, the company’s net profit decreased 7% YoY to Rs6.3 bn. • The combined cement and clinker sales was 11.70 MnT (10.08 MnT) while it was 2.57 LmT (2.50 LmT) for white cement and wall care putty. Weak white cement sales impacted blended realizations and margins. Management guided for cement demand growth over 7‐8%, with double digit growth in H2FY15.
- 3. RETAIL RESEARCH Page | 3 Debt at end of Q1FY15 stood at ~Rs.100bn, with cash and liquid investments of Rs.50bn. During the quarter, the Company completed the acquisition of the Gujarat Units of Jaypee Cement Corporation Limited comprising of an integrated Unit at Sewagram and a grinding Unit at Wanakbori with a combined capacity of 4.8 mtpa. With this acquisition the cement capacity of the Company stands at 58.8 mtpa in India. The merger became effective from 12th June, 2014. Post this merger, UTCL’s domestic capacity increased to 58.8m tones, with clinker capacity in place for another 5.0 mTPA grinding capacity. Along with the ongoing Shambhupura expansion (3 mTPA), UltraTech will have ~68 mTPA by FY16 end domestically. 12.5 mtpa new capacity addition/acquisition majority in its high utilization West & East Zone could help improve growth. South prices jumped substantially in late June (price up Rs30‐80/bag). Realization for Q1FY15 was down ~2% yoy (+1% qoq) as the impact of price increase of Rs30‐ 80/bag in South India in June‐14 was effective for only 1month in the quarter. Prices in North and West remained stable qoq post the sharp rise in Q4FY14. During the quarter, domestic cement sales volume improved by 14% over the corresponding period in FY14. However, prices continued to remain under pressure. Variable cost increased by 3% mainly on account of increase in prices of petcoke and input material. The Company’s on‐going capex are on track, indicating that expansion at Rawan (Chattisgarh) and Sambhapura (Rajasthan) would be operational in FY15. During the quarter, it commissioned a 25MW thermal power plant at Rajashree Cement, Karnataka and a 6.5 MW Waste Heat Recovery system at Awarpur, Maharashtra. Post this capex, overall installed capacity increased (including WHRS) to 709 MW (catering to over 81% of company’s power requirements). Concerns Additional capacities coming on stream across the country could result in capacity utilisation rates coming down thereby adding pressure on margins. Being a large exporter of Cement, UTCL’s earnings are sensitive to export realizations and forex fluctuations. Rise in cost of imported coal, gypsum, flyash and rupee depreciation could impact costs and profitability. The Competition Commission of India (CCI) upheld the complaint of alleged cartelisation against certain cement manufacturing companies including the Company. The CCI has imposed a penalty of Rs.1,175.49 cr on UTCL. UTCL filed an appeal against the Order before the Competition Appellate Tribunal (COMPAT). COMPAT has granted stay on the CCI order on condition that the Company deposits 10% of the penalty, amounting to Rs.117.55 cr. The same has been deposited by the Company. The Company backed by a legal opinion, continues to believe that it has a good case and accordingly no provision has been made in the accounts. Conclusion & Recommendation UTCL’s Q1FY15 revenue came in line with expectation while EBITDA and PAT disappointed owing to higher costs. Current valuations factor in for potential recovery in FY15/16, benefit of which could be diluted due to initial impact of recent acquisition of Jaypee's Gujarat plant. Full impact of Rail freight increase, increments to staff due in Q2, clean energy cess hike could also result in continued pressure on margins in Q2.
- 4. RETAIL RESEARCH Page | 4 Pricing environment is expected to remain subdued in Q2 due to on‐set of monsoon. However, the long term view is one of optimism driven by hopes of demand revival topped up by a solid infrastructure push. Given a large extant capacity, spread across the country UTCL remains best placed to benefit from a revival in demand. Stable government would be key driver of demand and pricing recovery from H2FY15 onwards. The recent demand surge in Northern & Central region could help in sustaining prices and bottoming out of prices in southern region should further aide margin recovery. However after reporting double digit volume growth for the past two quarters, volume growth could fall a bit going forward. Higher tax on FMP and other debt products proposed in the latest Budget could also impact the effective tax rate and the PAT margins. Management pointed out that cement demand is slated to grow around 7‐8%, with expected double digit growth in H2FY15. The key value drivers will be renewed government focus on housing and infrastructure spending. We have introduced estimates of FY16 and we are revising our FY15 estimates (Revenues upgraded owing to additional capacity, while EBITDA and PAT margin down owing to higher costs). UTCL is trading at an EV/tonne of USD~180/Mt of its FY16 capacities and EV/EBIDTA of 12.4x. At the CMP of Rs.2,484.4 the stock is trading at 21.5x FY16E EPS of Rs.115.2. In our Q4FY14 result update dated April 28, 2014, we had stated that investors could buy the stock in the Rs.1,933‐2,023 band for a target of Rs.2,205 over the next one quarter. Post the issue of the report, the stock made a low of Rs.1,953 on May 08, 2014 and a high of Rs.2868 on June 18, 2014. We think that investors could buy the stock at the CMP and add in the Rs.2189‐2246 band (19.0‐19.5x FY16E EPS) for a target of Rs.2,592 (22.5x FY16E EPS) over the next one quarter. Particulars FY11 FY12 FY13 FY14 A FY15 (E)* FY15 (RE)* FY16 (E)* Operating Income 13209.9 19085.6 21156.1 21443.7 23481.4 24446.0 28462.9 PBIDT 2621.5 3240.6 4839.3 4034.8 4602.3 4693.6 597.7 PBIDTM% 19.8% 17.0% 22.9% 18.8% 19.6% 19.2% 21.0% PAT 1342.4 2403.3 2677.7 2212.8 2465.5 2420.2 3159.4 PATM% 10.2% 12.6% 12.7% 10.3% 10.5% 9.9% 11.1% EPS 49.0 87.7 97.7 80.7 89.9 88.2 115.2 PE (x) 51.5 28.8 25.8 31.3 28.0 28.6 21.9 * - Quick Estimates, A- Actuals (Source: Annual Report, HDFC sec Estimates) Analyst: Sheetal Poonawala Email ID: sheetal.poonawala@hdfcsec.com RETAIL RESEARCH Tel: (022) 3075 3400 Fax: (022) 2496 5066 Corporate Office HDFC securities Limited, I Think Techno Campus, Building - B, "Alpha", Office Floor 8, Near Kanjurmarg Station, Opp. Crompton Greaves, Kanjurmarg (East), Mumbai 400 042 Phone: (022) 3075 3400 Fax: (022) 2496 5066 Website: www.hdfcsec.com Email: hdfcsecretailresearch@hdfcsec.com Disclaimer: This document has been prepared by HDFC Securities Limited and is meant for sole use by the recipient and not for circulation. This document is not to be reported or copied or made available to others. It should not be considered to be taken as an offer to sell or a solicitation to buy any security. The information contained herein is from sources believed reliable. We do not represent that it is accurate or complete and it should not be relied upon as such. We may have from time to time positions or options on, and buy and sell securities referred to herein. We may from time to time solicit from, or perform investment banking, or other services for, any company mentioned in this document. This report is intended for non-Institutional Clients