Fabege's interim report for the period Jan-Mar 2015
•
0 likes•214 views

Fabege's interim report for the period January-March 2015.

Recommended
More Related Content
What's hot
What's hot (8)
Viewers also liked
Viewers also liked (9)
Similar to Fabege's interim report for the period Jan-Mar 2015
Similar to Fabege's interim report for the period Jan-Mar 2015 (20)
More from Fabege AB
Recently uploaded
Recently uploaded (20)
Fabege's interim report for the period Jan-Mar 2015
- 2. Fabege’s operations performed well during the first quarter. We are now seeing more distinct rental growth, not only in the CBD and our development areas but also in all of our areas. Efforts to extend and renegotiate leases with existing customers have been successful and we noted a 14 per cent average increase in renegotiated leases. With the positive conditions we see in the rental market, we now believe that rents will continue to increase following forthcoming re-negotiations. Increasing income in a comparable portfolio and lower costs contributed to a surplus ratio of 70 per cent, reflecting a record first quarter for Fabege. Improved cost effectiveness together with the mild winter contributed to lower costs. At the start of 2015, we are now seeing increased interest in properties, not least from funds, both Swedish and international, partly due to a weakening of the Swedish krona. We can state that yield requirements continue to decline and I believe that the floor has not yet been reached. The strong market conditions have contributed to healthy changes in value, which amounted to SEK 707m during the first quarter. At the start of the year, transaction volume has not been at the same record- high level as in autumn 2014. This is partly because the pace of transactions is usually slower in the first quarter but probably also to certain market inertia before potential buyers have adapted to the sellers’ ever higher expectations concerning price levels. It is gratifying to note that the capital market has shown keen interest in Nya SFF and that our issues via this company have been implemented on competitive terms. Nya SFF, provides new sources of financing, offered on competitive prices, serving as a solid supplement to today’s borrowing struc- ture. At the beginning of the current year, the rental and property markets in Stockholm have remained highly robust, with considerable demand from investors. Fabege’s property portfolio favourably matches customer requirements for modern and sustainable offices in attractive locations with access to rail services. We are looking forward to continued healthy development, in which all parts of the operation contribute to an increase in total earnings.
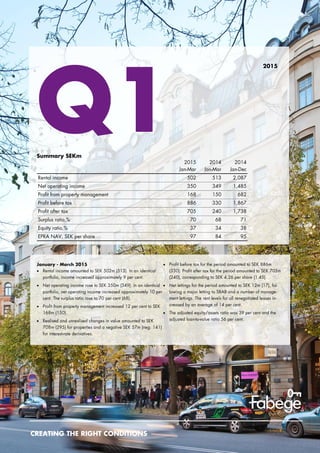
- 3. Profit after tax for the period amounted to SEK 705m (240), corresponding to SEK 4.26 per share (1.45). Profit before tax for the period amounted to SEK 886m (330). Net operating income increased slightly year-on-year, despite a smaller portfolio. Profit from property management improved approximately 12 per cent. The strong conditions in the property market led to an increase in unrealised value changes in the property portfolio. Rental income totalled SEK 502m (513) and net operating income rose to SEK 350m (349). In an identical portfolio, rental income rose about 9 per cent due to reduced rent discounts, a higher occupancy rate and improved rent levels. Net operating income was 10 per cent higher and the surplus ratio increased to 70 per cent (68), mainly due to a more modern portfolio with higher income and more efficient operation. For the second consecutive year, the mild winter contributed to low operating costs. Realised changes in the value of properties amounted to SEK 1m (83), resulting from lags from previously implemented transactions. Unrealised changes in value totalled SEK 707m (212). The SEK 620m (123) unrealised change in the value of the property management portfolio was attributable to properties with higher rent levels and to a lower yield requirement, not just in Stockholm inner city but also in Solna and Hammarby Sjöstad. The average yield requirement declined by just over 0.1 per cent to 5.3 per cent after rounding off (5.4 at year-end). The project portfolio contributed to an unrealised change in value of SEK 87m (89), primarily because of development gains in the major project properties. Share in profit of associated companies amounted to a loss of SEK 13m (loss: 13), primarily related to Arenabolaget in Solna KB. Due to lower long-term interest rates, the deficit value of the derivative portfolio increased by SEK 57m (141). Changes in the value of shareholdings, mainly Catena, totalled SEK 67 m (26). Net interest expense declined to SEK -153m (-171), mainly because of lower market interest rates. Through a re-allotment, the Uarda 1 property has been partitioned into three properties. Accordingly, Uarda 1 (formerly Building A) has been reclassified from a project prop- erty to an investment property. Following the property re-allotment, Uarda 6 (formerly Building B) and Uarda 7 (formerly Building C) were formed. The latter two remain as project properties. The Property Management segment generated net operating income of SEK 329m (337), corresponding to a surplus ratio of 70 per cent (68). The occupancy rate was 94 per cent (92). Profit from property management was SEK 167m (150). Unrealised changes in property values were SEK 620m (123). The Property Development segment generated net operating income of SEK 21m (12), leading to a surplus ratio of 62 per cent (71). Profit from property management was SEK 1m (0). Unrealised changes in property values totalled SEK 87m (89). No property transactions were conducted in the Transaction segment during the first quarter. Realised changes in the value of properties amounted to SEK 1m (83), resulting from lags in previously implemented transactions. Shareholders’ equity amounted to SEK 13,951m (13,783) at the end of the period and the equity/assets ratio was 37 per cent (38). Shareholders’ equity per share was SEK 84 (83). Excluding deferred tax on fair value adjustments of properties, net asset value per share was SEK 99 (97). EPRA NAV was SEK 97 (95). Continued healthy demand for office premises in Stockholm and increasing rent levels. New lettings amounted to SEK 44m (36) and net lettings to SEK 12m (17). The surplus ratio rose to 70 per cent (68). Profit from property management increased to SEK 168m (150). The property portfolio showed unrealised value growth of SEK 707m (212), of which projects accounted for SEK 87m (89). No property transactions were implemented during the quarter. The deficit value in the derivative portfolio rose SEK 57m (141) due to falling long-term interest rates. Profit after tax for the quarter amounted to SEK 705m (240).
- 4. Fabege employs long-term lines of credit subject to fixed terms and conditions. At 31 March 2015, these had an average maturity of 3.5 years. The company’s lenders are the major Nordic banks. Interest-bearing liabilities at period-end totalled SEK 19,733m (19,551) and the av- erage interest rate was 3.04 per cent excluding and 3.16 per cent including commitment fees on the undrawn portion of committed credit facilities. Unutilised committed lines of credit amounted SEK 4,543m. The loan-to-value ratio was 58 per cent. Adjusted for dividends that have not yet been paid, outstanding purchase considerations for sold properties and restricted amounts for loans that were settled during the second quarter in a total amount of SEK 829m, the loan-to-value ratio declines to 56 per cent. Fabege has a commercial paper programme in an amount of SEK 5,000m. At the end of the quarter, outstanding commercial paper amounted to SEK 2,679m (2,889). Fabege has available long-term credit facilities covering all outstanding commercial paper at any given time. It also has a covered property bond of SEK 1,170m, which will mature in February 2016. At 31 March, Fabege also had outstanding bonds of SEK 112m within the framework of the co-owned company Svensk Fastighetsfinansiering AB. Nya Svensk Fastighetsfinansiering AB, a newly formed finance company with a covered MTN programme of SEK 8,000m, was launched in January 2015. The compa- ny is owned by Catena AB, Diös Fastigheter AB, Fabege AB, Platzer Fastigheter Hold- ing AB and Wihlborgs Fastigheter AB, each of which hold a 20-per cent share. Within the parameters of this programme, Fabege issued SEK 682m in February. Nya SFF implemented an additional issue in early April, through which Fabege borrowed SEK 185m. The average fixed-rate period for Fabege’s loan portfolio was 2.1 years, including the effects of derivative instruments. The average fixed interest term for variable- interest loans was 71 days. During the first quarter, additional interest-rate swaps in a total amount of SEK 1,000m were agreed with maturities of eight to ten years, follow- ing which Fabege’s portfolio of derivative instruments comprised interest-rate swaps totalling SEK 7,000m, with maturities extending through 2025 and carrying fixed interest at annual rates of between 0.88 and 2.68 per cent before margins, and callable swaps totalling SEK 5,700m at interest rates of between 2.87 and 3.98 per cent before margins and maturity between 2016 and 2018. Interest rates on 64 per cent of Fabege’s loan portfolio were fixed using fixed-income derivatives. The derivatives portfolio is measured at market value and the change in value is recognised in profit or loss. At 31 March 2015, the recognised deficit value of the portfolio was SEK 977m (920). The derivatives portfolio is measured at the present value of future cash flows. The change in value is of an accounting nature and has no impact on the company’s cash flow. At the due date, the market value of derivative instruments is always zero. In early April, additional interest-rate swaps totalling SEK 600m were agreed with maturities of nine and ten years. Net financial items included other financial expenses of SEK 3m, mainly pertaining to accrued opening charges for borrowing agreements and bond programmes. The total loan volume per quarter included SEK 1,006m (656) in loans for projects, on which interest of SEK 7m had been capitalised. Tax for the period amounted to SEK -181m (-90). Operating taxes are calculated at a rate of 22 per cent on taxable earnings. Cash flow from operating activities before changes in working capital amounted to SEK 197m (neg: 798). Change in working capital had a positive impact of SEK 27m (53) on cash flow. Investing activities had a negative impact of SEK 366m (neg: 240) on cash flow, while financing activities had a positive impact of SEK 182m (1,035). In the investing activities, cash flow was driven by the projects. Cash and cash equivalents increased by a total of SEK 40m (50) during the year.
- 5. Fabege’s Property Management and Property Development activities are concentrated to a few selected submarkets in and around Stockholm. Stockholm’s inner city, Solna and Hammarby Sjöstad are the company’s principal markets. On 31 March 2015, Fa- bege owned 82 properties with a total rental value of SEK 2.2bn, lettable floor space of 1.0 million sqm and a carrying amount of SEK 33.8bn, of which development and project properties accounted for SEK 3.5bn. The financial occupancy rate for the entire portfolio, including project properties, was 93 per cent (92). The occupancy rate in the property management portfolio was 94 per cent (92). During the first quarter, 54 new leases were signed at a combined rental value of SEK 44m (36). Lease terminations amounted to SEK 32m (19), while net lettings were SEK 12m (17). Major lettings during the period pertained to SBAB at Fräsaren 10, Solna Business Park, and Digital Route at Barnhusväderkvarn 36 in the City of Stock- holm. A number of smaller leases were also signed pertaining to management lettings. Work to extend and renegotiate leases with existing customers was successful. Dur- ing the period, a lease value of just over SEK 30m was renegotiated, an average rise in rental value of 14 per cent. The retention rate during the period was 81 per cent (89). No property transactions were conducted in the first quarter. The Grönlandet Södra 13 property, which was sold at the end of 2014, will be vacated during the second quarter. The property has already been derecognised under IFRS, but the purchase consideration will be paid in connection with formally vacating the premises. Through property re-allotment, the Uarda 1 property has been partitioned into three properties. In general, conditions in the property market remained highly robust at the start of the year, with increasing property prices. The entire property portfolio is externally valued at least once annually. Approximately 34 per cent of the properties were externally valued at 31 March 2015 and the remainder were internally valued based on the most recent external valuation. The combined market value was SEK 33.8bn (32.6). Unrealised changes in value amounted to SEK 707m (212). The average required yield declined during the year, amounting to a rounded off figure of 5.3 per cent (5.4 at year-end). The SEK 620m (123) increase in the value of the property management portfolio was primarily attributable to the lower market yield requirement and to rising rents and lower vacancies. The project portfolio contributed to a change in value of SEK 87m (89), primarily due to development gains in the major project properties.
- 6. The purpose of Fabege’s project investments is to reduce vacancy rates and increase rents in the property portfolio, thereby improving cash flows and adding value. The development of properties is a key feature of Fabege’s business model and should make a significant contribution to consolidated profit. The aim is to achieve a return of at least 20 per cent on invested capital. During 2014, investments slightly exceeded SEK 1.2bn. Due to the considerable volume of on-going projects, the rate of investment is expected to rise in 2015. During the first quarter, investments in existing properties and projects totalled SEK 496m (242), of which investments in projects and development properties pertaining to new builds, extensions and conversions accounted for SEK 423m. The return on capital invested in the project portfolio slightly exceeded 20 per cent. SEK 73m was invested in the property management portfolio and contributed to the total growth in value. No major projects were completed during the period. The project involving the new build of Nationalarenan 8 property (TeliaSonera’s offic- es) is proceeding as planned. The work currently under way pertains to framework additions, roof work and work on fan rooms. The investment, including acquisition of development rights, totals approximately SEK 1.3bn. The property is fully let to Teli- aSonera, with occupancy scheduled for spring 2016. The new build of the Winery Hotel on the Järvakrogen 3 property continues. Con- struction of the framework is currently under way. Veidekke/Arcona have been pro- cured as turnkey contractors. The investment has increased, due to difficult ground conditions, and is now estimated at about SEK 300m. The property is fully let to The Winery Hotel, with occupancy scheduled for January 2016. The Uarda 7 (formerly Uarda 1, Building C) project at Arenastaden is also proceed- ing as planned. The investment totals about SEK 570m. Work on framework additions and on completing the facades is currently ongoing. The occupancy rate is 60 per cent. During the fourth quarter, an investment slightly exceeding SEK 500m was decided regarding construction of Uarda 6 (formerly Uarda 1, Building B), after Siemens had signed a lease. Earthworks and foundation engineering have recently been completed and framework assembly commences in April. The occupancy rate is 58 per cent. The project involving construction of SEB’s offices in the Pyramiden 4 property in Arenastaden is proceeding. Earthworks and foundation engineering are currently under way. The investment is some SEK 2.3bn and the new office is scheduled for completion in two phases, spring 2017 and 2018, respectively. The property is fully let to SEB. Svetsaren 1, Solna Business Park
- 7. ³
- 8. At the end of the quarter, 141 people (136) were employed in the Fa- bege Group. Sales during the period amounted to SEK 38m (39) and profit before appropriations and tax to SEK 37m (loss: 166). Net investments in property, equipment and shares were SEK 0m (0). At Fabege’s Annual General Meeting (AGM) on 26 March, the Board of Directors’ proposed dividend for 2014 of SEK 3.25 per share was adopted. For other resolutions, see the press release and AGM docu- ments on Fabege’s website. The 2015 AGM renewed the authorisation of the Board, not longer than up to the next AGM, to buy back and transfer shares in the company. Share buybacks are subject to a limit of 10 per cent of the total number of outstanding shares at any time. No shares were bought back during the year. Risks and uncertainties relating to cash flow from operations are primar- ily attributable to changes in rents, vacancies and interest rates. A more detailed description is presented in the risk section of the 2014 Annual Report (pages 38–41). The effect of the changes on consolidated profit is shown in the risk analysis and in the sensitivity analysis in the 2014 Directors' Report (page 62–67). Properties are recognised at fair value and changes in value are rec- ognised in profit or loss. The effects of changes in value on consolidated profit, the equity/assets ratio and the loan-to-value ratio are also pre- sented in the risk analysis and the sensitivity analysis in the 2014 annual report. Financial risk, defined as the risk of insufficient access to long- term funding through loans, and Fabege’s management of this risk are described in the 2014 annual report (pages 39–40 and 78-79). No material changes in the company’s assessment of risks have arisen following publication of the 2014 annual report. Fabege’s aims for the capital structure are to have an equity/assets ratio of at least 30 per cent and an interest coverage ratio of at least 2.0 (including realised changes in value). Nya SFF implemented an additional issue in early April, through which Fabege is borrowing SEK 185m. Additional interest-rate swaps totalling SEK 600m were also agreed with maturities of nine and ten years.
- 9. Expenses for the operation and maintenance of properties are subject to seasonal variations. For example, cold and snowy winters give rise to higher costs for heating and snow clearance, while hot summers result in higher cooling costs. During both the first and fourth quarters, the warm and snowless winter season contributed to lower operating costs and a strong surplus ratio. Activity in the rental market is seasonal. Normally, more business transactions are completed in the second and fourth quarters, whereby net lettings in these quarters is usually higher. At the beginning of the current year, the rental and property markets in Stockholm have remained highly robust, with considerable demand from investors. Fabege’s property portfolio favourably matches custom- er requirements for modern and sustainable offices in good locations. We are looking forward to continued healthy development, in which all parts of the operation contribute to an increase in total earnings. Fabege prepares its consolidated financial statements according to International Financial Reporting Standards (IFRS). The interim report has been prepared in accordance with IAS 34 Interim Financial Report- ing. The Group applies the same accounting principles and valuation methods as in the latest annual report. New or revised IFRS standards or other IFRIC interpretations that became effective after January 1, 2015 have not had any significant impact on the Group's income statement or balance sheet. The Parent Company prepares its financial statements according to RFR 2, Accounting for Legal Entities, and the Swedish Annual Ac- counts Act and applies the same accounting policies and valuation methods as in the latest annual report. Stockholm, 23 April 2015 CHRISTIAN HERMELIN Chief Executive Officer This interim report has not been examined by the company’s auditors. TeliaSoneras new office in the making
- 10. The Fabege share is traded on Nasdaq Stockholm, BOAT, BATS Chi-X and the London Stock Exchange. Number of shareholders at 31 March 2015: 39,957 Fabege works actively to achieve a sustainable urban environment that satisfies the needs of today without compromising the ability of future generations to meet their own needs. Reducing the carbon footprint and promoting a good working environment for the people who are present each day in the company’s buildings are central to Fabege’s sustainability effort. On 21 April, Fabege participated in Dagens Industri’s sustainability seminar and Fabege’s CEO Christian Hermelin talked about the so- cial responsibility of a city district developer and also participated in a panel discussion on how sustainability generates value.
- 11.
- 12.
- 13. Derivatives are measured continuously at fair value in compliance with level 2, with the exception of the callable swaps measured in accordance with level 3. Changes in value are recognised in profit or loss. IAS 39 has been applied also in the Parent Company since 2006. No changes in the meas- urement model have occurred.
- 14.
- 15. Profit for the period/year divided by average shareholders’ equity. In interim reports, the return is converted to its annualised value without taking account of seasonal varia- tions. Profit before tax plus interest expenses, divided by average capital employed. In interim reports, the return is converted to its annualised value without taking account of seasonal variations. Interest-bearing liabilities divided by the carrying amount of the properties at the end of the period. Dividend for the year divided by the share price at year-end. Parent Company shareholders’ share of equity according to the balance sheet, divided by the number of shares at the end of the period. Lease value divided by rental value at the end of the period. Profit from property management less tax at a nominal rate attributable to profit from property management divided by average number of shares. Taxable profit from property management is defined as profit from property management less such amounts as tax-deductible depreciation and remodelling. Shareholders’ equity per share following the reversal of fixed-income derivatives and deferred tax according to the balance sheet. Properties that are being actively managed on an on-going basis. Properties in which a conversion or exten- sion is in progress or planned that has a significant impact on the property’s net operating income. Net operating income is affected either directly by the project or by limitations on lettings prior to impending improvement work. Lease value plus estimated annual rent for vacant premises after a reasonable general renovation. Cash flow from operating activities (after changes in working capital) divided by the average number of outstanding shares. Stated as an annual value. Index-adjusted basic rent under the rental agreement plus rent supplements. Land and development properties and properties in which a new build/complete redevelopment is in progress. New lettings during the period less termina- tions to vacate. Parent Company shareholders’ share of profit after tax for the period divided by average number of outstanding shares during the period. Profit/loss before tax plus financial expens- es and plus/minus unrealised changes in value, divided by financial expenses. In accordance with IFRS 8, segments are presented from the point of view of man- agement, divided into the following seg- ments: Property Management, Property Development and Transaction. Rental income and property expenses, as well as realised and unrealised changes in value including tax, are directly attributable to properties in each segment (direct income and expenses). In cases where a property changes character during the year, earnings attributable to the property are allocated to each segment based on the period of time that the property belonged to each segment. Central administration and items in net financial expense have been allocated to the segments in a standardised manner based on each segment’s share of the total property value (indirect income and expenses). Property assets are directly attributed to each segment and recognised on the balance sheet date. Interest-bearing liabilities divided by share- holders’ equity. Shareholders’ equity divided by total assets. Total assets less non-interest bearing liabili- ties and provisions. Net operating income for the period plus unrealised and realised changes in the value of properties divided by market value at period end. Proportion of leases that are extended in relation to the proportion of cancellable leases Net operating income divided by rental income.
- 16. Fabege is one of Sweden’s leading property companies focusing mainly on letting and managing office premises as well as property develop- ment. The company offers modern premises in prime locations in fast- growing submarkets in the Stockholm region, such as Stockholm inner city, Solna and Hammarby Sjöstad. Fabege offers attractive and efficient premises, mainly offices but also retail and other premises. The concentration of properties to well- contained clusters brings the company closer to its customers, which, coupled with Fabege’s extensive local expertise, creates a solid founda- tion for efficient property management and high occupancy. At 31 March 2015, Fabege owned 82 properties with a total market value of SEK 33.8bn. The rental value was SEK 2.2bn. Fabege’s business concept focuses on commercial properties in the Stockholm region, with a particular emphasis on a limited number of fast-growing sub-markets. Fabege aims to create value by managing, improving and actively adjusting its property portfolio through sales and acquisitions. Accrued value should be realised at the right time. Fabege’s operational activities are conducted in three business areas: Property Management, Property Development and Transaction. Fabege’s strategy is to create value by managing and developing the property portfolio and – via transactions – acquiring properties with favourable growth potential and divesting properties located outside the company’s prioritised areas. Fabege’s properties are located in the most liquid market in Sweden. Attractive locations lead to a low vacancy rate in the property manage- ment portfolio. Modern properties permit flexible solutions and attract customers. With its concentrated portfolio and high-profile local pres- ence, investments aimed at raising the attractiveness of an area benefit many of Fabege’s customers. Fabege’s operations are impacted by a number of external factors, which together with the transaction volume and the trend in the office market in Stockholm, represent the prerequisites for the company’s success. The Stockholm region is one of the five metropolitan areas in Western Europe where the population is increasing the most. According to forecasts, Stockholm County will have half a million inhabitants more than today by 2030. The largest growth will also occur among people in the active labour force, which will result in higher demand for office premises. New technology and new work methods contribute to higher demand for flexible and space-efficient premises in prime locations. Excellent peripheral service and good communication links in the form of public transport services are increasingly requested, as is environmental certi- fication. The trend for both the Swedish and global economy has an impact on the property market. Low vacancy rates in Stockholm’s inner city and a strengthened economic climate have historically meant rising rents. Sustainability issues are becoming increasingly important, with respect to both individual properties and the entire area. Environmental consid- erations involving choices of material and energy-saving measures are on the rise. Demand is increasing for premises in areas with a favoura- ble mix of offices, retail, service and residential units, as well as excel- lent transport links and environmental commitment. The essence of Fabege’s operations is finding the right premises for a customer’s specific requirements and ensuring that the customer is content. This is accomplished through long- term work and based on close dialogue with the customer, thus building mutual trust and loyalty. Property transactions are an integral part of Fabege’s business model and contribute signifi- cantly to consolidated profit. The company continuously analyses its property portfolio to capitalise on opportunities to increase capital growth, through both acquisitions and divest- ments. High-quality property development is the second key cornerstone of our business. Fabege has long-standing expertise in pursuing extensive property development projects with the aim of attracting long-term tenants to properties that have not yet been fully developed and can be redesigned based on the customer’s specific requirements.