SlideShare a Scribd company logo
1 of 13
Download to read offline
Monthly IndicatorsA RESEARCH TOOL PROVIDED BY THE GREATER BOSTON ASSOCIATION OF REALTORS®
March 2014 Quick Facts
2
3
4
5
6
7
8
9
10
11
12
13
Housing Affordability Index
Inventory of Homes for Sale
Click on desired metric to jump to that page.
Months Supply of Inventory
Days On Market Until Sale
Percent of Original List Price Received
City of Boston Overview
Pending Sales
New Listings
Data is refreshed regularly to capture changes in market activity so figures shown may be different than previously reported. Current as of April 16, 2014. All data from MLS Property
Information Network, Inc. Provided by Greater Boston Association of REALTORS® and the Massachusetts Association of REALTORS®. Powered by 10K Research and Marketing.
- 11.9%
Year-Over-Year
(YoY) Change in
Closed Sales
Single-Family Only
During this year's spring refresh, seller activity is the first item on the watch list.
Low inventory has been a national headline grabber, and many are eager to see
if this is the year that brings a bevy of new properties to market for ready-to-
buyers. Investor activity and cash purchases should be monitored, as well,
along with any increases in new construction. And although interest rates are up
from their all-time lows, borrowing costs are still remarkably affordable. It's
cheaper to own than to rent in most of the country.
New Listings in the Greater Boston region were up 8.6 percent for detached
homes but decreased 10.1 percent for condominiums. Closed Sales decreased
11.9 percent for detached homes but increased 1.6 percent for condominiums.
The Median Sales Price was up 16.3 percent to $500,000 for single-family
properties and 7.8 percent to $436,500 for condominiums. Months Supply of
Inventory decreased 4.8 percent for single-family units and 27.8 percent for
townhouse-condo units.
Consumers are in better shape for the current financial landscape, just in time
for the primary home-buying season. Along with an uptick in consumer
confidence, GDP growth was revised up to 2.6 percent by the Commerce
Department. Consumer spending has risen and claims for unemployment
benefits have decreased. Economic health fuels housing market growth.
Employed, confident people with rising incomes tend to purchase real property.
+ 1.6%
Year-Over-Year
(YoY) Change in
Closed Sales
Condominium Only
- 5.1%
Year-Over-Year
(YoY) Change in
Closed Sales
All Properties
Single-Family Market Overview
Condominium Market Overview
Closed Sales
Median Sales Price
Single-Family Market Overview
Key market metrics for the current month and year-to-date figures for Single-Family Homes Only.
Key Metrics Historical Sparklines Mar-2013 Mar-2014 + / – YTD 2013 YTD 2014 + / –
1,518 - 7.3%
All data from MLS Property Information Network, Inc. Provided by the Greater Boston Association of REALTORS® and the Massachusetts Association of REALTORS®. Powered by 10K Research and Marketing. | Click for Cover Page | 2
New Listings 1,343 1,459 + 8.6% 3,197 3,129 - 2.1%
Closed Sales 616 543 - 11.9% 1,638
$490,813 + 14.1%
107
121 96
83
-- -- --
2,377 1,994
3.7 - 4.8%
$500,000 + 16.3% $430,000
109
Housing Affordability Index
Inventory of Homes for Sale
Months Supply of Inventory 3.9
$430,101
Pending Sales
Median Sales Price
- 7.1%2,3121,164 1,120 - 3.8% 2,488
- 16.1% -- --
- 21.0% 121 97 - 19.8%
--
94.4% 96.3%
- 23.8%
+ 2.0%
Percent of Original
List Price Received
Days on Market Until Sale
95.2%
- 23.1%
+ 2.0%
82
97.0%
3-2011 3-2012 3-2013 3-2014
3-2011 3-2012 3-2013 3-2014
3-2011 3-2012 3-2013 3-2014
3-2011 3-2012 3-2013 3-2014
3-2011 3-2012 3-2013 3-2014
3-2011 3-2012 3-2013 3-2014
3-2011 3-2012 3-2013 3-2014
3-2011 3-2012 3-2013 3-2014
3-2011 3-2012 3-2013 3-2014
Condominium Market Overview
Key market metrics for the current month and year-to-date figures for Condominium Properties Only.
Key Metrics Historical Sparklines Mar-2013 Mar-2014 + / – YTD 2013 YTD 2014 + / –
- 11.6%
All data from MLS Property Information Network, Inc. Provided by the Greater Boston Association of REALTORS® and the Massachusetts Association of REALTORS®. Powered by 10K Research and Marketing. | Click for Cover Page | 3
New Listings 1,342 1,206 - 10.1% 3,194 2,824
+ 1.4%
Pending Sales 1,162 1,031 - 11.3% 2,530 2,367 - 6.4%
Percent of Original
List Price Received
97.6% 98.9% + 1.3% 96.8% 98.2%
--
Days on Market Until Sale 71 65 - 8.7% 84 68 - 18.6%
Months Supply of Inventory 2.8 2.0 - 27.8% -- --
- 18.0%
Inventory of Homes for Sale 1,735 1,273 - 26.6% -- -- --
Housing Affordability Index 128 109 - 15.2% 135 111
+ 0.4%
Median Sales Price $405,000 $436,500 + 7.8% $379,000 $424,930 + 12.1%
Closed Sales 628 638 + 1.6% 1,577 1,583
3-2011 3-2012 3-2013 3-2014
3-2011 3-2012 3-2013 3-2014
3-2011 3-2012 3-2013 3-2014
3-2011 3-2012 3-2013 3-2014
3-2011 3-2012 3-2013 3-2014
3-2011 3-2012 3-2013 3-2014
3-2011 3-2012 3-2013 3-2014
3-2011 3-2012 3-2013 3-2014
3-2011 3-2012 3-2013 3-2014
Closed Sales
A count of the actual sales that have closed in a given month.
Single-Family
YoY
Change
Condominium
YoY
Change
Apr-2013 767 + 4.4% 805 + 6.5%
May-2013 1,096 + 10.0% 1,068 + 6.4%
Jun-2013 1,481 - 1.1% 1,246 - 1.0%
Jul-2013 1,488 + 18.0% 1,252 + 20.7%
Aug-2013 1,429 + 11.6% 1,277 + 6.2%
Sep-2013 919 + 22.4% 887 + 18.7%
Oct-2013 855 + 10.5% 764 + 7.5%
Nov-2013 791 - 11.4% 711 - 5.8%
Dec-2013 899 + 10.4% 790 + 3.1%
Jan-2014 569 - 4.7% 525 + 2.1%
Feb-2014 406 - 4.5% 420 - 3.4%
Mar-2014 543 - 11.9% 638 + 1.6%
Total 11,243 + 5.7% 10,383 + 5.8%
All data from MLS Property Information Network, Inc. Provided by the Greater Boston Association of REALTORS® and the Massachusetts Association of REALTORS®. Powered by 10K Research and Marketing. | Click for Cover Page | 4
640
606616 628
543
638
Single-Family Condominium
March
200
400
600
800
1,000
1,200
1,400
1,600
1,800
Jan-2003 Jan-2004 Jan-2005 Jan-2006 Jan-2007 Jan-2008 Jan-2009 Jan-2010 Jan-2011 Jan-2012 Jan-2013 Jan-2014
Historical Closed Sales Activity Single-Family Condominium
+1.6%+3.6%-3.8%
20142013 20142013
1,620
1,400
1,638
1,577
1,518
1,583
Single-Family Condominium
Year to Date
+0.4%+12.6%+1.1%
20142013 20142013
-11.9% -7.3%
2012 2012 2012 2012
Median Sales Price
Median price point for all closed sales, not accounting for seller concessions, in a given month.
Single-Family
YoY
Change
Condominium
YoY
Change
Apr-2013 $480,000 + 14.3% $387,500 + 4.3%
May-2013 $500,000 + 7.2% $410,000 + 7.5%
Jun-2013 $545,000 + 8.1% $420,000 + 5.0%
Jul-2013 $533,000 + 4.1% $400,500 + 3.5%
Aug-2013 $520,000 + 5.3% $416,000 + 9.5%
Sep-2013 $502,500 + 15.5% $410,000 + 9.3%
Oct-2013 $474,000 + 9.0% $416,750 + 13.8%
Nov-2013 $480,000 + 6.7% $410,500 + 8.0%
Dec-2013 $500,000 + 6.4% $420,400 + 10.5%
Jan-2014 $486,575 + 13.2% $421,500 + 14.2%
Feb-2014 $479,950 + 11.6% $400,000 + 14.3%
Mar-2014 $500,000 + 16.3% $436,500 + 7.8%
Median $507,613 + 9.2% $412,250 + 8.0%
All data from MLS Property Information Network, Inc. Provided by the Greater Boston Association of REALTORS® and the Massachusetts Association of REALTORS®. Powered by 10K Research and Marketing. | Click for Cover Page | 5
$415,000
$340,000
$430,101
$405,000
$500,000
$436,500
Single-Family Condominium
March
$250,000
$300,000
$350,000
$400,000
$450,000
$500,000
$550,000
Jan-2003 Jan-2004 Jan-2005 Jan-2006 Jan-2007 Jan-2008 Jan-2009 Jan-2010 Jan-2011 Jan-2012 Jan-2013 Jan-2014
Historical Median Sales Price Single-Family Condominium
+7.8%+19.1%+3.6%
20142013 20142013
$409,500
$350,000
$430,000
$379,000
$490,813
$424,930
Single-Family Condominium
Year to Date
+12.1%+8.3%+5.0%
20142013 20142013
+16.3% +14.1%
2012 2012 2012 2012
Housing Affordability Index
Single-Family
YoY
Change
Condominium
YoY
Change
Apr-2013 112 - 5.3% 136 + 2.9%
May-2013 104 - 4.8% 124 - 4.9%
Jun-2013 90 - 11.8% 114 - 9.2%
Jul-2013 92 - 9.2% 120 - 8.5%
Aug-2013 93 - 11.0% 115 - 13.9%
Sep-2013 98 - 18.5% 118 - 14.0%
Oct-2013 103 - 13.4% 116 - 16.6%
Nov-2013 108 - 6.7% 125 - 7.6%
Dec-2013 99 - 11.9% 117 - 14.6%
Jan-2014 96 - 22.6% 110 - 23.0%
Feb-2014 99 - 18.4% 117 - 19.9%
Mar-2014 96 - 21.0% 109 - 15.2%
Average 99 -12.9% 118 -12.0%
This index measures housing affordability for the region. An index of 120 means the median household income was 120% of what is necessary
to qualify for the median-priced home under prevailing interest rates. A higher number means greater affordability.
All data from MLS Property Information Network, Inc. Provided by the Greater Boston Association of REALTORS® and the Massachusetts Association of REALTORS®. Powered by 10K Research and Marketing. | Click for Cover Page | 6
117
141
121
128
96
109
Single-Family Condominium
March
60
70
80
90
100
110
120
130
140
150
160
Jan-2004 Jan-2005 Jan-2006 Jan-2007 Jan-2008 Jan-2009 Jan-2010 Jan-2011 Jan-2012 Jan-2013 Jan-2014
Historical Housing Affordability Index Single-Family Condominium
-15.2%-8.8%+3.4%
119
137
121
135
97
111
Single-Family Condominium
Year to Date
-18.0%-1.2%+2.2%
20142013 20142013 20142013 20142013
-21.0% -19.8%
2012 2012 2012 2012
Inventory of Homes for Sale
The number of properties available for sale in active status at the end of a given month.
Single-Family
YoY
Change
Condominium
YoY
Change
Apr-2013 2,769 - 34.8% 1,978 - 40.0%
May-2013 3,039 - 30.7% 2,077 - 34.8%
Jun-2013 3,031 - 26.6% 2,032 - 31.6%
Jul-2013 2,865 - 24.9% 1,865 - 31.9%
Aug-2013 2,758 - 23.4% 1,747 - 28.0%
Sep-2013 3,000 - 20.3% 1,965 - 22.3%
Oct-2013 2,884 - 17.1% 1,895 - 18.4%
Nov-2013 2,420 - 18.9% 1,581 - 21.1%
Dec-2013 1,844 - 19.7% 1,252 - 17.8%
Jan-2014 1,806 - 21.2% 1,227 - 22.5%
Feb-2014 1,904 - 20.7% 1,262 - 25.8%
Mar-2014 1,994 - 16.1% 1,273 - 26.6%
Average 2,526 - 23.8% 1,680 - 28.1%
All data from MLS Property Information Network, Inc. Provided by the Greater Boston Association of REALTORS® and the Massachusetts Association of REALTORS®. Powered by 10K Research and Marketing. | Click for Cover Page | 7
4,006
3,268
2,377
1,735
1,994
1,273
Single-Family Condominium
March
1,000
2,000
3,000
4,000
5,000
6,000
7,000
8,000
9,000
Jan-2003 Jan-2004 Jan-2005 Jan-2006 Jan-2007 Jan-2008 Jan-2009 Jan-2010 Jan-2011 Jan-2012 Jan-2013 Jan-2014
Historical Inventory of Homes for Sale Single-Family Condominium
-26.6%-46.9%-40.7%
20142013 20142013
-16.1%
2012 2012
Months Supply of Inventory
The inventory of homes for sale at the end of a given month, divided by the average monthly pending sales from the last 12 months.
Single-Family
YoY
Change
Condominium
YoY
Change
Apr-2013 3.6 - 37.6% 2.5 - 43.7%
May-2013 2.8 - 37.0% 1.9 - 38.7%
Jun-2013 2.0 - 25.9% 1.6 - 30.9%
Jul-2013 1.9 - 36.4% 1.5 - 43.6%
Aug-2013 1.9 - 31.4% 1.4 - 32.2%
Sep-2013 3.3 - 34.9% 2.2 - 34.5%
Oct-2013 3.4 - 24.9% 2.5 - 24.1%
Nov-2013 3.1 - 8.4% 2.2 - 16.3%
Dec-2013 2.1 - 27.3% 1.6 - 20.3%
Jan-2014 3.2 - 17.4% 2.3 - 24.1%
Feb-2014 4.7 - 17.0% 3.0 - 23.2%
Mar-2014 3.7 - 4.8% 2.0 - 27.8%
Average 2.7 - 31.1% 2.0 - 36.6%
All data from MLS Property Information Network, Inc. Provided by the Greater Boston Association of REALTORS® and the Massachusetts Association of REALTORS®. Powered by 10K Research and Marketing. | Click for Cover Page | 8
6.3
5.4
3.9
2.8
3.7
2.0
Single-Family Condominium
March
0
2
4
6
8
10
12
14
16
Jan-2004 Jan-2005 Jan-2006 Jan-2007 Jan-2008 Jan-2009 Jan-2010 Jan-2011 Jan-2012 Jan-2013 Jan-2014
Historical Months Supply of Inventory Single-Family Condominium
-27.8%-48.8%-38.4%
20142013 20142013
-4.8%
2012 2012
Days on Market Until Sale
Average number of days between when a property is listed and when an offer is accepted in a given month.
Single-Family
YoY
Change
Condominium
YoY
Change
Apr-2013 93 - 22.8% 63 - 35.1%
May-2013 75 - 22.3% 51 - 40.3%
Jun-2013 56 - 37.8% 43 - 42.4%
Jul-2013 47 - 41.6% 38 - 46.2%
Aug-2013 48 - 45.0% 40 - 47.1%
Sep-2013 57 - 36.1% 49 - 42.0%
Oct-2013 59 - 33.7% 47 - 43.9%
Nov-2013 65 - 27.2% 51 - 33.6%
Dec-2013 70 - 28.0% 55 - 34.2%
Jan-2014 79 - 27.5% 63 - 28.8%
Feb-2014 89 - 19.7% 79 - 17.7%
Mar-2014 82 - 23.1% 65 - 8.7%
Total 64 - 32.4% 48 - 35.8%
All data from MLS Property Information Network, Inc. Provided by the Greater Boston Association of REALTORS® and the Massachusetts Association of REALTORS®. Powered by 10K Research and Marketing. | Click for Cover Page | 9
130
117
107
71
82
65
Single-Family Condominium
March
30
50
70
90
110
130
150
Jan-2003 Jan-2004 Jan-2005 Jan-2006 Jan-2007 Jan-2008 Jan-2009 Jan-2010 Jan-2011 Jan-2012 Jan-2013 Jan-2014
Historical Days on Market Until Sale Single-Family Condominium
-8.7%-39.0%-17.4%
131
121
109
8483
68
Single-Family Condominium
Year to Date
-18.6%-31.0%-17.1%
20142013 20142013 20142013 20142013
-23.1% -23.8%
2012 2012 2012 2012
Percent of Original List Price Received
Single-Family
YoY
Change
Condominium
YoY
Change
Apr-2013 96.7% + 3.5% 98.8% + 3.2%
May-2013 97.8% + 2.6% 99.5% + 3.5%
Jun-2013 98.4% + 3.3% 99.7% + 3.5%
Jul-2013 98.1% + 2.4% 99.9% + 3.5%
Aug-2013 97.9% + 3.3% 99.7% + 3.5%
Sep-2013 97.3% + 3.0% 99.0% + 2.6%
Oct-2013 97.2% + 3.0% 98.8% + 3.1%
Nov-2013 96.3% + 1.7% 98.9% + 2.8%
Dec-2013 95.9% + 1.8% 98.0% + 1.9%
Jan-2014 95.8% + 2.0% 97.4% + 1.6%
Feb-2014 96.0% + 2.0% 98.1% + 1.5%
Mar-2014 97.0% + 2.0% 98.9% + 1.3%
Average 97.3% + 2.7% 99.1% + 2.9%
All data from MLS Property Information Network, Inc. Provided by the Greater Boston Association of REALTORS® and the Massachusetts Association of REALTORS®. Powered by 10K Research and Marketing. | Click for Cover Page | 10
Percentage found when dividing a property’s sales price by its original list price, then taking the average for all properties sold in a given month,
not accounting for seller concessions.
93.0% 94.0%95.2% 97.6%97.0% 98.9%
Single-Family Condominium
March
89%
91%
93%
95%
97%
99%
101%
Jan-2003 Jan-2004 Jan-2005 Jan-2006 Jan-2007 Jan-2008 Jan-2009 Jan-2010 Jan-2011 Jan-2012 Jan-2013 Jan-2014
Historical Percent of Original List Price Received Single-Family Condominium
+1.3%+3.8%+2.3%
91.7% 93.5%94.4% 96.8%96.3% 98.2%
Single-Family Condominium
Year to Date
+1.4%+3.4%+3.0%
20142013 20142013 20142013 20142013
+2.0% +2.0%
2012 2012 2012 2012
Pending Sales
A count of the properties in UAG status between the first and last day in a given month, regardless of current status (based on Off Market Date).
Single-Family
YoY
Change
Condominium
YoY
Change
Apr-2013 1,380 + 12.4% 1,269 + 9.1%
May-2013 1,477 + 15.6% 1,257 + 6.7%
Jun-2013 1,283 + 9.4% 1,089 + 9.9%
Jul-2013 976 + 4.6% 951 + 19.6%
Aug-2013 887 + 15.2% 758 + 4.0%
Sep-2013 835 - 2.0% 782 + 6.8%
Oct-2013 940 + 8.3% 814 + 3.0%
Nov-2013 701 + 3.1% 635 + 7.1%
Dec-2013 476 - 5.0% 420 - 8.5%
Jan-2014 516 - 17.0% 607 - 7.5%
Feb-2014 676 - 3.7% 729 + 2.4%
Mar-2014 1,120 - 3.8% 1,031 - 11.3%
Total 11,267 + 4.6% 10,342 + 3.8%
All data from MLS Property Information Network, Inc. Provided by the Greater Boston Association of REALTORS® and the Massachusetts Association of REALTORS®. Powered by 10K Research and Marketing. | Click for Cover Page | 11
1,142
1,065
1,164 1,162
1,120
1,031
Single-Family Condominium
March
200
400
600
800
1,000
1,200
1,400
1,600
1,800
2,000
2,200
Jan-2003 Jan-2004 Jan-2005 Jan-2006 Jan-2007 Jan-2008 Jan-2009 Jan-2010 Jan-2011 Jan-2012 Jan-2013 Jan-2014
Historical Pending Sales Activity Single-Family Condominium
-11.3%+9.1%+1.9%
2,500
2,362
2,488 2,530
2,312 2,367
Single-Family Condominium
Year to Date
-6.4%+7.1%-0.5%
20142013 20142013 20142013 20142013
-3.8% -7.1%
2012 2012 2012 2012
New Listings
A count of the properties that have been newly listed on the market in a given month.
Single-Family
YoY
Change
Condominium
YoY
Change
Apr-2013 1,994 + 14.6% 1,661 + 13.5%
May-2013 1,981 + 14.4% 1,532 + 12.6%
Jun-2013 1,505 + 15.1% 1,223 + 7.9%
Jul-2013 1,116 + 12.4% 993 + 12.3%
Aug-2013 1,030 + 6.0% 867 + 11.7%
Sep-2013 1,455 + 6.3% 1,253 + 11.0%
Oct-2013 1,219 + 18.7% 1,009 + 17.2%
Nov-2013 651 + 4.5% 554 + 0.4%
Dec-2013 397 + 13.4% 361 + 17.6%
Jan-2014 732 - 15.9% 739 - 18.1%
Feb-2014 938 - 4.7% 879 - 7.5%
Mar-2014 1,459 + 8.6% 1,206 - 10.1%
Total 14,477 + 8.8% 12,277 + 5.3%
All data from MLS Property Information Network, Inc. Provided by the Greater Boston Association of REALTORS® and the Massachusetts Association of REALTORS®. Powered by 10K Research and Marketing. | Click for Cover Page | 12
1,936
1,700
1,343 1,342
1,459
1,206
Single-Family Condominium
March
0
250
500
750
1,000
1,250
1,500
1,750
2,000
2,250
2,500
2,750
Jan-2003 Jan-2004 Jan-2005 Jan-2006 Jan-2007 Jan-2008 Jan-2009 Jan-2010 Jan-2011 Jan-2012 Jan-2013 Jan-2014
Historical New Listing Activity Single-Family Condominium
-10.1%-21.1%-30.6%
4,127
3,738
3,197 3,1943,129
2,824
Single-Family Condominium
Year to Date
-11.6%-14.6%-22.5%
20142013 20142013 20142013 20142013
+8.6% -2.1%
2012 2012 2012 2012
City of Boston – Market Overview
Key market metrics for the current month and year-to-date figures for the City of Boston.
Key Metrics Historical Sparklines Mar-2013 Mar-2014 + / – YTD 2013 YTD 2014 + / –
- 13.3%
All data from MLS Property Information Network, Inc. Provided by the Greater Boston Association of REALTORS® and the Massachusetts Association of REALTORS®. Powered by 10K Research and Marketing. | Click for Cover Page | 13
New Listings 722 647 - 10.4% 1,755 1,521
+ 1.4%
Pending Sales 632 559 - 11.6% 1,370 1,256 - 8.3%
Percent of Original
List Price Received
97.6% 99.1% + 1.6% 96.9% 98.2%
--
Days on Market Until Sale 65 61 - 6.0% 73 65 - 10.7%
Months Supply of Inventory 2.4 1.9 - 19.1% -- --
- 19.8%
Inventory of Homes for Sale 847 654 - 22.8% -- -- --
Housing Affordability Index 121 96 - 21.0% 121 97
+ 2.6%
Median Sales Price $415,000 $500,000 + 20.5% $408,750 $485,000 + 18.7%
Closed Sales 352 336 - 4.5% 849 871
3-2011 3-2012 3-2013 3-2014
3-2011 3-2012 3-2013 3-2014
3-2011 3-2012 3-2013 3-2014
3-2011 3-2012 3-2013 3-2014
3-2011 3-2012 3-2013 3-2014
3-2011 3-2012 3-2013 3-2014
3-2011 3-2012 3-2013 3-2014
3-2011 3-2012 3-2013 3-2014
3-2011 3-2012 3-2013 3-2014

More Related Content

More from Unit Realty Group

January 2015′s Monthly Multi-family Housing Activity Report
January 2015′s Monthly Multi-family Housing Activity ReportJanuary 2015′s Monthly Multi-family Housing Activity Report
January 2015′s Monthly Multi-family Housing Activity ReportUnit Realty Group
 
January 2015 Greater Boston Real Estate Market Trends Report
January 2015 Greater Boston Real Estate Market Trends ReportJanuary 2015 Greater Boston Real Estate Market Trends Report
January 2015 Greater Boston Real Estate Market Trends ReportUnit Realty Group
 
December 2014 Greater Boston Real Estate Market Trends Report
December 2014 Greater Boston Real Estate Market Trends ReportDecember 2014 Greater Boston Real Estate Market Trends Report
December 2014 Greater Boston Real Estate Market Trends ReportUnit Realty Group
 
November 2014 Greater Boston Real Estate Market Trends Report
November 2014 Greater Boston Real Estate Market Trends ReportNovember 2014 Greater Boston Real Estate Market Trends Report
November 2014 Greater Boston Real Estate Market Trends ReportUnit Realty Group
 
November 2014 Multi-family Housing Activity Report – Boston, MA Real Estate
November 2014 Multi-family Housing Activity Report – Boston, MA Real EstateNovember 2014 Multi-family Housing Activity Report – Boston, MA Real Estate
November 2014 Multi-family Housing Activity Report – Boston, MA Real EstateUnit Realty Group
 
September 2014 Multi-family Housing Activity Report – Boston, MA Real Estate
September 2014 Multi-family Housing Activity Report – Boston, MA Real EstateSeptember 2014 Multi-family Housing Activity Report – Boston, MA Real Estate
September 2014 Multi-family Housing Activity Report – Boston, MA Real EstateUnit Realty Group
 
Boston By The Numbers - Boston Housing Stock (Report)
Boston By The Numbers - Boston Housing Stock (Report)Boston By The Numbers - Boston Housing Stock (Report)
Boston By The Numbers - Boston Housing Stock (Report)Unit Realty Group
 
May 2014 Multi-family Housing Activity Report – Boston, MA Real Estate
May 2014 Multi-family Housing Activity Report – Boston, MA Real EstateMay 2014 Multi-family Housing Activity Report – Boston, MA Real Estate
May 2014 Multi-family Housing Activity Report – Boston, MA Real EstateUnit Realty Group
 
January 2014 Greater Boston Real Estate Market Trends Report
January 2014 Greater Boston Real Estate Market Trends ReportJanuary 2014 Greater Boston Real Estate Market Trends Report
January 2014 Greater Boston Real Estate Market Trends ReportUnit Realty Group
 
November 2013 Multi-family Housing Activity Report – Boston, MA Real Estate
November 2013 Multi-family Housing Activity Report – Boston, MA Real EstateNovember 2013 Multi-family Housing Activity Report – Boston, MA Real Estate
November 2013 Multi-family Housing Activity Report – Boston, MA Real EstateUnit Realty Group
 
September 2013 Multifamily Housing Activity Report – Boston, MA Real Estate
September 2013 Multifamily Housing Activity Report – Boston, MA Real EstateSeptember 2013 Multifamily Housing Activity Report – Boston, MA Real Estate
September 2013 Multifamily Housing Activity Report – Boston, MA Real EstateUnit Realty Group
 
August 2013 Multifamily Housing Activity Report – Boston, MA Real Estate
August 2013 Multifamily Housing Activity Report – Boston, MA Real EstateAugust 2013 Multifamily Housing Activity Report – Boston, MA Real Estate
August 2013 Multifamily Housing Activity Report – Boston, MA Real EstateUnit Realty Group
 
July 2013 Multifamily Housing Activity Report – Boston, MA Real Estate
July 2013 Multifamily Housing Activity Report – Boston, MA Real EstateJuly 2013 Multifamily Housing Activity Report – Boston, MA Real Estate
July 2013 Multifamily Housing Activity Report – Boston, MA Real EstateUnit Realty Group
 
July 2013's Monthly Indicators report - Boston Real Estate Market Trends
July 2013's Monthly Indicators report - Boston Real Estate Market TrendsJuly 2013's Monthly Indicators report - Boston Real Estate Market Trends
July 2013's Monthly Indicators report - Boston Real Estate Market TrendsUnit Realty Group
 
June 2013 Multifamily Housing Activity Report – Boston, MA Real Estate
June 2013 Multifamily Housing Activity Report – Boston, MA Real EstateJune 2013 Multifamily Housing Activity Report – Boston, MA Real Estate
June 2013 Multifamily Housing Activity Report – Boston, MA Real EstateUnit Realty Group
 
June 2013's Monthly Indicators report - Boston Real Estate Market Trends
June 2013's Monthly Indicators report - Boston Real Estate Market TrendsJune 2013's Monthly Indicators report - Boston Real Estate Market Trends
June 2013's Monthly Indicators report - Boston Real Estate Market TrendsUnit Realty Group
 
May 2013's Monthly Indicators report - Boston Real Estate Market Trends
May 2013's Monthly Indicators report - Boston Real Estate Market Trends May 2013's Monthly Indicators report - Boston Real Estate Market Trends
May 2013's Monthly Indicators report - Boston Real Estate Market Trends Unit Realty Group
 
April 2013 Monthly Multi-family Housing Activity Report – Boston Real Estate
April 2013 Monthly Multi-family Housing Activity Report – Boston Real Estate April 2013 Monthly Multi-family Housing Activity Report – Boston Real Estate
April 2013 Monthly Multi-family Housing Activity Report – Boston Real Estate Unit Realty Group
 
April 2013's Monthly Indicators report - Boston Real Estate Market Trends
April 2013's Monthly Indicators report - Boston Real Estate Market TrendsApril 2013's Monthly Indicators report - Boston Real Estate Market Trends
April 2013's Monthly Indicators report - Boston Real Estate Market TrendsUnit Realty Group
 
March 2013 Monthly Multi-family Housing Activity Report - Boston Real Estate
March 2013 Monthly Multi-family Housing Activity Report - Boston Real Estate March 2013 Monthly Multi-family Housing Activity Report - Boston Real Estate
March 2013 Monthly Multi-family Housing Activity Report - Boston Real Estate Unit Realty Group
 

More from Unit Realty Group (20)

January 2015′s Monthly Multi-family Housing Activity Report
January 2015′s Monthly Multi-family Housing Activity ReportJanuary 2015′s Monthly Multi-family Housing Activity Report
January 2015′s Monthly Multi-family Housing Activity Report
 
January 2015 Greater Boston Real Estate Market Trends Report
January 2015 Greater Boston Real Estate Market Trends ReportJanuary 2015 Greater Boston Real Estate Market Trends Report
January 2015 Greater Boston Real Estate Market Trends Report
 
December 2014 Greater Boston Real Estate Market Trends Report
December 2014 Greater Boston Real Estate Market Trends ReportDecember 2014 Greater Boston Real Estate Market Trends Report
December 2014 Greater Boston Real Estate Market Trends Report
 
November 2014 Greater Boston Real Estate Market Trends Report
November 2014 Greater Boston Real Estate Market Trends ReportNovember 2014 Greater Boston Real Estate Market Trends Report
November 2014 Greater Boston Real Estate Market Trends Report
 
November 2014 Multi-family Housing Activity Report – Boston, MA Real Estate
November 2014 Multi-family Housing Activity Report – Boston, MA Real EstateNovember 2014 Multi-family Housing Activity Report – Boston, MA Real Estate
November 2014 Multi-family Housing Activity Report – Boston, MA Real Estate
 
September 2014 Multi-family Housing Activity Report – Boston, MA Real Estate
September 2014 Multi-family Housing Activity Report – Boston, MA Real EstateSeptember 2014 Multi-family Housing Activity Report – Boston, MA Real Estate
September 2014 Multi-family Housing Activity Report – Boston, MA Real Estate
 
Boston By The Numbers - Boston Housing Stock (Report)
Boston By The Numbers - Boston Housing Stock (Report)Boston By The Numbers - Boston Housing Stock (Report)
Boston By The Numbers - Boston Housing Stock (Report)
 
May 2014 Multi-family Housing Activity Report – Boston, MA Real Estate
May 2014 Multi-family Housing Activity Report – Boston, MA Real EstateMay 2014 Multi-family Housing Activity Report – Boston, MA Real Estate
May 2014 Multi-family Housing Activity Report – Boston, MA Real Estate
 
January 2014 Greater Boston Real Estate Market Trends Report
January 2014 Greater Boston Real Estate Market Trends ReportJanuary 2014 Greater Boston Real Estate Market Trends Report
January 2014 Greater Boston Real Estate Market Trends Report
 
November 2013 Multi-family Housing Activity Report – Boston, MA Real Estate
November 2013 Multi-family Housing Activity Report – Boston, MA Real EstateNovember 2013 Multi-family Housing Activity Report – Boston, MA Real Estate
November 2013 Multi-family Housing Activity Report – Boston, MA Real Estate
 
September 2013 Multifamily Housing Activity Report – Boston, MA Real Estate
September 2013 Multifamily Housing Activity Report – Boston, MA Real EstateSeptember 2013 Multifamily Housing Activity Report – Boston, MA Real Estate
September 2013 Multifamily Housing Activity Report – Boston, MA Real Estate
 
August 2013 Multifamily Housing Activity Report – Boston, MA Real Estate
August 2013 Multifamily Housing Activity Report – Boston, MA Real EstateAugust 2013 Multifamily Housing Activity Report – Boston, MA Real Estate
August 2013 Multifamily Housing Activity Report – Boston, MA Real Estate
 
July 2013 Multifamily Housing Activity Report – Boston, MA Real Estate
July 2013 Multifamily Housing Activity Report – Boston, MA Real EstateJuly 2013 Multifamily Housing Activity Report – Boston, MA Real Estate
July 2013 Multifamily Housing Activity Report – Boston, MA Real Estate
 
July 2013's Monthly Indicators report - Boston Real Estate Market Trends
July 2013's Monthly Indicators report - Boston Real Estate Market TrendsJuly 2013's Monthly Indicators report - Boston Real Estate Market Trends
July 2013's Monthly Indicators report - Boston Real Estate Market Trends
 
June 2013 Multifamily Housing Activity Report – Boston, MA Real Estate
June 2013 Multifamily Housing Activity Report – Boston, MA Real EstateJune 2013 Multifamily Housing Activity Report – Boston, MA Real Estate
June 2013 Multifamily Housing Activity Report – Boston, MA Real Estate
 
June 2013's Monthly Indicators report - Boston Real Estate Market Trends
June 2013's Monthly Indicators report - Boston Real Estate Market TrendsJune 2013's Monthly Indicators report - Boston Real Estate Market Trends
June 2013's Monthly Indicators report - Boston Real Estate Market Trends
 
May 2013's Monthly Indicators report - Boston Real Estate Market Trends
May 2013's Monthly Indicators report - Boston Real Estate Market Trends May 2013's Monthly Indicators report - Boston Real Estate Market Trends
May 2013's Monthly Indicators report - Boston Real Estate Market Trends
 
April 2013 Monthly Multi-family Housing Activity Report – Boston Real Estate
April 2013 Monthly Multi-family Housing Activity Report – Boston Real Estate April 2013 Monthly Multi-family Housing Activity Report – Boston Real Estate
April 2013 Monthly Multi-family Housing Activity Report – Boston Real Estate
 
April 2013's Monthly Indicators report - Boston Real Estate Market Trends
April 2013's Monthly Indicators report - Boston Real Estate Market TrendsApril 2013's Monthly Indicators report - Boston Real Estate Market Trends
April 2013's Monthly Indicators report - Boston Real Estate Market Trends
 
March 2013 Monthly Multi-family Housing Activity Report - Boston Real Estate
March 2013 Monthly Multi-family Housing Activity Report - Boston Real Estate March 2013 Monthly Multi-family Housing Activity Report - Boston Real Estate
March 2013 Monthly Multi-family Housing Activity Report - Boston Real Estate
 

Recently uploaded

Listing Turkey - Resim Modern Catalog Istanbul
Listing Turkey - Resim Modern Catalog IstanbulListing Turkey - Resim Modern Catalog Istanbul
Listing Turkey - Resim Modern Catalog IstanbulListing Turkey
 
Mana Dale Kodathi, Sarjapur Road, Bangalore E-Brochure.pdf
Mana Dale Kodathi, Sarjapur Road, Bangalore E-Brochure.pdfMana Dale Kodathi, Sarjapur Road, Bangalore E-Brochure.pdf
Mana Dale Kodathi, Sarjapur Road, Bangalore E-Brochure.pdffaheemali990101
 
Shapoorji Pallonji Vanaha GolfLand 2 | A Space For You To Find Your Space
Shapoorji Pallonji Vanaha GolfLand 2 | A Space For You To Find Your SpaceShapoorji Pallonji Vanaha GolfLand 2 | A Space For You To Find Your Space
Shapoorji Pallonji Vanaha GolfLand 2 | A Space For You To Find Your Spaceaidasheikh47
 
Clemson Engineering Consultant Dubai For Innovative and Sustainable Engineeri...
Clemson Engineering Consultant Dubai For Innovative and Sustainable Engineeri...Clemson Engineering Consultant Dubai For Innovative and Sustainable Engineeri...
Clemson Engineering Consultant Dubai For Innovative and Sustainable Engineeri...Clemson Engineering Consultant
 
LCAR Unit 22 - Leasing and Property Management - 14th Edition Revised.pptx
LCAR Unit 22 - Leasing and Property Management - 14th Edition Revised.pptxLCAR Unit 22 - Leasing and Property Management - 14th Edition Revised.pptx
LCAR Unit 22 - Leasing and Property Management - 14th Edition Revised.pptxTom Blefko
 
Fractional Ownership Vs Physical Ownership.pdf
Fractional Ownership Vs Physical Ownership.pdfFractional Ownership Vs Physical Ownership.pdf
Fractional Ownership Vs Physical Ownership.pdfHavendaxa
 
LCAR RE Practice - The Pearson Vue State Exam
LCAR RE Practice - The Pearson Vue State ExamLCAR RE Practice - The Pearson Vue State Exam
LCAR RE Practice - The Pearson Vue State ExamTom Blefko
 
LCAR Unit 19 - Financing the Real Estate Transaction - 14th Edition Revised
LCAR Unit 19 - Financing the Real Estate Transaction - 14th Edition RevisedLCAR Unit 19 - Financing the Real Estate Transaction - 14th Edition Revised
LCAR Unit 19 - Financing the Real Estate Transaction - 14th Edition RevisedTom Blefko
 
Triaa Housing Lohegaon Pune E-Brochure.pdf
Triaa Housing Lohegaon Pune  E-Brochure.pdfTriaa Housing Lohegaon Pune  E-Brochure.pdf
Triaa Housing Lohegaon Pune E-Brochure.pdfManishSaxena95
 
Kolte Patil Mirabilis at Horamavu Road, Bangalore E brochure.pdf
Kolte Patil Mirabilis at Horamavu Road, Bangalore E brochure.pdfKolte Patil Mirabilis at Horamavu Road, Bangalore E brochure.pdf
Kolte Patil Mirabilis at Horamavu Road, Bangalore E brochure.pdfAhanundefined
 
Listing Turkey - Viva Perla Maltepe Catalog
Listing Turkey - Viva Perla Maltepe CatalogListing Turkey - Viva Perla Maltepe Catalog
Listing Turkey - Viva Perla Maltepe CatalogListing Turkey
 
Pride Wonderland Dhanori Pune Brochure.pdf
Pride Wonderland Dhanori Pune Brochure.pdfPride Wonderland Dhanori Pune Brochure.pdf
Pride Wonderland Dhanori Pune Brochure.pdfabbu831446
 
Experion Elements Sector 45 Noida_Brochure.pdf.pdf
Experion Elements Sector 45 Noida_Brochure.pdf.pdfExperion Elements Sector 45 Noida_Brochure.pdf.pdf
Experion Elements Sector 45 Noida_Brochure.pdf.pdfkratirudram
 
Brigade Neopolis Kokapet, Hyderabad E- Brochure
Brigade Neopolis Kokapet, Hyderabad E- BrochureBrigade Neopolis Kokapet, Hyderabad E- Brochure
Brigade Neopolis Kokapet, Hyderabad E- Brochurefaheemali990101
 
Shriram Hebbal One Kempapura Bangalore E- Brochure.pdf
Shriram Hebbal One Kempapura Bangalore E- Brochure.pdfShriram Hebbal One Kempapura Bangalore E- Brochure.pdf
Shriram Hebbal One Kempapura Bangalore E- Brochure.pdffaheemali990101
 
Honer Richmont Hyderabad E brochure - A Life With A View
Honer Richmont Hyderabad E brochure - A Life With A ViewHoner Richmont Hyderabad E brochure - A Life With A View
Honer Richmont Hyderabad E brochure - A Life With A ViewAhanundefined
 
Ganga Fusion 85 Gurugram - PDF Download.pdf
Ganga Fusion 85 Gurugram - PDF Download.pdfGanga Fusion 85 Gurugram - PDF Download.pdf
Ganga Fusion 85 Gurugram - PDF Download.pdfanjalisaini334541
 
Radiance Majestic Valasaravakkam Chennai.pdf
Radiance Majestic Valasaravakkam Chennai.pdfRadiance Majestic Valasaravakkam Chennai.pdf
Radiance Majestic Valasaravakkam Chennai.pdfashiyadav24
 
Kohinoor Hinjewadi Phase 2 In Pune - PDF.pdf
Kohinoor Hinjewadi Phase 2 In Pune - PDF.pdfKohinoor Hinjewadi Phase 2 In Pune - PDF.pdf
Kohinoor Hinjewadi Phase 2 In Pune - PDF.pdfmonikasharma630
 
LCAR RE Practice - The Power of Your Database
LCAR RE Practice - The Power of Your DatabaseLCAR RE Practice - The Power of Your Database
LCAR RE Practice - The Power of Your DatabaseTom Blefko
 

Recently uploaded (20)

Listing Turkey - Resim Modern Catalog Istanbul
Listing Turkey - Resim Modern Catalog IstanbulListing Turkey - Resim Modern Catalog Istanbul
Listing Turkey - Resim Modern Catalog Istanbul
 
Mana Dale Kodathi, Sarjapur Road, Bangalore E-Brochure.pdf
Mana Dale Kodathi, Sarjapur Road, Bangalore E-Brochure.pdfMana Dale Kodathi, Sarjapur Road, Bangalore E-Brochure.pdf
Mana Dale Kodathi, Sarjapur Road, Bangalore E-Brochure.pdf
 
Shapoorji Pallonji Vanaha GolfLand 2 | A Space For You To Find Your Space
Shapoorji Pallonji Vanaha GolfLand 2 | A Space For You To Find Your SpaceShapoorji Pallonji Vanaha GolfLand 2 | A Space For You To Find Your Space
Shapoorji Pallonji Vanaha GolfLand 2 | A Space For You To Find Your Space
 
Clemson Engineering Consultant Dubai For Innovative and Sustainable Engineeri...
Clemson Engineering Consultant Dubai For Innovative and Sustainable Engineeri...Clemson Engineering Consultant Dubai For Innovative and Sustainable Engineeri...
Clemson Engineering Consultant Dubai For Innovative and Sustainable Engineeri...
 
LCAR Unit 22 - Leasing and Property Management - 14th Edition Revised.pptx
LCAR Unit 22 - Leasing and Property Management - 14th Edition Revised.pptxLCAR Unit 22 - Leasing and Property Management - 14th Edition Revised.pptx
LCAR Unit 22 - Leasing and Property Management - 14th Edition Revised.pptx
 
Fractional Ownership Vs Physical Ownership.pdf
Fractional Ownership Vs Physical Ownership.pdfFractional Ownership Vs Physical Ownership.pdf
Fractional Ownership Vs Physical Ownership.pdf
 
LCAR RE Practice - The Pearson Vue State Exam
LCAR RE Practice - The Pearson Vue State ExamLCAR RE Practice - The Pearson Vue State Exam
LCAR RE Practice - The Pearson Vue State Exam
 
LCAR Unit 19 - Financing the Real Estate Transaction - 14th Edition Revised
LCAR Unit 19 - Financing the Real Estate Transaction - 14th Edition RevisedLCAR Unit 19 - Financing the Real Estate Transaction - 14th Edition Revised
LCAR Unit 19 - Financing the Real Estate Transaction - 14th Edition Revised
 
Triaa Housing Lohegaon Pune E-Brochure.pdf
Triaa Housing Lohegaon Pune  E-Brochure.pdfTriaa Housing Lohegaon Pune  E-Brochure.pdf
Triaa Housing Lohegaon Pune E-Brochure.pdf
 
Kolte Patil Mirabilis at Horamavu Road, Bangalore E brochure.pdf
Kolte Patil Mirabilis at Horamavu Road, Bangalore E brochure.pdfKolte Patil Mirabilis at Horamavu Road, Bangalore E brochure.pdf
Kolte Patil Mirabilis at Horamavu Road, Bangalore E brochure.pdf
 
Listing Turkey - Viva Perla Maltepe Catalog
Listing Turkey - Viva Perla Maltepe CatalogListing Turkey - Viva Perla Maltepe Catalog
Listing Turkey - Viva Perla Maltepe Catalog
 
Pride Wonderland Dhanori Pune Brochure.pdf
Pride Wonderland Dhanori Pune Brochure.pdfPride Wonderland Dhanori Pune Brochure.pdf
Pride Wonderland Dhanori Pune Brochure.pdf
 
Experion Elements Sector 45 Noida_Brochure.pdf.pdf
Experion Elements Sector 45 Noida_Brochure.pdf.pdfExperion Elements Sector 45 Noida_Brochure.pdf.pdf
Experion Elements Sector 45 Noida_Brochure.pdf.pdf
 
Brigade Neopolis Kokapet, Hyderabad E- Brochure
Brigade Neopolis Kokapet, Hyderabad E- BrochureBrigade Neopolis Kokapet, Hyderabad E- Brochure
Brigade Neopolis Kokapet, Hyderabad E- Brochure
 
Shriram Hebbal One Kempapura Bangalore E- Brochure.pdf
Shriram Hebbal One Kempapura Bangalore E- Brochure.pdfShriram Hebbal One Kempapura Bangalore E- Brochure.pdf
Shriram Hebbal One Kempapura Bangalore E- Brochure.pdf
 
Honer Richmont Hyderabad E brochure - A Life With A View
Honer Richmont Hyderabad E brochure - A Life With A ViewHoner Richmont Hyderabad E brochure - A Life With A View
Honer Richmont Hyderabad E brochure - A Life With A View
 
Ganga Fusion 85 Gurugram - PDF Download.pdf
Ganga Fusion 85 Gurugram - PDF Download.pdfGanga Fusion 85 Gurugram - PDF Download.pdf
Ganga Fusion 85 Gurugram - PDF Download.pdf
 
Radiance Majestic Valasaravakkam Chennai.pdf
Radiance Majestic Valasaravakkam Chennai.pdfRadiance Majestic Valasaravakkam Chennai.pdf
Radiance Majestic Valasaravakkam Chennai.pdf
 
Kohinoor Hinjewadi Phase 2 In Pune - PDF.pdf
Kohinoor Hinjewadi Phase 2 In Pune - PDF.pdfKohinoor Hinjewadi Phase 2 In Pune - PDF.pdf
Kohinoor Hinjewadi Phase 2 In Pune - PDF.pdf
 
LCAR RE Practice - The Power of Your Database
LCAR RE Practice - The Power of Your DatabaseLCAR RE Practice - The Power of Your Database
LCAR RE Practice - The Power of Your Database
 

March 2014 Greater Boston Real Estate Market Trends Report

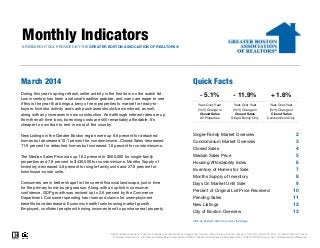
  • 1. Monthly IndicatorsA RESEARCH TOOL PROVIDED BY THE GREATER BOSTON ASSOCIATION OF REALTORS® March 2014 Quick Facts 2 3 4 5 6 7 8 9 10 11 12 13 Housing Affordability Index Inventory of Homes for Sale Click on desired metric to jump to that page. Months Supply of Inventory Days On Market Until Sale Percent of Original List Price Received City of Boston Overview Pending Sales New Listings Data is refreshed regularly to capture changes in market activity so figures shown may be different than previously reported. Current as of April 16, 2014. All data from MLS Property Information Network, Inc. Provided by Greater Boston Association of REALTORS® and the Massachusetts Association of REALTORS®. Powered by 10K Research and Marketing. - 11.9% Year-Over-Year (YoY) Change in Closed Sales Single-Family Only During this year's spring refresh, seller activity is the first item on the watch list. Low inventory has been a national headline grabber, and many are eager to see if this is the year that brings a bevy of new properties to market for ready-to- buyers. Investor activity and cash purchases should be monitored, as well, along with any increases in new construction. And although interest rates are up from their all-time lows, borrowing costs are still remarkably affordable. It's cheaper to own than to rent in most of the country. New Listings in the Greater Boston region were up 8.6 percent for detached homes but decreased 10.1 percent for condominiums. Closed Sales decreased 11.9 percent for detached homes but increased 1.6 percent for condominiums. The Median Sales Price was up 16.3 percent to $500,000 for single-family properties and 7.8 percent to $436,500 for condominiums. Months Supply of Inventory decreased 4.8 percent for single-family units and 27.8 percent for townhouse-condo units. Consumers are in better shape for the current financial landscape, just in time for the primary home-buying season. Along with an uptick in consumer confidence, GDP growth was revised up to 2.6 percent by the Commerce Department. Consumer spending has risen and claims for unemployment benefits have decreased. Economic health fuels housing market growth. Employed, confident people with rising incomes tend to purchase real property. + 1.6% Year-Over-Year (YoY) Change in Closed Sales Condominium Only - 5.1% Year-Over-Year (YoY) Change in Closed Sales All Properties Single-Family Market Overview Condominium Market Overview Closed Sales Median Sales Price
  • 2. Single-Family Market Overview Key market metrics for the current month and year-to-date figures for Single-Family Homes Only. Key Metrics Historical Sparklines Mar-2013 Mar-2014 + / – YTD 2013 YTD 2014 + / – 1,518 - 7.3% All data from MLS Property Information Network, Inc. Provided by the Greater Boston Association of REALTORS® and the Massachusetts Association of REALTORS®. Powered by 10K Research and Marketing. | Click for Cover Page | 2 New Listings 1,343 1,459 + 8.6% 3,197 3,129 - 2.1% Closed Sales 616 543 - 11.9% 1,638 $490,813 + 14.1% 107 121 96 83 -- -- -- 2,377 1,994 3.7 - 4.8% $500,000 + 16.3% $430,000 109 Housing Affordability Index Inventory of Homes for Sale Months Supply of Inventory 3.9 $430,101 Pending Sales Median Sales Price - 7.1%2,3121,164 1,120 - 3.8% 2,488 - 16.1% -- -- - 21.0% 121 97 - 19.8% -- 94.4% 96.3% - 23.8% + 2.0% Percent of Original List Price Received Days on Market Until Sale 95.2% - 23.1% + 2.0% 82 97.0% 3-2011 3-2012 3-2013 3-2014 3-2011 3-2012 3-2013 3-2014 3-2011 3-2012 3-2013 3-2014 3-2011 3-2012 3-2013 3-2014 3-2011 3-2012 3-2013 3-2014 3-2011 3-2012 3-2013 3-2014 3-2011 3-2012 3-2013 3-2014 3-2011 3-2012 3-2013 3-2014 3-2011 3-2012 3-2013 3-2014
  • 3. Condominium Market Overview Key market metrics for the current month and year-to-date figures for Condominium Properties Only. Key Metrics Historical Sparklines Mar-2013 Mar-2014 + / – YTD 2013 YTD 2014 + / – - 11.6% All data from MLS Property Information Network, Inc. Provided by the Greater Boston Association of REALTORS® and the Massachusetts Association of REALTORS®. Powered by 10K Research and Marketing. | Click for Cover Page | 3 New Listings 1,342 1,206 - 10.1% 3,194 2,824 + 1.4% Pending Sales 1,162 1,031 - 11.3% 2,530 2,367 - 6.4% Percent of Original List Price Received 97.6% 98.9% + 1.3% 96.8% 98.2% -- Days on Market Until Sale 71 65 - 8.7% 84 68 - 18.6% Months Supply of Inventory 2.8 2.0 - 27.8% -- -- - 18.0% Inventory of Homes for Sale 1,735 1,273 - 26.6% -- -- -- Housing Affordability Index 128 109 - 15.2% 135 111 + 0.4% Median Sales Price $405,000 $436,500 + 7.8% $379,000 $424,930 + 12.1% Closed Sales 628 638 + 1.6% 1,577 1,583 3-2011 3-2012 3-2013 3-2014 3-2011 3-2012 3-2013 3-2014 3-2011 3-2012 3-2013 3-2014 3-2011 3-2012 3-2013 3-2014 3-2011 3-2012 3-2013 3-2014 3-2011 3-2012 3-2013 3-2014 3-2011 3-2012 3-2013 3-2014 3-2011 3-2012 3-2013 3-2014 3-2011 3-2012 3-2013 3-2014
  • 4. Closed Sales A count of the actual sales that have closed in a given month. Single-Family YoY Change Condominium YoY Change Apr-2013 767 + 4.4% 805 + 6.5% May-2013 1,096 + 10.0% 1,068 + 6.4% Jun-2013 1,481 - 1.1% 1,246 - 1.0% Jul-2013 1,488 + 18.0% 1,252 + 20.7% Aug-2013 1,429 + 11.6% 1,277 + 6.2% Sep-2013 919 + 22.4% 887 + 18.7% Oct-2013 855 + 10.5% 764 + 7.5% Nov-2013 791 - 11.4% 711 - 5.8% Dec-2013 899 + 10.4% 790 + 3.1% Jan-2014 569 - 4.7% 525 + 2.1% Feb-2014 406 - 4.5% 420 - 3.4% Mar-2014 543 - 11.9% 638 + 1.6% Total 11,243 + 5.7% 10,383 + 5.8% All data from MLS Property Information Network, Inc. Provided by the Greater Boston Association of REALTORS® and the Massachusetts Association of REALTORS®. Powered by 10K Research and Marketing. | Click for Cover Page | 4 640 606616 628 543 638 Single-Family Condominium March 200 400 600 800 1,000 1,200 1,400 1,600 1,800 Jan-2003 Jan-2004 Jan-2005 Jan-2006 Jan-2007 Jan-2008 Jan-2009 Jan-2010 Jan-2011 Jan-2012 Jan-2013 Jan-2014 Historical Closed Sales Activity Single-Family Condominium +1.6%+3.6%-3.8% 20142013 20142013 1,620 1,400 1,638 1,577 1,518 1,583 Single-Family Condominium Year to Date +0.4%+12.6%+1.1% 20142013 20142013 -11.9% -7.3% 2012 2012 2012 2012
  • 5. Median Sales Price Median price point for all closed sales, not accounting for seller concessions, in a given month. Single-Family YoY Change Condominium YoY Change Apr-2013 $480,000 + 14.3% $387,500 + 4.3% May-2013 $500,000 + 7.2% $410,000 + 7.5% Jun-2013 $545,000 + 8.1% $420,000 + 5.0% Jul-2013 $533,000 + 4.1% $400,500 + 3.5% Aug-2013 $520,000 + 5.3% $416,000 + 9.5% Sep-2013 $502,500 + 15.5% $410,000 + 9.3% Oct-2013 $474,000 + 9.0% $416,750 + 13.8% Nov-2013 $480,000 + 6.7% $410,500 + 8.0% Dec-2013 $500,000 + 6.4% $420,400 + 10.5% Jan-2014 $486,575 + 13.2% $421,500 + 14.2% Feb-2014 $479,950 + 11.6% $400,000 + 14.3% Mar-2014 $500,000 + 16.3% $436,500 + 7.8% Median $507,613 + 9.2% $412,250 + 8.0% All data from MLS Property Information Network, Inc. Provided by the Greater Boston Association of REALTORS® and the Massachusetts Association of REALTORS®. Powered by 10K Research and Marketing. | Click for Cover Page | 5 $415,000 $340,000 $430,101 $405,000 $500,000 $436,500 Single-Family Condominium March $250,000 $300,000 $350,000 $400,000 $450,000 $500,000 $550,000 Jan-2003 Jan-2004 Jan-2005 Jan-2006 Jan-2007 Jan-2008 Jan-2009 Jan-2010 Jan-2011 Jan-2012 Jan-2013 Jan-2014 Historical Median Sales Price Single-Family Condominium +7.8%+19.1%+3.6% 20142013 20142013 $409,500 $350,000 $430,000 $379,000 $490,813 $424,930 Single-Family Condominium Year to Date +12.1%+8.3%+5.0% 20142013 20142013 +16.3% +14.1% 2012 2012 2012 2012
  • 6. Housing Affordability Index Single-Family YoY Change Condominium YoY Change Apr-2013 112 - 5.3% 136 + 2.9% May-2013 104 - 4.8% 124 - 4.9% Jun-2013 90 - 11.8% 114 - 9.2% Jul-2013 92 - 9.2% 120 - 8.5% Aug-2013 93 - 11.0% 115 - 13.9% Sep-2013 98 - 18.5% 118 - 14.0% Oct-2013 103 - 13.4% 116 - 16.6% Nov-2013 108 - 6.7% 125 - 7.6% Dec-2013 99 - 11.9% 117 - 14.6% Jan-2014 96 - 22.6% 110 - 23.0% Feb-2014 99 - 18.4% 117 - 19.9% Mar-2014 96 - 21.0% 109 - 15.2% Average 99 -12.9% 118 -12.0% This index measures housing affordability for the region. An index of 120 means the median household income was 120% of what is necessary to qualify for the median-priced home under prevailing interest rates. A higher number means greater affordability. All data from MLS Property Information Network, Inc. Provided by the Greater Boston Association of REALTORS® and the Massachusetts Association of REALTORS®. Powered by 10K Research and Marketing. | Click for Cover Page | 6 117 141 121 128 96 109 Single-Family Condominium March 60 70 80 90 100 110 120 130 140 150 160 Jan-2004 Jan-2005 Jan-2006 Jan-2007 Jan-2008 Jan-2009 Jan-2010 Jan-2011 Jan-2012 Jan-2013 Jan-2014 Historical Housing Affordability Index Single-Family Condominium -15.2%-8.8%+3.4% 119 137 121 135 97 111 Single-Family Condominium Year to Date -18.0%-1.2%+2.2% 20142013 20142013 20142013 20142013 -21.0% -19.8% 2012 2012 2012 2012
  • 7. Inventory of Homes for Sale The number of properties available for sale in active status at the end of a given month. Single-Family YoY Change Condominium YoY Change Apr-2013 2,769 - 34.8% 1,978 - 40.0% May-2013 3,039 - 30.7% 2,077 - 34.8% Jun-2013 3,031 - 26.6% 2,032 - 31.6% Jul-2013 2,865 - 24.9% 1,865 - 31.9% Aug-2013 2,758 - 23.4% 1,747 - 28.0% Sep-2013 3,000 - 20.3% 1,965 - 22.3% Oct-2013 2,884 - 17.1% 1,895 - 18.4% Nov-2013 2,420 - 18.9% 1,581 - 21.1% Dec-2013 1,844 - 19.7% 1,252 - 17.8% Jan-2014 1,806 - 21.2% 1,227 - 22.5% Feb-2014 1,904 - 20.7% 1,262 - 25.8% Mar-2014 1,994 - 16.1% 1,273 - 26.6% Average 2,526 - 23.8% 1,680 - 28.1% All data from MLS Property Information Network, Inc. Provided by the Greater Boston Association of REALTORS® and the Massachusetts Association of REALTORS®. Powered by 10K Research and Marketing. | Click for Cover Page | 7 4,006 3,268 2,377 1,735 1,994 1,273 Single-Family Condominium March 1,000 2,000 3,000 4,000 5,000 6,000 7,000 8,000 9,000 Jan-2003 Jan-2004 Jan-2005 Jan-2006 Jan-2007 Jan-2008 Jan-2009 Jan-2010 Jan-2011 Jan-2012 Jan-2013 Jan-2014 Historical Inventory of Homes for Sale Single-Family Condominium -26.6%-46.9%-40.7% 20142013 20142013 -16.1% 2012 2012
  • 8. Months Supply of Inventory The inventory of homes for sale at the end of a given month, divided by the average monthly pending sales from the last 12 months. Single-Family YoY Change Condominium YoY Change Apr-2013 3.6 - 37.6% 2.5 - 43.7% May-2013 2.8 - 37.0% 1.9 - 38.7% Jun-2013 2.0 - 25.9% 1.6 - 30.9% Jul-2013 1.9 - 36.4% 1.5 - 43.6% Aug-2013 1.9 - 31.4% 1.4 - 32.2% Sep-2013 3.3 - 34.9% 2.2 - 34.5% Oct-2013 3.4 - 24.9% 2.5 - 24.1% Nov-2013 3.1 - 8.4% 2.2 - 16.3% Dec-2013 2.1 - 27.3% 1.6 - 20.3% Jan-2014 3.2 - 17.4% 2.3 - 24.1% Feb-2014 4.7 - 17.0% 3.0 - 23.2% Mar-2014 3.7 - 4.8% 2.0 - 27.8% Average 2.7 - 31.1% 2.0 - 36.6% All data from MLS Property Information Network, Inc. Provided by the Greater Boston Association of REALTORS® and the Massachusetts Association of REALTORS®. Powered by 10K Research and Marketing. | Click for Cover Page | 8 6.3 5.4 3.9 2.8 3.7 2.0 Single-Family Condominium March 0 2 4 6 8 10 12 14 16 Jan-2004 Jan-2005 Jan-2006 Jan-2007 Jan-2008 Jan-2009 Jan-2010 Jan-2011 Jan-2012 Jan-2013 Jan-2014 Historical Months Supply of Inventory Single-Family Condominium -27.8%-48.8%-38.4% 20142013 20142013 -4.8% 2012 2012
  • 9. Days on Market Until Sale Average number of days between when a property is listed and when an offer is accepted in a given month. Single-Family YoY Change Condominium YoY Change Apr-2013 93 - 22.8% 63 - 35.1% May-2013 75 - 22.3% 51 - 40.3% Jun-2013 56 - 37.8% 43 - 42.4% Jul-2013 47 - 41.6% 38 - 46.2% Aug-2013 48 - 45.0% 40 - 47.1% Sep-2013 57 - 36.1% 49 - 42.0% Oct-2013 59 - 33.7% 47 - 43.9% Nov-2013 65 - 27.2% 51 - 33.6% Dec-2013 70 - 28.0% 55 - 34.2% Jan-2014 79 - 27.5% 63 - 28.8% Feb-2014 89 - 19.7% 79 - 17.7% Mar-2014 82 - 23.1% 65 - 8.7% Total 64 - 32.4% 48 - 35.8% All data from MLS Property Information Network, Inc. Provided by the Greater Boston Association of REALTORS® and the Massachusetts Association of REALTORS®. Powered by 10K Research and Marketing. | Click for Cover Page | 9 130 117 107 71 82 65 Single-Family Condominium March 30 50 70 90 110 130 150 Jan-2003 Jan-2004 Jan-2005 Jan-2006 Jan-2007 Jan-2008 Jan-2009 Jan-2010 Jan-2011 Jan-2012 Jan-2013 Jan-2014 Historical Days on Market Until Sale Single-Family Condominium -8.7%-39.0%-17.4% 131 121 109 8483 68 Single-Family Condominium Year to Date -18.6%-31.0%-17.1% 20142013 20142013 20142013 20142013 -23.1% -23.8% 2012 2012 2012 2012
  • 10. Percent of Original List Price Received Single-Family YoY Change Condominium YoY Change Apr-2013 96.7% + 3.5% 98.8% + 3.2% May-2013 97.8% + 2.6% 99.5% + 3.5% Jun-2013 98.4% + 3.3% 99.7% + 3.5% Jul-2013 98.1% + 2.4% 99.9% + 3.5% Aug-2013 97.9% + 3.3% 99.7% + 3.5% Sep-2013 97.3% + 3.0% 99.0% + 2.6% Oct-2013 97.2% + 3.0% 98.8% + 3.1% Nov-2013 96.3% + 1.7% 98.9% + 2.8% Dec-2013 95.9% + 1.8% 98.0% + 1.9% Jan-2014 95.8% + 2.0% 97.4% + 1.6% Feb-2014 96.0% + 2.0% 98.1% + 1.5% Mar-2014 97.0% + 2.0% 98.9% + 1.3% Average 97.3% + 2.7% 99.1% + 2.9% All data from MLS Property Information Network, Inc. Provided by the Greater Boston Association of REALTORS® and the Massachusetts Association of REALTORS®. Powered by 10K Research and Marketing. | Click for Cover Page | 10 Percentage found when dividing a property’s sales price by its original list price, then taking the average for all properties sold in a given month, not accounting for seller concessions. 93.0% 94.0%95.2% 97.6%97.0% 98.9% Single-Family Condominium March 89% 91% 93% 95% 97% 99% 101% Jan-2003 Jan-2004 Jan-2005 Jan-2006 Jan-2007 Jan-2008 Jan-2009 Jan-2010 Jan-2011 Jan-2012 Jan-2013 Jan-2014 Historical Percent of Original List Price Received Single-Family Condominium +1.3%+3.8%+2.3% 91.7% 93.5%94.4% 96.8%96.3% 98.2% Single-Family Condominium Year to Date +1.4%+3.4%+3.0% 20142013 20142013 20142013 20142013 +2.0% +2.0% 2012 2012 2012 2012
  • 11. Pending Sales A count of the properties in UAG status between the first and last day in a given month, regardless of current status (based on Off Market Date). Single-Family YoY Change Condominium YoY Change Apr-2013 1,380 + 12.4% 1,269 + 9.1% May-2013 1,477 + 15.6% 1,257 + 6.7% Jun-2013 1,283 + 9.4% 1,089 + 9.9% Jul-2013 976 + 4.6% 951 + 19.6% Aug-2013 887 + 15.2% 758 + 4.0% Sep-2013 835 - 2.0% 782 + 6.8% Oct-2013 940 + 8.3% 814 + 3.0% Nov-2013 701 + 3.1% 635 + 7.1% Dec-2013 476 - 5.0% 420 - 8.5% Jan-2014 516 - 17.0% 607 - 7.5% Feb-2014 676 - 3.7% 729 + 2.4% Mar-2014 1,120 - 3.8% 1,031 - 11.3% Total 11,267 + 4.6% 10,342 + 3.8% All data from MLS Property Information Network, Inc. Provided by the Greater Boston Association of REALTORS® and the Massachusetts Association of REALTORS®. Powered by 10K Research and Marketing. | Click for Cover Page | 11 1,142 1,065 1,164 1,162 1,120 1,031 Single-Family Condominium March 200 400 600 800 1,000 1,200 1,400 1,600 1,800 2,000 2,200 Jan-2003 Jan-2004 Jan-2005 Jan-2006 Jan-2007 Jan-2008 Jan-2009 Jan-2010 Jan-2011 Jan-2012 Jan-2013 Jan-2014 Historical Pending Sales Activity Single-Family Condominium -11.3%+9.1%+1.9% 2,500 2,362 2,488 2,530 2,312 2,367 Single-Family Condominium Year to Date -6.4%+7.1%-0.5% 20142013 20142013 20142013 20142013 -3.8% -7.1% 2012 2012 2012 2012
  • 12. New Listings A count of the properties that have been newly listed on the market in a given month. Single-Family YoY Change Condominium YoY Change Apr-2013 1,994 + 14.6% 1,661 + 13.5% May-2013 1,981 + 14.4% 1,532 + 12.6% Jun-2013 1,505 + 15.1% 1,223 + 7.9% Jul-2013 1,116 + 12.4% 993 + 12.3% Aug-2013 1,030 + 6.0% 867 + 11.7% Sep-2013 1,455 + 6.3% 1,253 + 11.0% Oct-2013 1,219 + 18.7% 1,009 + 17.2% Nov-2013 651 + 4.5% 554 + 0.4% Dec-2013 397 + 13.4% 361 + 17.6% Jan-2014 732 - 15.9% 739 - 18.1% Feb-2014 938 - 4.7% 879 - 7.5% Mar-2014 1,459 + 8.6% 1,206 - 10.1% Total 14,477 + 8.8% 12,277 + 5.3% All data from MLS Property Information Network, Inc. Provided by the Greater Boston Association of REALTORS® and the Massachusetts Association of REALTORS®. Powered by 10K Research and Marketing. | Click for Cover Page | 12 1,936 1,700 1,343 1,342 1,459 1,206 Single-Family Condominium March 0 250 500 750 1,000 1,250 1,500 1,750 2,000 2,250 2,500 2,750 Jan-2003 Jan-2004 Jan-2005 Jan-2006 Jan-2007 Jan-2008 Jan-2009 Jan-2010 Jan-2011 Jan-2012 Jan-2013 Jan-2014 Historical New Listing Activity Single-Family Condominium -10.1%-21.1%-30.6% 4,127 3,738 3,197 3,1943,129 2,824 Single-Family Condominium Year to Date -11.6%-14.6%-22.5% 20142013 20142013 20142013 20142013 +8.6% -2.1% 2012 2012 2012 2012
  • 13. City of Boston – Market Overview Key market metrics for the current month and year-to-date figures for the City of Boston. Key Metrics Historical Sparklines Mar-2013 Mar-2014 + / – YTD 2013 YTD 2014 + / – - 13.3% All data from MLS Property Information Network, Inc. Provided by the Greater Boston Association of REALTORS® and the Massachusetts Association of REALTORS®. Powered by 10K Research and Marketing. | Click for Cover Page | 13 New Listings 722 647 - 10.4% 1,755 1,521 + 1.4% Pending Sales 632 559 - 11.6% 1,370 1,256 - 8.3% Percent of Original List Price Received 97.6% 99.1% + 1.6% 96.9% 98.2% -- Days on Market Until Sale 65 61 - 6.0% 73 65 - 10.7% Months Supply of Inventory 2.4 1.9 - 19.1% -- -- - 19.8% Inventory of Homes for Sale 847 654 - 22.8% -- -- -- Housing Affordability Index 121 96 - 21.0% 121 97 + 2.6% Median Sales Price $415,000 $500,000 + 20.5% $408,750 $485,000 + 18.7% Closed Sales 352 336 - 4.5% 849 871 3-2011 3-2012 3-2013 3-2014 3-2011 3-2012 3-2013 3-2014 3-2011 3-2012 3-2013 3-2014 3-2011 3-2012 3-2013 3-2014 3-2011 3-2012 3-2013 3-2014 3-2011 3-2012 3-2013 3-2014 3-2011 3-2012 3-2013 3-2014 3-2011 3-2012 3-2013 3-2014 3-2011 3-2012 3-2013 3-2014