1. Genetically engineering E. coli to insert a pET-41a
vector containing egfp and cloning this new DNA into
colonies to be visualized under a UV light.
Beginning Information:
We were to clone the gene for enhanced green fluorescent protein (egfp) into E. coli.
1. Isolated plasmid DNA from small cultures of E. coli harboring the egfp gene on a plasmid
a. In molecular biology, Escherichia coli servers as a factory for the synthesis of
large amounts of cloned DNA.
b. The most common method used for separating plasmid DNA from chromosomal
DNA is the alkaline lysis method developed by Birnboin and Doly.
c. Precipitated chromosomal DNA is usually removed by filtration or centrifugation.
d. Highly purified plasmid DNA can be eluted from a column using a high-salt
buffer.
2. Used PCR to isolate the egfp gene, then digest using restriction enzymes to make sticky
ends.
a. pEGFP-N1 contains the egfp gene.
b. The PCR primers we were using were specially engineered to have restriction
sites incorporated into them, so that when our PCR reaction was complete, we
would be able to digest the PCR product so that it would have sticky ends for
cloning.
3. Used DNA ligase to “paste” the egfp gene into the expression vector pET-41a
a. An expression vector is a plasmid that has all the components necessary to
express a recombinant protein, including a promoter, ribosome binding site, and
restriction sites that allow the cloning of a gene in the correct orientation and
correct reading fram with respect to the translational start codon.
b. Purification of pET-41a is identical to the purification of pEGFP-N1.
c. We are to use a plasmid already double-digested with Nco I and Not I.
d. DNA ligase catalyzes covalent bond formation between the 3’OH and 5’PO4 on
DNA.
e. Ligation reactions are generally set up in small volumes of 10-20 uL so that
compatible ends will not be too dilute in solution.
4. Transformed the ligated recombinant DNA into E. coli.
a. Competent cells are extremely fragile.
b. Never warm competent cells to room temperature because they will start
repairing their membranes and will lose competency.
c. Do NOT centrifuge competent cells before use because you cannot get them
back into suspension.
5. Identified bacterial transformants having egfp DNA inserts by visualization under UV
light.
2. a. Some colonies may harbor just vector alone.
b. Other colonies will harbor the vector with the egfp gene incorporated.
c. Positive colonies will glow green, while negatives will not.
Hypothesis:
If the egfp gene is digested using restriction enzymes to make sticky ends, then using DNA
ligase to paste the egfp gene into pET-41a, and the ligated recombinant DNA is transformed
into E. coli, then there will be bacterial transformants having egfp DNA inserts visible under UV
light.
Procedure:
One milliliter of E. coli strain NovaBlue, containing the pEGFP-N1 plasmid, was obtained in
a micro-centrifuge tube. The bacterial cells were pelleted in a centrifuge at 12,000 rpm for 30
seconds. After any extra supernatant was removed, 250 uL of Buffer P1 was added to the
bacterial pellets to create re-suspension until no cell clumps remained. Two hundred and fifty
micro-liters of Buffer P2 was then added and gently but thoroughly mixed by inversion five times
to create a lysis reaction that lasted no longer than 5 minutes. The lysis reaction then had 350
uL of Buffer N3 added and was also mixed by inversion five times. The reaction was centrifuged
for ten minutes at 13,000 rpm in a micro-centrifuge. The supernatant from the reaction was
added to a QIAprep spin column with a separate tube. The supernatant in the QIAprep spin
column was centrifuged for 30 seconds and the flow-through was discarded. The QIAprep spin
column was washed by adding 0.75 mL of Buffer PE and centrifuged for another 30 seconds.
Again, the flow-through was discarded and the spin column was centrifuged for another 60
seconds. The column was placed in a clean micro-centrifuge tube. To elute DNA, 50 uL of
Buffer EB was added to the center of the column and was left to stand for one minute, then
was centrifuged for one minute. DNA quantification using a Nanodrop was used to measure the
concentration of both the digested and uncut DNA.
To PCR amplify egfp from the pEGFP-N1 plasmid the volume of purified pEGFP-N1 DNA was
calculated to equal 500 ng using the formula: amount wanted (ng) / concentration (ng/uL) = uL
needed. The test tubes on ice had 12.5 uL of PCR Master Mix added, the volume calculated of
purified pEGFP-N1 DNA, and enough water to make the total volume 50 uL. The reaction was
mixed by flicking and then tapped down to keep reaction towards the bottom. The reaction was
then placed in a thermocycler and ran with the following settings:
1. Denatured 95°C 2 minutes
2. Denatured 95°C 30 seconds
3. Annealed 60°C 30 seconds
4. Extended 72°C 1 minute
5. Repeated steps 2 - 4 thirty times
6. Extended 72°C 5 minutes
7. Refrigerated 4°C indefintely
An agarose gel was ran to determine whether the PCR reaction was successful in amplifying
the ~700 bp egfp gene.
3. A Qiagen QIAquick PCR Purification Protocol was followed to remove the salts, enzyme,
and unused nucleotides from the PCR product. The PCR reaction had 190 uL of Buffer PB
added to it and was mixed. The reaction was placed in a QIAquick spin column with a 2 mL
collection tube and centrifuged for 30 seconds to bind the DNA. The column had 0.75 mL of
Buffer PE added and centrifuged for another 30 seconds then 60 seconds to wash; discarding
flow-through after each process. The column was added to a sterile 1.5 mL micro-centrifuge
tube and 50 uL of Buffer EB was added to the center of the membrane to elute the DNA, then
centrifuged for 1 minute. The purified DNA was transferred to a new micro-centrifuge tube. The
purified DNA was quantified using a Nanodrop.
The egfp PCR product was restriction digested. After all reagents were added the reaction was
mixed and spun for 5 seconds to bring contents to the bottom of the tube. The tube was placed
in a micro-fuge rack at 37°C for more than one hour. Enzymes and salts were removed using
the Qiagen QIAquick PCR Purification Kit Protocol on the digested PCR product and the DNA
was cleaned using a spin column. The concentration of DNA of the PCR product was taken
using a Nanodrop.
Three ligations were setup in micro-centrifuge tubes. The amount of pET-41a to add was
determined using: volume needed (uL) = 50ng / concentration (ng/uL). The amount of water
to add was calculated by subtraction 20 uL from all other volumes. Ligation #1 contained a 1:3
molar ration of pET-41a : egfp insert and was experimental. Ligation #2 was linear pET-41a and
was a no ligase control. Ligation #3 was circular pET-41a and was a control for competency of
cells and technique. After all ligations were created they were mixed gently and centrifuged for 5
seconds to bring contents to the bottom of the tube. The ligations were incubated for 10 minutes
at room temperature.
Three transformation were setup in micro-centrifuge tubes. The cells were verified that
they were in suspension with finger flicking and were aliquoted 20 uL into each of the
three transformations; while kept on ice at all times. The transformations had 2 uL of each
corresponding ligation mixes added directly to the bacterial suspension and were mixed gently.
The tubes were incubated on ice for two minutes. The tubes had 80 uL of SOC broth added to
each tube and were shaken for 45 minutes at 37°C. The individual ligations were mixed gently
and 100 uL of each was added to three plates respectively and incubated at 37°C upside down
overnight.
The dishes were inspected and counted for number of positive versus negative clones that were
obtained. It was determined that a positive was represented by glowing green while negative
would not glow green. A UV light box was used in determining clone counts.
Observations & Raw Data:
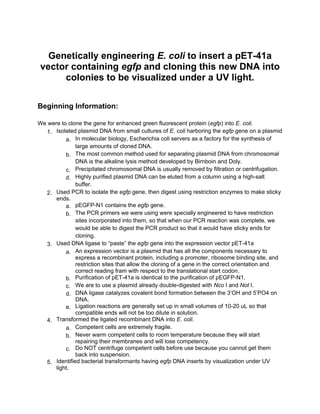
Figure 1 shows an agarose gel results from the restriction digestion of egfp PCR product with
Nco I and Not I. Lane one was a 1kb DNA ladder. Lane two had no clear DNA bands present.
Lane three had a DNA band near the well, a DNA band past the 10kb mark, and another
4. DNA band approximately at the ~3kb mark. Lane four had a DNA band at the same point past
the 10kb mark as well as the same DNA band at approximately ~3kb. Lane five was similar
to lane three and four because it had the same DNA band past the 10kb mark, a DNA band
approximately at the ~3kb mark, as well as an additional DNA band at the expected ~700 base
pair mark; however, the the amount of DNA was not significant. Finally, lane six did not follow
the same pattern as three, four, or five having DNA past the 10kb mark; however lane six did
have the DNA band at the ~3kb mark. On lane six there was a significant increase of DNA on
the ~700 base pair mark compared to lane five.
Figure 1: Agarose Gel Electrophoresis results from restriction digestion of egfp PCR product
with Nco I and Not I. Lane 1, ladder; Lane 2, Dylan’s; Lane 3, Mucahit’s; Lane 4, Chris’s; Lane
5, Tyler’s; Lane 6, Jordan’s.
Figure 2 shows a visualization of green fluorescence in positive clones. Plate one had an air
bubble in the kanomycin/IPTG coating on the bottom of the plate. Colonies were counted two
ways for each plate. First, colonies were visually counted without the aid of a UV light box, then
the plates were placed in a UV light box to allow positive colonies containing the vector with
the egfp gene to be determined via a green glow. Dark spots on the plates in figure 2 indicate a
negative colony while light spots would indicate a positive colony.
5. Figure 2: Visualization of green fluorescence in positive clones. Plate 1 contained 1:3 molar
ratio pET-41a(+) : egfp insert (experimental); Plate 2 (not shown) contained linear pET-41a(+);
Plate 3 contained circular (uncut) pET-41a(+) control (to control for competency of cells and
technique).
Chart 1 shows the number of colonies visible with naked eye vs. the number of colonies that
glowed green under the UV light box. Plate one contained 4 negative colonies that did not
harbor the vector with the egfp gene incorporated with the vector. Plate two contained zero
negative colonies and zero positive colonies. Plate three contained 33 negative colonies that
did not harbor the vector with the egfp gene incorporated with the vector. Plate one and two
contained 0 positive colonies that harbored the vector containing the egfp gene incorporated.
Chart 1: Number of colonies visible with naked eye vs. number of colonies that glowed green
under the UV light box. Plate 1 colonies without UV was four; under the UV light box, zero
6. colonies emitted a green glow. Plate 2 colonies without UV was 33; however, under the UV light
box zero colonies emitted a green glow.
Analysis & Conclusions:
As shown in Figure 1, there was a failure to PCR amplify the ~700 bp egfp gene in lane two
compared to the successful PCR amplification of the ~700 bp egfp gene in lane six. Also in
figure 1, lane two, there was a failed run of the egfp PCR product. This observation helped
troubleshoot where an error could have occurred. The failed agarose gel electrophoresis of lane
two as shown in figure 1 could have been from settled dye that wasn’t mixed before loading
resulting in the “smearing” effect. If it was suggested that the DNA purification had failed, there
would have been a zero concentration when nano-dropping the purified DNA; however, the
DNA was determined to be 311.8 ng/uL.
As shown in Figure 2 plate 1 and 3 were placed under a UV light box and zero of the colonies
emitted a green glow. This concluded there was also zero positive colonies in experimental
plate 1 containing the egfp insert as shown in Chart 1. Also, zero positive colonies in plate
3 containing circular (uncut) pET-41a(+), as expected because this control did not contain
egfp and was only a control for competency of cells which was passed according to chart 1
displaying 33 negative colonies. Plate 2 containing the linear uncut vector had zero negative
and positive colonies because linear DNA cannot be accepted by the E. coli for cloning;
therefore, passed it’s test as a control as expected.
So far plate 2 and 3 had passed their test as controls, however, it was expected that plate
1 would have had positive colonies harboring the vector with the egfp gene glowing green.
Interestingly, it was observed that plate 1 as shown in figure 2 had four colonies supposedly
containing the egfp insert; however, chart 1 shows that zero of the colonies were positive. There
could be multiple reasons for this mistake.
1. colonies did not contain egfp insert in plate 1
2. vector could have contained wrong and/or multiple inserts in plate 1
These observations did not support the hypothesis that if the egfp gene is digested using
restriction enzymes to make sticky ends, then using DNA ligase to paste the egfp gene into
pET-41a, and the ligated recombinant DNA is transformed into E. coli, then there will be
bacterial transformants having egfp DNA inserts visible under UV light. This was determined
because of the errors made during the experiment; including but not limited to, inaccurate data
provided from agarose gel electrophoresis showing a failure to PCR amplify the ~700 bp egfp
gene, colonies in plate 1 as shown in figure 2 did not contain egfp insert, and vector could have
contained wrong and/or multiple inserts in plate 1.
Reflection & Opinions:
7. Wow. This is the hardest I have tried on a lab report. I hope I did well. I enjoyed learning the
material and am getting a hang of this jargony jibble jabble. After this long lab unfortunately I’m
just ready to be finished.