1.
• Evalua'on
of
Es'mate
using
D
Sta's'c:
D=
Accuracy
Op*miza*on
Es*ma*ng
haplotype
frequencies
of
Drosophila
melanogaster
from
pooled
sequence
data
Devin
Petersohn*,
Aniqa
Rahman*
and
Elizabeth
King
*
co-‐first
authors
Abstract
Goals
and
Significance
• Selec'on
and
Popula'on
Studies
• Genotype/Phenotype
Mapping
• Big
data
processing
• Cost
effec've
data
collec'on
Acknowledgments
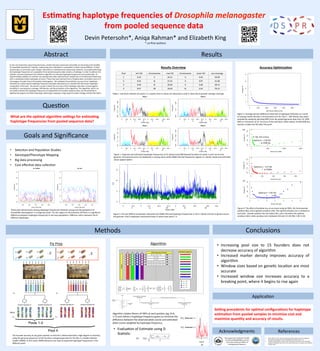
Results
Results
Overview
Methods
• Increasing
pool
size
to
15
founders
does
not
decrease
accuracy
of
algorithm
• Increased
marker
density
improves
accuracy
of
algorithm
• Window
sizes
based
on
gene'c
loca'on
are
most
accurate
• Increased
window
size
increases
accuracy
to
a
breaking
point,
where
it
begins
to
rise
again
References
1. Burke
MK
et
al.
2013.
Genome-‐wide
associa'on
study
of
extreme
longevity
in
Drosophila
melanogaster.
Genome
Biology
and
Evolu'on
6(1):1–11.
2.
King
EG,
Macdonald
SJ,
Long
AD.
2012.
Proper'es
and
power
of
the
Drosophila
Synthe'c
Popula'on
Resource
for
the
rou'ne
dissec'on
of
complex
traits.
Gene'cs
191:935–949.
D
S
P
R
Conclusions
This
project
was
funded
by
the
NSF,
the
NIH
(F32GM099382),
and
the
University
of
Missouri
Office
of
Undergraduate
Research.
Figure
1.
Expected
and
es'mated
haplotype
frequencies
of
A1
(above)
and
AB8
(below)
founders
for
pools
1
and
4
across
the
genome.
Chromosome
arms
are
displayed
in
varying
colors
while
HMM
inferred
frequencies
appear
in
a
darker
shade
and
es'mated
values
appear
lighter.
Fly
Prep
Pool
min
%D
chromosome
max
%D
chromosome
mean
%D
ave
coverage
1
0.24
X
24.51
X
4.24
59.90
2
0.55
2L
27.31
X
3.97
51.68
3
0.93
2L
20.69
X
5.68
28.75
4
0.47
2R
10.65
2L
2.54
70.12
Figure
2.
Percent
difference
between
es'mated
and
HMM
inferred
haplotype
frequencies
in
Pool
1
(blue)
and
Pool
4
(green)
across
the
genome.
Pool
4
displayed
consistently
lower
D
values
than
pools
1-‐3.
Figure
3.
Average
percent
difference
observed
in
haplotype
es'mates
as
a
result
of
varying
marker
density
in
chromosome
arm
2R,
Pool
1.
SNP
density
was
down-‐
sampled
by
randomly
selec'ng
SNPs
from
the
pooled
genomic
data
from
1K-‐140K
SNPs
in
increments
of
1K.
Accuracy
of
the
es'mator
suffers
below
1K
SNPs/Mb
but
reaches
a
stable
low
%D
aier
this
point.
Algorithm
The
founder
ancestry
at
any
given
posi'on
in
each
RIL
is
determined
with
a
high
degree
of
certainty
using
the
genome
sequences
of
the
founders
and
genotype
data
for
the
RILs
in
a
hidden
Markov
model2
(HMM).
In
this
study,
HMM
inferences
are
used
as
expected
haplotype
frequencies
in
the
different
pools.
Table
1.
Summary
sta's'cs
for
pools
1-‐4.
Lowest
mean
D
values
are
observed
in
pool
4,
likely
due
to
greater
average
coverage.
Ques'on
SeOng
precedents
for
op*mal
configura*ons
for
haplotype
es*ma*on
from
pooled
samples
to
minimize
cost
and
maximize
quan*ty
and
accuracy
of
results.
What
are
the
op*mal
algorithm
seOngs
for
es*ma*ng
haplotype
frequencies
from
pooled
sequence
data?
0 1000 2000 3000 4000 5000
4681012
SNP Density (SNPs per Mb)
Average%D
|
|
|
As
the
cost
of
genome
sequencing
decreases,
studies
that
were
previously
impossible
are
becoming
more
feasible.
For
popula'on
gene'cists,
however,
sequencing
every
individual
in
a
popula'on
is
oien
cost
prohibi've.
Pooled
sequencing
is
a
commonly
used,
cheaper
alterna've
to
individual-‐level
sequencing.
However,
accurately
es'ma'ng
the
haplotype
frequencies
of
a
popula'on
from
pooled
sequence
data
remains
a
challenge.
In
order
to
address
this
problem,
we
have
developed
and
refined
an
algorithm
to
es'mate
haplotype
frequencies
from
pooled
data.
To
experimentally
validate
our
method,
we
used
genomic
data
collected
from
pooled
sets
of
recombinant
inbred
lines
with
a
completely
known
haplotype
structure.
These
lines
were
derived
from
a
50
genera'on
controlled
cross
of
15
homozygous
founder
lines
of
Drosophila
melanogaster.
We
validated
the
predic've
accuracy
of
our
haplotype
es'mator
by
comparing
the
haplotype
frequency
es'mates
obtained
by
our
method
with
the
known
haplotype
composi'on
of
the
pool.
We
present
a
study
in
which
the
accuracy
of
the
haplotype
es'mator
is
tested
against
variability
in
raw
sequence
coverage,
SNP
density,
and
the
procedure
of
the
algorithm.
This
algorithm,
which
can
accurately
es'mate
the
haplotype
frequency
of
a
popula'on
from
pooled
sequence
data,
has
the
poten'al
to
significantly
progress
the
field
of
genotype-‐phenotype
mapping,
a
major
goal
of
modern
biology
and
bioinforma'cs.
Position (Mb)
%D
051015
0 10.0 0 12.4 25.3 37.4 0 10.5 24.3 40.6 52.0
X 2L 2R 3L 3R
Applica'on
These
plots
demonstrate
varying
haplotype
frequencies
between
young
and
old
popula'ons
of
Drosophila
melanogaster
in
a
longevity
study1.
For
this
region
on
chromosome
2R
there
is
a
significant
difference
between
haplotype
frequencies
in
the
two
popula'ons.
Different
colors
represent
the
8
different
haplotypes.
(RILs)
Algorithm
intakes
flavors
of
SNPs
at
each
posi'on
(eg.
0=A,
1=T)
and
refines
a
haplotype
frequency
guess
to
minimize
the
difference
between
the
observed
allele
counts
and
es'mated
allele
counts
weighted
by
haplotype
frequency.
●
●
●●
●
●
●●●●●●●●●●●●●●●●●●●●●●●●●●●●
● ●
●
●
●
●
0 1 2 3 4 5 6
3.23.64.04.4
Window Size (cM)
Average%D
Figure
4.
The
effect
of
window
size
on
accuracy
using
(a)
SNPs,
(b)
chromosomal
posi'on
(Kb),
and
(c)
gene'c
posi'on
(cM).
The
op'mal
window
size
is
marked
on
each
plot.
Gene'c
posi'on
has
the
lowest
%D,
and
is
therefore
the
op'mal
window
metric
when
window
size
is
between
0.8
and
3.5
cM
(%D:
3.05-‐3.13).
●
●
●
●
●
●
●●
●●●●●●●●●●●●● ●
●
● ●
●
●
●
●
0 5000 10000 15000
3.54.55.56.5
Window Size (SNP)
Average%D
(a)
(c)
Op'mum
=
3.38
%D
v
at
2500
bp
ß
200
SNP
window
●
●
●
●
●
●
●●●●●●●●●●●●●●●●●●●●●●●● ● ● ● ● ● ● ● ●
●
0 500 1000 1500 2000
3.54.55.56.5
Window Size (Kb)
Average%D
Op'mum
=
3.37
%D
v
at
500Kb
Op'mum
=
3.05
%D
v
2
cM
(ho)
(hY)
Pool 1
Position (Mb)
Frequency
0.000.100.200.30
0 10.0 0 12.4 25.3 37.4 0 10.5 24.3 40.6 52.0
X 2L 2R 3L 3R
Pool 4
Position (Mb)
Frequency
0.000.100.20
0 10.0 0 12.4 25.3 37.4 0 10.5 24.3 40.6 52.0
X 2L 2R 3L 3R
Pool 1
Position (Mb)
Frequency
0.00.10.20.30.4
0 10.0 0 12.4 25.3 37.4 0 10.5 24.3 40.6 52.0
X 2L 2R 3L 3R
Pool 4
Position (Mb)
Frequency
0.000.100.200.30
0 10.0 0 12.4 25.3 37.4 0 10.5 24.3 40.6 52.0
X 2L 2R 3L 3R