SlideShare a Scribd company logo
1 of 3
Download to read offline
Liberty Investments
Liberty Life Property Portfolio - Interim And Final Bonus Rate History

                                                                                                    Excelsior Property Portfolio

                                                                                                  Gross Interim Bonus Rates Per Annum
                                                 Natural Person Owned                                              Company Owned                                      Untaxed Institution
                                                                         Flexible       Retirement                                     Flexible                                               Flexible
                                      Investment       Investment                                      Investment     Investment                         Investment      Investment                      Living Annuity
                         Year                                          Investment      Annuity Plan                                  Investment                                             Investment
                                         Plan             Plan                                             Plan          Plan                               Plan            Plan                           (300_LLA)
                                                                           Plan        (300_SP_RA)                                       Plan                                                   Plan
                                       (300_CB)         (500_CB)                                        (300_CB)       (500_CB)                           (300_CB)        (500_CB)
                                                                        (600_CB)                                                      (600_CB)                                               (600_CB)
                         1985
                         1986
                         1987
                         1988
                         1989
Simulated Bonuses


                         1990
                         1991           18.22%           18.22%          18.22%           20.72%          18.22%           18.22%            18.22%       20.72%            20.72%           20.72%         20.72%
                         1992           13.22%           13.22%          13.22%           16.56%          13.22%           13.22%            13.22%       16.56%            16.56%           16.56%         16.56%
                         1993           14.06%           14.06%          14.06%           16.50%          14.06%           14.06%            14.06%       16.50%            16.50%           16.50%         16.50%
                         1994           13.22%           13.22%          13.22%           15.44%          13.22%           13.22%            13.22%       15.44%            15.44%           15.44%         15.44%
                         1995           11.83%           11.83%          11.83%           13.78%          11.83%           11.83%            11.83%       13.78%            13.78%           13.78%         13.78%
                         1996           13.78%           13.78%          13.78%           17.11%          13.78%           13.78%            13.78%       17.11%            17.11%           17.11%         17.11%
                         1997           13.22%           13.22%          13.22%           14.67%          13.22%           13.22%            13.22%       14.67%            14.67%           14.67%         14.67%
                         1998           13.89%           13.89%          13.89%           15.00%          13.89%           13.89%            13.89%       15.00%            15.00%           15.00%         15.00%
                         1999           11.56%           11.56%          11.56%           11.94%          11.56%           11.56%            11.56%       11.94%            11.94%           11.94%         11.94%
                         2000           13.59%           13.59%          13.59%           13.81%          13.59%           13.59%            13.59%       13.81%            13.81%           13.81%         13.81%
                         2001           12.48%           12.48%          12.48%           12.86%          12.48%           12.48%            12.48%       12.86%            12.86%           12.86%         12.86%
                         2002            8.95%            8.95%          8.95%             9.95%           8.95%           8.95%              8.95%       10.00%            10.00%           10.00%         10.00%
                         2003           11.00%           11.00%          11.00%           11.80%          10.60%           10.60%            10.60%       13.85%            13.85%           13.85%         13.85%
                         2004           10.00%           10.00%          10.00%           11.15%           9.65%           9.65%              9.65%       12.55%            12.55%           12.55%         12.55%
                         2005            9.55%            9.55%          9.55%            10.75%           9.25%           9.25%              9.25%       12.20%            12.20%           12.20%         12.20%
                         2006           10.00%           10.00%          10.00%           11.50%           9.70%           9.70%              9.70%       12.65%            12.65%           12.65%         12.65%
                         2007            9.45%            9.45%          9.45%            11.30%           9.20%           9.20%              9.20%       12.00%            12.00%           12.00%         12.00%
                         2008            8.80%            8.80%          8.80%            11.00%           8.60%           8.60%              8.60%       11.00%            11.00%           11.00%         11.00%
                         2009            7.95%            7.95%          7.95%            10.00%           7.85%           7.85%              7.85%       10.00%            10.00%           10.00%         10.00%
                         2010            7.45%            7.45%          7.45%             9.50%           7.40%           7.40%              7.40%        9.50%             9.50%           9.50%           9.50%
                         2011            6.30%            6.30%          6.30%             8.25%           6.25%           6.25%              6.25%        8.25%             8.25%           8.25%           8.25%
                         2012            6.05%            6.05%          6.05%             8.00%           6.05%           6.05%              6.05%        8.00%             8.00%           8.00%           8.00%

                                                                                                   Gross Final Bonus Rates Per Annum
                                                 Natural Person Owned                                              Company Owned                                      Untaxed Institution
                                                                         Flexible       Retirement                                            Flexible                                        Flexible
                                      Investment       Investment                                       Investment       Investment                      Investment      Investment                      Living Annuity
                         Year                                          Investment      Annuity Plan                                         Investment                                      Investment
                                         Plan             Plan                                             Plan             Plan                            Plan            Plan                           (300_LLA)
                                                                           Plan        (300_SP_RA)                                              Plan                                            Plan
                                       (300_CB)         (500_CB)                                         (300_CB)         (500_CB)                        (300_CB)        (500_CB)
                                                                        (600_CB)                                                             (600_CB)                                        (600_CB)
                         1985           15.06%           15.06%          15.06%           16.06%          15.06%           15.06%             15.06%      16.06%            16.06%            16.06%        16.06%
                         1986           14.22%           14.22%          14.22%           15.50%          14.22%           14.22%             14.22%      15.50%            15.50%            15.50%        15.50%
                         1987           16.22%           16.22%          16.22%           17.39%          16.22%           16.22%             16.22%      17.39%            17.39%            17.39%        17.39%
                         1988           16.17%           16.17%          16.17%           18.50%          16.17%           16.17%             16.17%      18.50%            18.50%            18.50%        18.50%
                         1989           17.61%           17.61%          17.61%           19.67%          17.61%           17.61%             17.61%      19.67%            19.67%            19.67%        19.67%
Simulated Bonuses


                         1990           18.22%           18.22%          18.22%           20.22%          18.22%           18.22%             18.22%      20.22%            20.22%            20.22%        20.22%
                         1991           18.22%           18.22%          18.22%           20.22%          18.22%           18.22%             18.22%      20.22%            20.22%            20.22%        20.22%
                         1992           14.61%           14.61%          14.61%           17.06%          14.61%           14.61%             14.61%      17.06%            17.06%            17.06%        17.06%
                         1993           13.78%           13.78%          13.78%           16.00%          13.78%           13.78%             13.78%      16.00%            16.00%            16.00%        16.00%
                         1994           12.39%           12.39%          12.39%           14.33%          12.39%           12.39%             12.39%      14.33%            14.33%            14.33%        14.33%
                         1995           14.33%           14.33%          14.33%           17.67%          14.33%           14.33%             14.33%      17.67%            17.67%            17.67%        17.67%
                         1996           13.78%           13.78%          13.78%           15.22%          13.78%           13.78%             13.78%      15.22%            15.22%            15.22%        15.22%
                         1997           17.22%           17.22%          17.22%           18.33%          17.22%           17.22%             17.22%      18.33%            18.33%            18.33%        18.33%
                         1998           12.22%           12.22%          12.22%           12.67%          12.22%           12.22%             12.22%      12.67%            12.67%            12.67%        12.67%
                         1999           17.11%           17.11%          17.11%           17.50%          17.11%           17.11%             17.11%      17.50%            17.50%            17.50%        17.50%
                         2000           15.25%           15.25%          15.25%           15.64%          15.25%           15.25%             15.25%      15.64%            15.64%            15.64%        15.64%
                         2001           12.48%           12.48%          12.48%           12.97%          12.48%           12.48%             12.48%      12.97%            12.97%            12.97%        12.97%
                         2002           11.70%           11.70%          11.70%           12.55%          11.25%           11.25%             11.25%      14.55%            14.55%            14.55%        14.55%
                         2003           11.80%           11.80%          11.80%           13.15%          11.35%           11.35%             11.35%      14.65%            14.65%            14.65%        14.65%
                         2004           10.95%           10.95%          10.95%           12.30%          10.55%           10.55%             10.55%      13.75%            13.75%            13.75%        13.75%
                         2005           13.60%           13.60%          13.60%           15.15%          13.05%           13.05%             13.05%      16.50%            16.50%            16.50%        16.50%
                         2006           16.45%           16.45%          16.45%           19.15%          15.75%           15.75%             15.75%      19.95%            19.95%            19.95%        19.95%
                         2007           17.11%           17.11%          17.11%           20.48%          16.34%           16.34%             16.34%      20.60%            20.60%            20.60%        20.60%
                         2008           12.18%           12.18%          12.18%           14.93%          11.87%           11.87%             11.87%      14.93%            14.93%            14.93%        14.93%
                         2009            9.07%            9.07%           9.07%           11.49%           8.98%           8.98%               8.98%      11.49%            11.49%            11.49%        11.49%
                         2010            9.75%            9.75%           9.75%           11.91%           9.56%           9.56%               9.56%      11.91%            11.91%            11.91%        11.91%
                         2011            8.42%            8.42%           8.42%           10.51%           8.30%           8.30%               8.30%      10.51%            10.51%            10.51%        10.51%

  l                 The above gross bonus rates are after an allowance for tax but before any ongoing management fees have been deducted.


     Liberty Investments                                                                                                                                                                                    Page 1 Of 3
     Liberty Property Portfolio Returns Ver 1 (16 Jan 2012)
Interim Bonus Rates Per Annum After Ongoing Management Fees
                                                  Natural Person Owned                                          Company Owned                             Untaxed Institution
                                                                          Flexible     Retirement                                   Flexible                                    Flexible
                                      Investment       Investment                                    Investment    Investment                  Investment    Investment                                     Living Annuity
                         Year                                           Investment    Annuity Plan                                Investment                                  Investment
                                         Plan             Plan                                          Plan           Plan                       Plan          Plan                                          (300_LLA)
                                                                            Plan     (300_SP_RA)                                      Plan                                        Plan
                                       (300_CB)         (500_CB)                                      (300_CB)       (500_CB)                   (300_CB)      (500_CB)
                                                                         (600_CB)                                                  (600_CB)                                    (600_CB)
                     Ongoing mngt.
                                         1.92%            0.75%           1.20%            1.92%            1.92%            0.75%           1.20%            1.92%            0.75%             1.20%          1.00%
                    fees per annum
                         1985
                         1986
                         1987
                         1988
                         1989
Simulated Bonuses


                         1990
                         1991            15.97%          17.34%           16.81%           18.42%           15.97%          17.34%           16.81%           18.42%           19.82%           19.28%         19.52%
                         1992            11.07%          12.38%           11.87%           14.34%           11.07%          12.38%           11.87%           14.34%           15.68%           15.16%         15.40%
                         1993            11.88%          13.20%           12.69%           14.28%           11.88%          13.20%           12.69%           14.28%           15.63%           15.11%         15.34%
                         1994            11.07%          12.38%           11.87%           13.25%           11.07%          12.38%           11.87%           13.25%           14.58%           14.07%         14.30%
                         1995             9.70%          11.00%           10.50%           11.61%            9.70%          11.00%           10.50%           11.61%           12.93%           12.42%         12.65%
                         1996            11.61%          12.93%           12.42%           14.88%           11.61%          12.93%           12.42%           14.88%           16.24%           15.71%         15.95%
                         1997            11.07%          12.38%           11.87%           12.48%           11.07%          12.38%           11.87%           12.48%           13.81%           13.30%         13.53%
                         1998            11.72%          13.04%           12.53%           12.81%           11.72%          13.04%           12.53%           12.81%           14.14%           13.63%         13.86%
                         1999             9.43%          10.72%           10.22%            9.81%            9.43%          10.72%           10.22%            9.81%           11.11%           10.61%         10.83%
                         2000            11.42%          12.74%           12.23%           11.64%           11.42%          12.74%           12.23%           11.64%           12.95%           12.45%         12.67%
                         2001            10.33%          11.63%           11.13%           10.71%           10.33%          11.63%           11.13%           10.71%           12.02%           11.51%         11.74%
                         2002             6.88%           8.14%           7.65%             7.86%            6.88%          8.14%             7.65%            7.91%            9.18%           8.69%           8.91%
                         2003             8.89%          10.17%           9.68%             9.67%            8.50%          9.77%             9.28%           11.68%           13.00%           12.49%         12.72%
                         2004             7.91%           9.18%           8.69%             9.03%            7.56%          8.83%             8.34%           10.41%           11.71%           11.21%         11.43%
                         2005             7.47%           8.73%           8.24%             8.64%            7.17%          8.43%             7.95%           10.06%           11.36%           10.86%         11.08%
                         2006             7.91%           9.18%           8.69%             9.38%            7.61%          8.88%             8.39%           10.51%           11.81%           11.31%         11.53%
                         2007             7.37%           8.63%           8.14%             9.18%            7.12%          8.38%             7.90%            9.87%           11.16%           10.66%         10.89%
                         2008             6.73%           7.99%           7.50%             8.89%            6.53%          7.79%             7.30%            8.89%           10.17%           9.68%           9.90%
                         2009             5.90%           7.14%           6.66%             7.91%            5.80%          7.04%             6.56%            7.91%            9.18%           8.69%           8.91%
                         2010             5.41%           6.65%           6.17%             7.42%            5.36%          6.60%             6.12%            7.42%            8.68%           8.19%           8.41%
                         2011             4.28%           5.51%           5.03%             6.19%            4.23%          5.46%             4.98%            6.19%            7.44%           6.96%           7.17%
                         2012             4.03%           5.26%           4.78%             5.94%            4.03%          5.26%             4.78%            5.94%            7.19%           6.71%           6.92%

                                                                                       Final Bonus Rates Per Annum After Ongoing Management Fees
                                                  Natural Person Owned                                             Company Owned                                         Untaxed Institution
                                                                          Flexible       Retirement                                    Flexible                                                  Flexible
                                      Investment       Investment                                       Investment     Investment                           Investment      Investment                      Living Annuity
                         Year                                           Investment      Annuity Plan                                 Investment                                                Investment
                                         Plan             Plan                                             Plan           Plan                                 Plan            Plan                           (300_LLA)
                                                                            Plan        (300_SP_RA)                                      Plan                                                      Plan
                                       (300_CB)         (500_CB)                                         (300_CB)       (500_CB)                             (300_CB)        (500_CB)
                                                                         (600_CB)                                                     (600_CB)                                                  (600_CB)
                     Ongoing mngt.
                                         1.92%            0.75%           1.20%            1.92%            1.92%            0.75%           1.20%            1.92%            0.75%             1.20%          1.00%
                    fees per annum
                         1985            12.87%          14.20%           13.68%           13.85%           12.87%          14.20%           13.68%           13.85%           15.19%           14.67%         14.90%
                         1986            12.05%          13.37%           12.86%           13.30%           12.05%          13.37%           12.86%           13.30%           14.64%           14.12%         14.35%
                         1987            14.01%          15.35%           14.84%           15.15%           14.01%          15.35%           14.84%           15.15%           16.51%           15.99%         16.22%
                         1988            13.96%          15.30%           14.78%           16.24%           13.96%          15.30%           14.78%           16.24%           17.61%           17.09%         17.32%
                         1989            15.37%          16.73%           16.21%           17.39%           15.37%          16.73%           16.21%           17.39%           18.77%           18.24%         18.48%
Simulated Bonuses


                         1990            15.97%          17.34%           16.81%           17.93%           15.97%          17.34%           16.81%           17.93%           19.32%           18.79%         19.03%
                         1991            15.97%          17.34%           16.81%           17.93%           15.97%          17.34%           16.81%           17.93%           19.32%           18.79%         19.03%
                         1992            12.43%          13.75%           13.24%           14.83%           12.43%          13.75%           13.24%           14.83%           16.18%           15.66%         15.89%
                         1993            11.61%          12.93%           12.42%           13.79%           11.61%          12.93%           12.42%           13.79%           15.13%           14.62%         14.85%
                         1994            10.25%          11.55%           11.05%           12.16%           10.25%          11.55%           11.05%           12.16%           13.48%           12.97%         13.20%
                         1995            12.16%          13.48%           12.97%           15.43%           12.16%          13.48%           12.97%           15.43%           16.79%           16.26%         16.50%
                         1996            11.61%          12.93%           12.42%           13.03%           11.61%          12.93%           12.42%           13.03%           14.36%           13.85%         14.08%
                         1997            14.99%          16.35%           15.82%           16.08%           14.99%          16.35%           15.82%           16.08%           17.45%           16.92%         17.16%
                         1998            10.09%          11.38%           10.88%           10.52%           10.09%          11.38%           10.88%           10.52%           11.82%           11.32%         11.55%
                         1999            14.88%          16.24%           15.71%           15.26%           14.88%          16.24%           15.71%           15.26%           16.62%           16.10%         16.33%
                         2000            13.06%          14.39%           13.88%           13.44%           13.06%          14.39%           13.88%           13.44%           14.77%           14.26%         14.49%
                         2001            10.33%          11.63%           11.13%           10.82%           10.33%          11.63%           11.13%           10.82%           12.13%           11.62%         11.85%
                         2002             9.57%          10.87%           10.37%           10.41%            9.13%          10.42%            9.92%           12.37%           13.69%           13.18%         13.41%
                         2003             9.67%          10.96%           10.47%           11.00%            9.23%          10.52%           10.02%           12.47%           13.79%           13.28%         13.51%
                         2004             8.84%          10.12%           9.63%            10.16%            8.45%          9.72%             9.23%           11.59%           12.90%           12.39%         12.62%
                         2005            11.44%          12.75%           12.24%           12.96%           10.90%          12.21%           11.70%           14.28%           15.63%           15.11%         15.34%
                         2006            14.23%          15.58%           15.06%           16.88%           13.55%          14.88%           14.37%           17.67%           19.05%           18.52%         18.76%
                         2007            14.88%          16.23%           15.71%           18.19%           14.13%          15.47%           14.95%           18.30%           19.70%           19.16%         19.40%
                         2008            10.04%          11.34%           10.84%           12.74%            9.74%          11.03%           10.53%           12.74%           14.07%           13.56%         13.79%
                         2009             6.99%           8.25%           7.77%             9.37%            6.91%          8.17%             7.68%            9.37%           10.66%           10.16%         10.38%
                         2010             7.66%           8.93%           8.44%             9.78%            7.47%          8.74%             8.25%            9.78%           11.07%           10.57%         10.80%
                         2011             6.36%           7.61%           7.13%             8.41%            6.24%          7.49%             7.01%            8.41%            9.68%           9.19%           9.41%

  l                 The above net bonus rates are after an allowance for tax and after any ongoing management fees have been deducted. The Flexible Investment Plan assumes one policy in a bundle.


     Liberty Investments                                                                                                                                                                                       Page 2 Of 3
     Liberty Property Portfolio Returns Ver 1 (16 Jan 2012)
Lifestyle Property Portfolio

                                                                                   Interim Bonus Rate                    Final Bonus Rate
                                                                              Endowment                           Endowment
                                                       Year                                   Retirement                           Retirement
                                                                              (Individually                       (Individually
                                                                                                Annuity                              Annuity
                                                                                 owned)                              owned)
                                                      1991                       15.50%         17.75%               15.50%          17.30%
                                                1992 (as at 1 Jan)               15.00%         17.25%                0.00%           0.00%
                                                1992 (as at 1 Aug)               11.00%         14.00%               12.25%          14.45%
                                                      1993                       11.75%         13.95%               11.50%          13.50%
                                                      1994                       11.00%         13.00%               10.25%          12.00%
                                                      1995                        9.75%         11.50%               12.00%          15.00%
                                                      1996                       11.50%         14.50%               11.50%          12.80%
                                                      1997                       11.00%         12.30%               14.60%          15.60%
                                                      1998                       11.60%         12.60%               10.10%          10.50%
                                                      1999                        9.50%          9.85%               14.50%          14.85%
                                                      2000                       10.50%         10.85%               12.00%          12.50%
                                                      2001                        9.50%         10.00%                9.50%          10.10%
                                                      2002                        9.00%         10.00%                9.40%          10.35%
                                                      2003                        8.75%          9.65%                9.00%          10.35%
                                                      2004                        7.40%          8.60%                8.25%           9.60%
                                                      2005                        7.00%          8.25%               10.60%          12.10%
                                                      2006                        7.40%          8.60%               13.15%          15.40%
                                                      2007                        6.95%          8.50%               13.66%          16.59%
                                                      2008                        6.45%          8.40%                9.48%          11.90%
                                                      2009                        5.75%          7.55%                6.72%           8.86%
                                                      2010                        5.30%          7.10%                7.32%           9.22%
                                                      2011                        4.70%          6.10%                6.15%           8.01%
                                                      2011                        4.50%          5.85%

l   The above bonus rates are after an allowance for tax and any ongoing management fees and shareholder fees invested in the Lifestyle Property portfolio.

                                                                       Conventional Life Annuities linked to the Property Portfolio

                                                                                  Year          Final Bonus            Year          Final Bonus
                                                                                  1992            16.06%               2001            12.63%
                                                                                  1993            15.00%               2002            13.13%
                                                                                  1994            13.33%               2003            12.74%
                                                                                  1995            16.67%               2004            11.86%
                                                                                  1996            14.22%               2005            14.59%
                                                                                  1997            17.32%               2006            17.84%
                                                                                  1998            13.15%               2007            18.54%
                                                                                  1999            17.93%               2008            13.33%
                                                                                  2000            15.46%

l   The above bonus rates are for conventional life annuities linked to the Property portfolio. The increase in the annual annuity income an annuitant will receive is dependant on the difference between the
    Property return and the base interest rate the original annuity was calculated on (previously 12% p.a., 8% p.a. and 6% p.a. have been used.)

l   The annuity income increases will occur every April.

                                                                                                 Sandton Properties*

                                                                                                                                     Sandton
                                                                Year            Tranche I        Tranche II        Tranche III
                                                                                                                                   Property (G)**
                                                               1999              14.50%
                                                               2000              12.72%            12.39%            12.04%
                                                               2001              11.39%            11.06%            11.04%
                                                               2002              8.50%              8.50%             8.50%
                                                               2003               9.63%             9.42%             9.63%
                                                               2004               7.59%             7.59%             7.59%             7.06%
                                                               2005              10.57%            10.23%            10.42%            10.32%
                                                               2006                                                                    11.70%
                                                               2007                                                                    15.17%
                                                               2008                                                                    12.89%
                                                               2009                                                                     8.36%
                                                               2010                                                                     6.21%
                                                               2011                                                                    6.51%
                                                           2012 (Interim)                                                              4.70%

* The bonuses rates for Sandton Properties are applicable for endowments.
** The bonus rates are applicable to those that have extended their original Sandton Property policy post the initial 5 year period.
 l The above bonus rates are after an allowance for tax and any ongoing management fees.


                                                                                                      Please Note
l   The interim rates are not guaranteed
l   The simulated bonuses above for the Excelsior Property portfolio are based on the Lifestyle Property portfolio bonuses. The Lifestyle portfolio ongoing management fees were added back so as to create
    approximate bonuses gross of ongoing fees. The returns for a company were based on the returns for a natural person and the returns for an untaxed institution were based on the RA returns. These are for
    illustrative purposes only.
l   The final rates net of management fees are an understatement of the true value due to estimation. The ongoing fees are levied on the interim bonus rate which is lower than the final bonus rate. The final
    bonus rate is only declared at the end of the year.
l   Prior to 2002, the RA returns were used as a proxy for the untaxed returns that could have been experienced under the Excelsior Property portfolio.
l   The returns are after an allowance for tax where indicated.
l   The returns are applicable to the amount of the lump sum invested and assume a single premium investment.
l   Whilst every attempt has been made to ensure the accuracy of the information contained herein, Liberty Life cannot be held responsible for any errors that may occur or for any damages suffered as a result of
    such errors.
l   This calculation is provided as an aid to assist you as financial adviser. It does not constitute advice by Liberty Life and you are urged to ensure that you verify the content and are comfortable with utilizing it as
    your personal advice. The results are an estimate based on the information provided and should not be relied on in isolation.

l   Any legal technical or product information contained in this document is subject to change from time to time and is not to be construed as advice by Liberty Life. Any recommendations made must take into
    consideration your specific needs and personal circumstances. If there are any discrepancies between this document and the contractual terms or, where applicable, any fund rules, the latter will prevail. Past
    performance cannot be relied on as an indication of future performance. Investment performance will depend on the growth in the underlying assets, which will be influenced by inflation levels in the economy
    and prevailing market conditions.


E. And O.E.


 Liberty Investments                                                                                                                                                                                            Page 3 Of 3
 Liberty Property Portfolio Returns Ver 1 (16 Jan 2012)

More Related Content

Viewers also liked

2015 Key Features of PPS Insurance
2015 Key Features of PPS Insurance2015 Key Features of PPS Insurance
2015 Key Features of PPS InsuranceTarryn-Lee Govender
 
cashkows.com - PPS
cashkows.com - PPScashkows.com - PPS
cashkows.com - PPScashkows
 
PT. Nankai Indonesia (Unit Lumajang)
PT. Nankai Indonesia (Unit Lumajang)PT. Nankai Indonesia (Unit Lumajang)
PT. Nankai Indonesia (Unit Lumajang)PT. Nankai Indonesia
 
“Philanthorpy – A part of financial planning” – Inyathelo
“Philanthorpy – A part of financial planning” – Inyathelo“Philanthorpy – A part of financial planning” – Inyathelo
“Philanthorpy – A part of financial planning” – InyatheloSenate Group Financial Advisors
 

Viewers also liked (20)

Mgi african economies_full_report
Mgi african economies_full_reportMgi african economies_full_report
Mgi african economies_full_report
 
Analytics jan 2012 final
Analytics jan 2012 finalAnalytics jan 2012 final
Analytics jan 2012 final
 
Dr paul palmer sustainable self - program overview
Dr paul palmer   sustainable self - program overviewDr paul palmer   sustainable self - program overview
Dr paul palmer sustainable self - program overview
 
2015 Key Features of PPS Insurance
2015 Key Features of PPS Insurance2015 Key Features of PPS Insurance
2015 Key Features of PPS Insurance
 
PPS presentation
PPS presentationPPS presentation
PPS presentation
 
cashkows.com - PPS
cashkows.com - PPScashkows.com - PPS
cashkows.com - PPS
 
Sasfin Securities; Balancing the risks; Nov 2013
Sasfin Securities; Balancing the risks; Nov 2013Sasfin Securities; Balancing the risks; Nov 2013
Sasfin Securities; Balancing the risks; Nov 2013
 
Analytics jan 2012 final
Analytics jan 2012 finalAnalytics jan 2012 final
Analytics jan 2012 final
 
PT. Nankai Indonesia (Unit Lumajang)
PT. Nankai Indonesia (Unit Lumajang)PT. Nankai Indonesia (Unit Lumajang)
PT. Nankai Indonesia (Unit Lumajang)
 
Liberty client satisfaction tool exercise 2
Liberty client satisfaction tool   exercise 2Liberty client satisfaction tool   exercise 2
Liberty client satisfaction tool exercise 2
 
Anglorand Capital
Anglorand CapitalAnglorand Capital
Anglorand Capital
 
Client proposition toolkit liberty
Client proposition toolkit libertyClient proposition toolkit liberty
Client proposition toolkit liberty
 
Tactical asset allocation view ipi q4 2011
Tactical asset allocation view ipi q4 2011Tactical asset allocation view ipi q4 2011
Tactical asset allocation view ipi q4 2011
 
“Philanthorpy – A part of financial planning” – Inyathelo
“Philanthorpy – A part of financial planning” – Inyathelo“Philanthorpy – A part of financial planning” – Inyathelo
“Philanthorpy – A part of financial planning” – Inyathelo
 
Forward thinking quarter 4 2011
Forward thinking quarter 4 2011Forward thinking quarter 4 2011
Forward thinking quarter 4 2011
 
Grindod presentation
Grindod presentationGrindod presentation
Grindod presentation
 
Truffle Asset Management
Truffle Asset ManagementTruffle Asset Management
Truffle Asset Management
 
PSG Fund Management
PSG Fund ManagementPSG Fund Management
PSG Fund Management
 
Liberty excelsior propertyp8 (3)
Liberty excelsior propertyp8 (3)Liberty excelsior propertyp8 (3)
Liberty excelsior propertyp8 (3)
 
BCI Senate Group presentation
BCI Senate Group presentationBCI Senate Group presentation
BCI Senate Group presentation
 

Similar to Lifestyle and excelsior property bonuses jan 2012

Similar to Lifestyle and excelsior property bonuses jan 2012 (20)

Gentex investor presentation
Gentex investor presentationGentex investor presentation
Gentex investor presentation
 
03c Bri 3 Year Monthly Forcasts Y2
03c Bri   3 Year Monthly Forcasts Y203c Bri   3 Year Monthly Forcasts Y2
03c Bri 3 Year Monthly Forcasts Y2
 
Anu Pinkerton
Anu PinkertonAnu Pinkerton
Anu Pinkerton
 
northrop grumman Annual Report 2004
northrop grumman Annual Report 2004northrop grumman Annual Report 2004
northrop grumman Annual Report 2004
 
SNC : Opp day Feb 18, 2013
SNC : Opp day Feb 18, 2013  SNC : Opp day Feb 18, 2013
SNC : Opp day Feb 18, 2013
 
Embraer IR Presentation Apr.12
Embraer IR Presentation Apr.12Embraer IR Presentation Apr.12
Embraer IR Presentation Apr.12
 
03d Bri 3 Year Monthly Forcasts Y3
03d Bri   3 Year Monthly Forcasts Y303d Bri   3 Year Monthly Forcasts Y3
03d Bri 3 Year Monthly Forcasts Y3
 
Mgh Oc Venture Group 2007 09 12
Mgh Oc Venture Group 2007 09 12Mgh Oc Venture Group 2007 09 12
Mgh Oc Venture Group 2007 09 12
 
3Q12 Presentation
3Q12 Presentation3Q12 Presentation
3Q12 Presentation
 
Embraer 1 q11_results_final
Embraer 1 q11_results_finalEmbraer 1 q11_results_final
Embraer 1 q11_results_final
 
Embraer 1Q11 Results
Embraer 1Q11 ResultsEmbraer 1Q11 Results
Embraer 1Q11 Results
 
Natural Areas Strategic Planrev1
Natural Areas Strategic Planrev1Natural Areas Strategic Planrev1
Natural Areas Strategic Planrev1
 
Natural Areas Strategic Planrev1
Natural Areas Strategic Planrev1Natural Areas Strategic Planrev1
Natural Areas Strategic Planrev1
 
Fluxo de Caixa caminhao 1634
Fluxo de Caixa caminhao 1634Fluxo de Caixa caminhao 1634
Fluxo de Caixa caminhao 1634
 
Embraer 2 q10 results_final
Embraer 2 q10 results_finalEmbraer 2 q10 results_final
Embraer 2 q10 results_final
 
Fluxo de Caixa Nl10
Fluxo de Caixa Nl10Fluxo de Caixa Nl10
Fluxo de Caixa Nl10
 
Mmx webcast ingles 1 t12
Mmx webcast ingles 1 t12Mmx webcast ingles 1 t12
Mmx webcast ingles 1 t12
 
קבר הצדיק
קבר הצדיקקבר הצדיק
קבר הצדיק
 
alcoa 2008 meeting presentation
alcoa 2008 meeting presentationalcoa 2008 meeting presentation
alcoa 2008 meeting presentation
 
Embraer 2Q11 Results Final
Embraer 2Q11 Results FinalEmbraer 2Q11 Results Final
Embraer 2Q11 Results Final
 

More from Senate Group Financial Advisors

Absa bank, Senate group conference - presentation by ABSA stockbrokers and po...
Absa bank, Senate group conference - presentation by ABSA stockbrokers and po...Absa bank, Senate group conference - presentation by ABSA stockbrokers and po...
Absa bank, Senate group conference - presentation by ABSA stockbrokers and po...Senate Group Financial Advisors
 
Absa bank, Senate group conference - presentation by Johann Gunter
Absa bank, Senate group conference - presentation by Johann GunterAbsa bank, Senate group conference - presentation by Johann Gunter
Absa bank, Senate group conference - presentation by Johann GunterSenate Group Financial Advisors
 

More from Senate Group Financial Advisors (20)

Old Mutual, Senate Group
Old Mutual, Senate Group   Old Mutual, Senate Group
Old Mutual, Senate Group
 
Old mutual, Senate group
Old mutual, Senate group  Old mutual, Senate group
Old mutual, Senate group
 
Momentum, Senate group
Momentum, Senate groupMomentum, Senate group
Momentum, Senate group
 
Investec, Senate group
Investec, Senate groupInvestec, Senate group
Investec, Senate group
 
Investec, Senate Group
Investec, Senate GroupInvestec, Senate Group
Investec, Senate Group
 
Element, Senate group - sk,ab final
Element, Senate group - sk,ab finalElement, Senate group - sk,ab final
Element, Senate group - sk,ab final
 
Absa bank, Senate group conference - presentation by ABSA stockbrokers and po...
Absa bank, Senate group conference - presentation by ABSA stockbrokers and po...Absa bank, Senate group conference - presentation by ABSA stockbrokers and po...
Absa bank, Senate group conference - presentation by ABSA stockbrokers and po...
 
Absa bank, Senate group conference - presentation by Johann Gunter
Absa bank, Senate group conference - presentation by Johann GunterAbsa bank, Senate group conference - presentation by Johann Gunter
Absa bank, Senate group conference - presentation by Johann Gunter
 
Ultima
UltimaUltima
Ultima
 
Prudential
PrudentialPrudential
Prudential
 
Prescient
PrescientPrescient
Prescient
 
Old Mutual optimising the value of advice
Old Mutual optimising the value of adviceOld Mutual optimising the value of advice
Old Mutual optimising the value of advice
 
Clientele - estate preservation plan Senate Group
Clientele - estate preservation plan Senate GroupClientele - estate preservation plan Senate Group
Clientele - estate preservation plan Senate Group
 
Absa Linked Investments
Absa Linked InvestmentsAbsa Linked Investments
Absa Linked Investments
 
Old Mutual: Greenlight presentation
Old Mutual: Greenlight presentationOld Mutual: Greenlight presentation
Old Mutual: Greenlight presentation
 
Old Mutual Rewards: Registration process updated
Old Mutual Rewards: Registration process updatedOld Mutual Rewards: Registration process updated
Old Mutual Rewards: Registration process updated
 
Old Mutual: Greenlight unmatched heart stroke
Old Mutual: Greenlight unmatched heart strokeOld Mutual: Greenlight unmatched heart stroke
Old Mutual: Greenlight unmatched heart stroke
 
Old Mutual: Greenlight
Old Mutual: GreenlightOld Mutual: Greenlight
Old Mutual: Greenlight
 
Old Mutual: Earnings multiples
Old Mutual: Earnings multiplesOld Mutual: Earnings multiples
Old Mutual: Earnings multiples
 
Why Incompass.
Why Incompass.Why Incompass.
Why Incompass.
 

Recently uploaded

Uae-NO1 Pakistani Amil Baba Real Amil baba In Pakistan Najoomi Baba in Pakist...
Uae-NO1 Pakistani Amil Baba Real Amil baba In Pakistan Najoomi Baba in Pakist...Uae-NO1 Pakistani Amil Baba Real Amil baba In Pakistan Najoomi Baba in Pakist...
Uae-NO1 Pakistani Amil Baba Real Amil baba In Pakistan Najoomi Baba in Pakist...Amil baba
 
cost of capital questions financial management
cost of capital questions financial managementcost of capital questions financial management
cost of capital questions financial managementtanmayarora23
 
『澳洲文凭』买科廷大学毕业证书成绩单办理澳洲Curtin文凭学位证书
『澳洲文凭』买科廷大学毕业证书成绩单办理澳洲Curtin文凭学位证书『澳洲文凭』买科廷大学毕业证书成绩单办理澳洲Curtin文凭学位证书
『澳洲文凭』买科廷大学毕业证书成绩单办理澳洲Curtin文凭学位证书rnrncn29
 
Uae-NO1 Rohani Amil In Islamabad Amil Baba in Rawalpindi Kala Jadu Amil In Ra...
Uae-NO1 Rohani Amil In Islamabad Amil Baba in Rawalpindi Kala Jadu Amil In Ra...Uae-NO1 Rohani Amil In Islamabad Amil Baba in Rawalpindi Kala Jadu Amil In Ra...
Uae-NO1 Rohani Amil In Islamabad Amil Baba in Rawalpindi Kala Jadu Amil In Ra...Amil baba
 
Money Forward Integrated Report “Forward Map” 2024
Money Forward Integrated Report “Forward Map” 2024Money Forward Integrated Report “Forward Map” 2024
Money Forward Integrated Report “Forward Map” 2024Money Forward
 
Unveiling Business Expansion Trends in 2024
Unveiling Business Expansion Trends in 2024Unveiling Business Expansion Trends in 2024
Unveiling Business Expansion Trends in 2024Champak Jhagmag
 
Guard Your Investments- Corporate Defaults Alarm.pdf
Guard Your Investments- Corporate Defaults Alarm.pdfGuard Your Investments- Corporate Defaults Alarm.pdf
Guard Your Investments- Corporate Defaults Alarm.pdfJasper Colin
 
10 QuickBooks Tips 2024 - Globus Finanza.pdf
10 QuickBooks Tips 2024 - Globus Finanza.pdf10 QuickBooks Tips 2024 - Globus Finanza.pdf
10 QuickBooks Tips 2024 - Globus Finanza.pdfglobusfinanza
 
Uae-NO1 Kala Jadu specialist Expert in Pakistan kala ilam specialist Expert i...
Uae-NO1 Kala Jadu specialist Expert in Pakistan kala ilam specialist Expert i...Uae-NO1 Kala Jadu specialist Expert in Pakistan kala ilam specialist Expert i...
Uae-NO1 Kala Jadu specialist Expert in Pakistan kala ilam specialist Expert i...Amil baba
 
Role of Information and technology in banking and finance .pptx
Role of Information and technology in banking and finance .pptxRole of Information and technology in banking and finance .pptx
Role of Information and technology in banking and finance .pptxNarayaniTripathi2
 
《加拿大本地办假证-寻找办理Dalhousie毕业证和达尔豪斯大学毕业证书的中介代理》
《加拿大本地办假证-寻找办理Dalhousie毕业证和达尔豪斯大学毕业证书的中介代理》《加拿大本地办假证-寻找办理Dalhousie毕业证和达尔豪斯大学毕业证书的中介代理》
《加拿大本地办假证-寻找办理Dalhousie毕业证和达尔豪斯大学毕业证书的中介代理》rnrncn29
 
Global Economic Outlook, 2024 - Scholaride Consulting
Global Economic Outlook, 2024 - Scholaride ConsultingGlobal Economic Outlook, 2024 - Scholaride Consulting
Global Economic Outlook, 2024 - Scholaride Consultingswastiknandyofficial
 
AnyConv.com__FSS Advance Retail & Distribution - 15.06.17.ppt
AnyConv.com__FSS Advance Retail & Distribution - 15.06.17.pptAnyConv.com__FSS Advance Retail & Distribution - 15.06.17.ppt
AnyConv.com__FSS Advance Retail & Distribution - 15.06.17.pptPriyankaSharma89719
 
Uae-NO1 Black Magic Specialist In Lahore Black magic In Pakistan Kala Ilam Ex...
Uae-NO1 Black Magic Specialist In Lahore Black magic In Pakistan Kala Ilam Ex...Uae-NO1 Black Magic Specialist In Lahore Black magic In Pakistan Kala Ilam Ex...
Uae-NO1 Black Magic Specialist In Lahore Black magic In Pakistan Kala Ilam Ex...Amil baba
 
Banking: Commercial and Central Banking.pptx
Banking: Commercial and Central Banking.pptxBanking: Commercial and Central Banking.pptx
Banking: Commercial and Central Banking.pptxANTHONYAKINYOSOYE1
 
NO1 Certified kala jadu karne wale ka contact number kala jadu karne wale bab...
NO1 Certified kala jadu karne wale ka contact number kala jadu karne wale bab...NO1 Certified kala jadu karne wale ka contact number kala jadu karne wale bab...
NO1 Certified kala jadu karne wale ka contact number kala jadu karne wale bab...Amil baba
 
Introduction to Health Economics Dr. R. Kurinji Malar.pptx
Introduction to Health Economics Dr. R. Kurinji Malar.pptxIntroduction to Health Economics Dr. R. Kurinji Malar.pptx
Introduction to Health Economics Dr. R. Kurinji Malar.pptxDrRkurinjiMalarkurin
 
Economic Risk Factor Update: April 2024 [SlideShare]
Economic Risk Factor Update: April 2024 [SlideShare]Economic Risk Factor Update: April 2024 [SlideShare]
Economic Risk Factor Update: April 2024 [SlideShare]Commonwealth
 
NO1 Certified Black Magic Specialist Expert In Bahawalpur, Sargodha, Sialkot,...
NO1 Certified Black Magic Specialist Expert In Bahawalpur, Sargodha, Sialkot,...NO1 Certified Black Magic Specialist Expert In Bahawalpur, Sargodha, Sialkot,...
NO1 Certified Black Magic Specialist Expert In Bahawalpur, Sargodha, Sialkot,...Amil baba
 

Recently uploaded (20)

Uae-NO1 Pakistani Amil Baba Real Amil baba In Pakistan Najoomi Baba in Pakist...
Uae-NO1 Pakistani Amil Baba Real Amil baba In Pakistan Najoomi Baba in Pakist...Uae-NO1 Pakistani Amil Baba Real Amil baba In Pakistan Najoomi Baba in Pakist...
Uae-NO1 Pakistani Amil Baba Real Amil baba In Pakistan Najoomi Baba in Pakist...
 
cost of capital questions financial management
cost of capital questions financial managementcost of capital questions financial management
cost of capital questions financial management
 
『澳洲文凭』买科廷大学毕业证书成绩单办理澳洲Curtin文凭学位证书
『澳洲文凭』买科廷大学毕业证书成绩单办理澳洲Curtin文凭学位证书『澳洲文凭』买科廷大学毕业证书成绩单办理澳洲Curtin文凭学位证书
『澳洲文凭』买科廷大学毕业证书成绩单办理澳洲Curtin文凭学位证书
 
Q1 2024 Newsletter | Financial Synergies Wealth Advisors
Q1 2024 Newsletter | Financial Synergies Wealth AdvisorsQ1 2024 Newsletter | Financial Synergies Wealth Advisors
Q1 2024 Newsletter | Financial Synergies Wealth Advisors
 
Uae-NO1 Rohani Amil In Islamabad Amil Baba in Rawalpindi Kala Jadu Amil In Ra...
Uae-NO1 Rohani Amil In Islamabad Amil Baba in Rawalpindi Kala Jadu Amil In Ra...Uae-NO1 Rohani Amil In Islamabad Amil Baba in Rawalpindi Kala Jadu Amil In Ra...
Uae-NO1 Rohani Amil In Islamabad Amil Baba in Rawalpindi Kala Jadu Amil In Ra...
 
Money Forward Integrated Report “Forward Map” 2024
Money Forward Integrated Report “Forward Map” 2024Money Forward Integrated Report “Forward Map” 2024
Money Forward Integrated Report “Forward Map” 2024
 
Unveiling Business Expansion Trends in 2024
Unveiling Business Expansion Trends in 2024Unveiling Business Expansion Trends in 2024
Unveiling Business Expansion Trends in 2024
 
Guard Your Investments- Corporate Defaults Alarm.pdf
Guard Your Investments- Corporate Defaults Alarm.pdfGuard Your Investments- Corporate Defaults Alarm.pdf
Guard Your Investments- Corporate Defaults Alarm.pdf
 
10 QuickBooks Tips 2024 - Globus Finanza.pdf
10 QuickBooks Tips 2024 - Globus Finanza.pdf10 QuickBooks Tips 2024 - Globus Finanza.pdf
10 QuickBooks Tips 2024 - Globus Finanza.pdf
 
Uae-NO1 Kala Jadu specialist Expert in Pakistan kala ilam specialist Expert i...
Uae-NO1 Kala Jadu specialist Expert in Pakistan kala ilam specialist Expert i...Uae-NO1 Kala Jadu specialist Expert in Pakistan kala ilam specialist Expert i...
Uae-NO1 Kala Jadu specialist Expert in Pakistan kala ilam specialist Expert i...
 
Role of Information and technology in banking and finance .pptx
Role of Information and technology in banking and finance .pptxRole of Information and technology in banking and finance .pptx
Role of Information and technology in banking and finance .pptx
 
《加拿大本地办假证-寻找办理Dalhousie毕业证和达尔豪斯大学毕业证书的中介代理》
《加拿大本地办假证-寻找办理Dalhousie毕业证和达尔豪斯大学毕业证书的中介代理》《加拿大本地办假证-寻找办理Dalhousie毕业证和达尔豪斯大学毕业证书的中介代理》
《加拿大本地办假证-寻找办理Dalhousie毕业证和达尔豪斯大学毕业证书的中介代理》
 
Global Economic Outlook, 2024 - Scholaride Consulting
Global Economic Outlook, 2024 - Scholaride ConsultingGlobal Economic Outlook, 2024 - Scholaride Consulting
Global Economic Outlook, 2024 - Scholaride Consulting
 
AnyConv.com__FSS Advance Retail & Distribution - 15.06.17.ppt
AnyConv.com__FSS Advance Retail & Distribution - 15.06.17.pptAnyConv.com__FSS Advance Retail & Distribution - 15.06.17.ppt
AnyConv.com__FSS Advance Retail & Distribution - 15.06.17.ppt
 
Uae-NO1 Black Magic Specialist In Lahore Black magic In Pakistan Kala Ilam Ex...
Uae-NO1 Black Magic Specialist In Lahore Black magic In Pakistan Kala Ilam Ex...Uae-NO1 Black Magic Specialist In Lahore Black magic In Pakistan Kala Ilam Ex...
Uae-NO1 Black Magic Specialist In Lahore Black magic In Pakistan Kala Ilam Ex...
 
Banking: Commercial and Central Banking.pptx
Banking: Commercial and Central Banking.pptxBanking: Commercial and Central Banking.pptx
Banking: Commercial and Central Banking.pptx
 
NO1 Certified kala jadu karne wale ka contact number kala jadu karne wale bab...
NO1 Certified kala jadu karne wale ka contact number kala jadu karne wale bab...NO1 Certified kala jadu karne wale ka contact number kala jadu karne wale bab...
NO1 Certified kala jadu karne wale ka contact number kala jadu karne wale bab...
 
Introduction to Health Economics Dr. R. Kurinji Malar.pptx
Introduction to Health Economics Dr. R. Kurinji Malar.pptxIntroduction to Health Economics Dr. R. Kurinji Malar.pptx
Introduction to Health Economics Dr. R. Kurinji Malar.pptx
 
Economic Risk Factor Update: April 2024 [SlideShare]
Economic Risk Factor Update: April 2024 [SlideShare]Economic Risk Factor Update: April 2024 [SlideShare]
Economic Risk Factor Update: April 2024 [SlideShare]
 
NO1 Certified Black Magic Specialist Expert In Bahawalpur, Sargodha, Sialkot,...
NO1 Certified Black Magic Specialist Expert In Bahawalpur, Sargodha, Sialkot,...NO1 Certified Black Magic Specialist Expert In Bahawalpur, Sargodha, Sialkot,...
NO1 Certified Black Magic Specialist Expert In Bahawalpur, Sargodha, Sialkot,...
 

Lifestyle and excelsior property bonuses jan 2012

  • 1. Liberty Investments Liberty Life Property Portfolio - Interim And Final Bonus Rate History Excelsior Property Portfolio Gross Interim Bonus Rates Per Annum Natural Person Owned Company Owned Untaxed Institution Flexible Retirement Flexible Flexible Investment Investment Investment Investment Investment Investment Living Annuity Year Investment Annuity Plan Investment Investment Plan Plan Plan Plan Plan Plan (300_LLA) Plan (300_SP_RA) Plan Plan (300_CB) (500_CB) (300_CB) (500_CB) (300_CB) (500_CB) (600_CB) (600_CB) (600_CB) 1985 1986 1987 1988 1989 Simulated Bonuses 1990 1991 18.22% 18.22% 18.22% 20.72% 18.22% 18.22% 18.22% 20.72% 20.72% 20.72% 20.72% 1992 13.22% 13.22% 13.22% 16.56% 13.22% 13.22% 13.22% 16.56% 16.56% 16.56% 16.56% 1993 14.06% 14.06% 14.06% 16.50% 14.06% 14.06% 14.06% 16.50% 16.50% 16.50% 16.50% 1994 13.22% 13.22% 13.22% 15.44% 13.22% 13.22% 13.22% 15.44% 15.44% 15.44% 15.44% 1995 11.83% 11.83% 11.83% 13.78% 11.83% 11.83% 11.83% 13.78% 13.78% 13.78% 13.78% 1996 13.78% 13.78% 13.78% 17.11% 13.78% 13.78% 13.78% 17.11% 17.11% 17.11% 17.11% 1997 13.22% 13.22% 13.22% 14.67% 13.22% 13.22% 13.22% 14.67% 14.67% 14.67% 14.67% 1998 13.89% 13.89% 13.89% 15.00% 13.89% 13.89% 13.89% 15.00% 15.00% 15.00% 15.00% 1999 11.56% 11.56% 11.56% 11.94% 11.56% 11.56% 11.56% 11.94% 11.94% 11.94% 11.94% 2000 13.59% 13.59% 13.59% 13.81% 13.59% 13.59% 13.59% 13.81% 13.81% 13.81% 13.81% 2001 12.48% 12.48% 12.48% 12.86% 12.48% 12.48% 12.48% 12.86% 12.86% 12.86% 12.86% 2002 8.95% 8.95% 8.95% 9.95% 8.95% 8.95% 8.95% 10.00% 10.00% 10.00% 10.00% 2003 11.00% 11.00% 11.00% 11.80% 10.60% 10.60% 10.60% 13.85% 13.85% 13.85% 13.85% 2004 10.00% 10.00% 10.00% 11.15% 9.65% 9.65% 9.65% 12.55% 12.55% 12.55% 12.55% 2005 9.55% 9.55% 9.55% 10.75% 9.25% 9.25% 9.25% 12.20% 12.20% 12.20% 12.20% 2006 10.00% 10.00% 10.00% 11.50% 9.70% 9.70% 9.70% 12.65% 12.65% 12.65% 12.65% 2007 9.45% 9.45% 9.45% 11.30% 9.20% 9.20% 9.20% 12.00% 12.00% 12.00% 12.00% 2008 8.80% 8.80% 8.80% 11.00% 8.60% 8.60% 8.60% 11.00% 11.00% 11.00% 11.00% 2009 7.95% 7.95% 7.95% 10.00% 7.85% 7.85% 7.85% 10.00% 10.00% 10.00% 10.00% 2010 7.45% 7.45% 7.45% 9.50% 7.40% 7.40% 7.40% 9.50% 9.50% 9.50% 9.50% 2011 6.30% 6.30% 6.30% 8.25% 6.25% 6.25% 6.25% 8.25% 8.25% 8.25% 8.25% 2012 6.05% 6.05% 6.05% 8.00% 6.05% 6.05% 6.05% 8.00% 8.00% 8.00% 8.00% Gross Final Bonus Rates Per Annum Natural Person Owned Company Owned Untaxed Institution Flexible Retirement Flexible Flexible Investment Investment Investment Investment Investment Investment Living Annuity Year Investment Annuity Plan Investment Investment Plan Plan Plan Plan Plan Plan (300_LLA) Plan (300_SP_RA) Plan Plan (300_CB) (500_CB) (300_CB) (500_CB) (300_CB) (500_CB) (600_CB) (600_CB) (600_CB) 1985 15.06% 15.06% 15.06% 16.06% 15.06% 15.06% 15.06% 16.06% 16.06% 16.06% 16.06% 1986 14.22% 14.22% 14.22% 15.50% 14.22% 14.22% 14.22% 15.50% 15.50% 15.50% 15.50% 1987 16.22% 16.22% 16.22% 17.39% 16.22% 16.22% 16.22% 17.39% 17.39% 17.39% 17.39% 1988 16.17% 16.17% 16.17% 18.50% 16.17% 16.17% 16.17% 18.50% 18.50% 18.50% 18.50% 1989 17.61% 17.61% 17.61% 19.67% 17.61% 17.61% 17.61% 19.67% 19.67% 19.67% 19.67% Simulated Bonuses 1990 18.22% 18.22% 18.22% 20.22% 18.22% 18.22% 18.22% 20.22% 20.22% 20.22% 20.22% 1991 18.22% 18.22% 18.22% 20.22% 18.22% 18.22% 18.22% 20.22% 20.22% 20.22% 20.22% 1992 14.61% 14.61% 14.61% 17.06% 14.61% 14.61% 14.61% 17.06% 17.06% 17.06% 17.06% 1993 13.78% 13.78% 13.78% 16.00% 13.78% 13.78% 13.78% 16.00% 16.00% 16.00% 16.00% 1994 12.39% 12.39% 12.39% 14.33% 12.39% 12.39% 12.39% 14.33% 14.33% 14.33% 14.33% 1995 14.33% 14.33% 14.33% 17.67% 14.33% 14.33% 14.33% 17.67% 17.67% 17.67% 17.67% 1996 13.78% 13.78% 13.78% 15.22% 13.78% 13.78% 13.78% 15.22% 15.22% 15.22% 15.22% 1997 17.22% 17.22% 17.22% 18.33% 17.22% 17.22% 17.22% 18.33% 18.33% 18.33% 18.33% 1998 12.22% 12.22% 12.22% 12.67% 12.22% 12.22% 12.22% 12.67% 12.67% 12.67% 12.67% 1999 17.11% 17.11% 17.11% 17.50% 17.11% 17.11% 17.11% 17.50% 17.50% 17.50% 17.50% 2000 15.25% 15.25% 15.25% 15.64% 15.25% 15.25% 15.25% 15.64% 15.64% 15.64% 15.64% 2001 12.48% 12.48% 12.48% 12.97% 12.48% 12.48% 12.48% 12.97% 12.97% 12.97% 12.97% 2002 11.70% 11.70% 11.70% 12.55% 11.25% 11.25% 11.25% 14.55% 14.55% 14.55% 14.55% 2003 11.80% 11.80% 11.80% 13.15% 11.35% 11.35% 11.35% 14.65% 14.65% 14.65% 14.65% 2004 10.95% 10.95% 10.95% 12.30% 10.55% 10.55% 10.55% 13.75% 13.75% 13.75% 13.75% 2005 13.60% 13.60% 13.60% 15.15% 13.05% 13.05% 13.05% 16.50% 16.50% 16.50% 16.50% 2006 16.45% 16.45% 16.45% 19.15% 15.75% 15.75% 15.75% 19.95% 19.95% 19.95% 19.95% 2007 17.11% 17.11% 17.11% 20.48% 16.34% 16.34% 16.34% 20.60% 20.60% 20.60% 20.60% 2008 12.18% 12.18% 12.18% 14.93% 11.87% 11.87% 11.87% 14.93% 14.93% 14.93% 14.93% 2009 9.07% 9.07% 9.07% 11.49% 8.98% 8.98% 8.98% 11.49% 11.49% 11.49% 11.49% 2010 9.75% 9.75% 9.75% 11.91% 9.56% 9.56% 9.56% 11.91% 11.91% 11.91% 11.91% 2011 8.42% 8.42% 8.42% 10.51% 8.30% 8.30% 8.30% 10.51% 10.51% 10.51% 10.51% l The above gross bonus rates are after an allowance for tax but before any ongoing management fees have been deducted. Liberty Investments Page 1 Of 3 Liberty Property Portfolio Returns Ver 1 (16 Jan 2012)
  • 2. Interim Bonus Rates Per Annum After Ongoing Management Fees Natural Person Owned Company Owned Untaxed Institution Flexible Retirement Flexible Flexible Investment Investment Investment Investment Investment Investment Living Annuity Year Investment Annuity Plan Investment Investment Plan Plan Plan Plan Plan Plan (300_LLA) Plan (300_SP_RA) Plan Plan (300_CB) (500_CB) (300_CB) (500_CB) (300_CB) (500_CB) (600_CB) (600_CB) (600_CB) Ongoing mngt. 1.92% 0.75% 1.20% 1.92% 1.92% 0.75% 1.20% 1.92% 0.75% 1.20% 1.00% fees per annum 1985 1986 1987 1988 1989 Simulated Bonuses 1990 1991 15.97% 17.34% 16.81% 18.42% 15.97% 17.34% 16.81% 18.42% 19.82% 19.28% 19.52% 1992 11.07% 12.38% 11.87% 14.34% 11.07% 12.38% 11.87% 14.34% 15.68% 15.16% 15.40% 1993 11.88% 13.20% 12.69% 14.28% 11.88% 13.20% 12.69% 14.28% 15.63% 15.11% 15.34% 1994 11.07% 12.38% 11.87% 13.25% 11.07% 12.38% 11.87% 13.25% 14.58% 14.07% 14.30% 1995 9.70% 11.00% 10.50% 11.61% 9.70% 11.00% 10.50% 11.61% 12.93% 12.42% 12.65% 1996 11.61% 12.93% 12.42% 14.88% 11.61% 12.93% 12.42% 14.88% 16.24% 15.71% 15.95% 1997 11.07% 12.38% 11.87% 12.48% 11.07% 12.38% 11.87% 12.48% 13.81% 13.30% 13.53% 1998 11.72% 13.04% 12.53% 12.81% 11.72% 13.04% 12.53% 12.81% 14.14% 13.63% 13.86% 1999 9.43% 10.72% 10.22% 9.81% 9.43% 10.72% 10.22% 9.81% 11.11% 10.61% 10.83% 2000 11.42% 12.74% 12.23% 11.64% 11.42% 12.74% 12.23% 11.64% 12.95% 12.45% 12.67% 2001 10.33% 11.63% 11.13% 10.71% 10.33% 11.63% 11.13% 10.71% 12.02% 11.51% 11.74% 2002 6.88% 8.14% 7.65% 7.86% 6.88% 8.14% 7.65% 7.91% 9.18% 8.69% 8.91% 2003 8.89% 10.17% 9.68% 9.67% 8.50% 9.77% 9.28% 11.68% 13.00% 12.49% 12.72% 2004 7.91% 9.18% 8.69% 9.03% 7.56% 8.83% 8.34% 10.41% 11.71% 11.21% 11.43% 2005 7.47% 8.73% 8.24% 8.64% 7.17% 8.43% 7.95% 10.06% 11.36% 10.86% 11.08% 2006 7.91% 9.18% 8.69% 9.38% 7.61% 8.88% 8.39% 10.51% 11.81% 11.31% 11.53% 2007 7.37% 8.63% 8.14% 9.18% 7.12% 8.38% 7.90% 9.87% 11.16% 10.66% 10.89% 2008 6.73% 7.99% 7.50% 8.89% 6.53% 7.79% 7.30% 8.89% 10.17% 9.68% 9.90% 2009 5.90% 7.14% 6.66% 7.91% 5.80% 7.04% 6.56% 7.91% 9.18% 8.69% 8.91% 2010 5.41% 6.65% 6.17% 7.42% 5.36% 6.60% 6.12% 7.42% 8.68% 8.19% 8.41% 2011 4.28% 5.51% 5.03% 6.19% 4.23% 5.46% 4.98% 6.19% 7.44% 6.96% 7.17% 2012 4.03% 5.26% 4.78% 5.94% 4.03% 5.26% 4.78% 5.94% 7.19% 6.71% 6.92% Final Bonus Rates Per Annum After Ongoing Management Fees Natural Person Owned Company Owned Untaxed Institution Flexible Retirement Flexible Flexible Investment Investment Investment Investment Investment Investment Living Annuity Year Investment Annuity Plan Investment Investment Plan Plan Plan Plan Plan Plan (300_LLA) Plan (300_SP_RA) Plan Plan (300_CB) (500_CB) (300_CB) (500_CB) (300_CB) (500_CB) (600_CB) (600_CB) (600_CB) Ongoing mngt. 1.92% 0.75% 1.20% 1.92% 1.92% 0.75% 1.20% 1.92% 0.75% 1.20% 1.00% fees per annum 1985 12.87% 14.20% 13.68% 13.85% 12.87% 14.20% 13.68% 13.85% 15.19% 14.67% 14.90% 1986 12.05% 13.37% 12.86% 13.30% 12.05% 13.37% 12.86% 13.30% 14.64% 14.12% 14.35% 1987 14.01% 15.35% 14.84% 15.15% 14.01% 15.35% 14.84% 15.15% 16.51% 15.99% 16.22% 1988 13.96% 15.30% 14.78% 16.24% 13.96% 15.30% 14.78% 16.24% 17.61% 17.09% 17.32% 1989 15.37% 16.73% 16.21% 17.39% 15.37% 16.73% 16.21% 17.39% 18.77% 18.24% 18.48% Simulated Bonuses 1990 15.97% 17.34% 16.81% 17.93% 15.97% 17.34% 16.81% 17.93% 19.32% 18.79% 19.03% 1991 15.97% 17.34% 16.81% 17.93% 15.97% 17.34% 16.81% 17.93% 19.32% 18.79% 19.03% 1992 12.43% 13.75% 13.24% 14.83% 12.43% 13.75% 13.24% 14.83% 16.18% 15.66% 15.89% 1993 11.61% 12.93% 12.42% 13.79% 11.61% 12.93% 12.42% 13.79% 15.13% 14.62% 14.85% 1994 10.25% 11.55% 11.05% 12.16% 10.25% 11.55% 11.05% 12.16% 13.48% 12.97% 13.20% 1995 12.16% 13.48% 12.97% 15.43% 12.16% 13.48% 12.97% 15.43% 16.79% 16.26% 16.50% 1996 11.61% 12.93% 12.42% 13.03% 11.61% 12.93% 12.42% 13.03% 14.36% 13.85% 14.08% 1997 14.99% 16.35% 15.82% 16.08% 14.99% 16.35% 15.82% 16.08% 17.45% 16.92% 17.16% 1998 10.09% 11.38% 10.88% 10.52% 10.09% 11.38% 10.88% 10.52% 11.82% 11.32% 11.55% 1999 14.88% 16.24% 15.71% 15.26% 14.88% 16.24% 15.71% 15.26% 16.62% 16.10% 16.33% 2000 13.06% 14.39% 13.88% 13.44% 13.06% 14.39% 13.88% 13.44% 14.77% 14.26% 14.49% 2001 10.33% 11.63% 11.13% 10.82% 10.33% 11.63% 11.13% 10.82% 12.13% 11.62% 11.85% 2002 9.57% 10.87% 10.37% 10.41% 9.13% 10.42% 9.92% 12.37% 13.69% 13.18% 13.41% 2003 9.67% 10.96% 10.47% 11.00% 9.23% 10.52% 10.02% 12.47% 13.79% 13.28% 13.51% 2004 8.84% 10.12% 9.63% 10.16% 8.45% 9.72% 9.23% 11.59% 12.90% 12.39% 12.62% 2005 11.44% 12.75% 12.24% 12.96% 10.90% 12.21% 11.70% 14.28% 15.63% 15.11% 15.34% 2006 14.23% 15.58% 15.06% 16.88% 13.55% 14.88% 14.37% 17.67% 19.05% 18.52% 18.76% 2007 14.88% 16.23% 15.71% 18.19% 14.13% 15.47% 14.95% 18.30% 19.70% 19.16% 19.40% 2008 10.04% 11.34% 10.84% 12.74% 9.74% 11.03% 10.53% 12.74% 14.07% 13.56% 13.79% 2009 6.99% 8.25% 7.77% 9.37% 6.91% 8.17% 7.68% 9.37% 10.66% 10.16% 10.38% 2010 7.66% 8.93% 8.44% 9.78% 7.47% 8.74% 8.25% 9.78% 11.07% 10.57% 10.80% 2011 6.36% 7.61% 7.13% 8.41% 6.24% 7.49% 7.01% 8.41% 9.68% 9.19% 9.41% l The above net bonus rates are after an allowance for tax and after any ongoing management fees have been deducted. The Flexible Investment Plan assumes one policy in a bundle. Liberty Investments Page 2 Of 3 Liberty Property Portfolio Returns Ver 1 (16 Jan 2012)
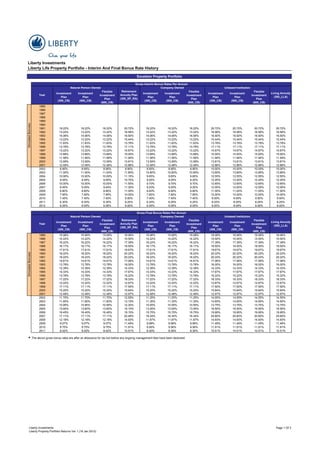
  • 3. Lifestyle Property Portfolio Interim Bonus Rate Final Bonus Rate Endowment Endowment Year Retirement Retirement (Individually (Individually Annuity Annuity owned) owned) 1991 15.50% 17.75% 15.50% 17.30% 1992 (as at 1 Jan) 15.00% 17.25% 0.00% 0.00% 1992 (as at 1 Aug) 11.00% 14.00% 12.25% 14.45% 1993 11.75% 13.95% 11.50% 13.50% 1994 11.00% 13.00% 10.25% 12.00% 1995 9.75% 11.50% 12.00% 15.00% 1996 11.50% 14.50% 11.50% 12.80% 1997 11.00% 12.30% 14.60% 15.60% 1998 11.60% 12.60% 10.10% 10.50% 1999 9.50% 9.85% 14.50% 14.85% 2000 10.50% 10.85% 12.00% 12.50% 2001 9.50% 10.00% 9.50% 10.10% 2002 9.00% 10.00% 9.40% 10.35% 2003 8.75% 9.65% 9.00% 10.35% 2004 7.40% 8.60% 8.25% 9.60% 2005 7.00% 8.25% 10.60% 12.10% 2006 7.40% 8.60% 13.15% 15.40% 2007 6.95% 8.50% 13.66% 16.59% 2008 6.45% 8.40% 9.48% 11.90% 2009 5.75% 7.55% 6.72% 8.86% 2010 5.30% 7.10% 7.32% 9.22% 2011 4.70% 6.10% 6.15% 8.01% 2011 4.50% 5.85% l The above bonus rates are after an allowance for tax and any ongoing management fees and shareholder fees invested in the Lifestyle Property portfolio. Conventional Life Annuities linked to the Property Portfolio Year Final Bonus Year Final Bonus 1992 16.06% 2001 12.63% 1993 15.00% 2002 13.13% 1994 13.33% 2003 12.74% 1995 16.67% 2004 11.86% 1996 14.22% 2005 14.59% 1997 17.32% 2006 17.84% 1998 13.15% 2007 18.54% 1999 17.93% 2008 13.33% 2000 15.46% l The above bonus rates are for conventional life annuities linked to the Property portfolio. The increase in the annual annuity income an annuitant will receive is dependant on the difference between the Property return and the base interest rate the original annuity was calculated on (previously 12% p.a., 8% p.a. and 6% p.a. have been used.) l The annuity income increases will occur every April. Sandton Properties* Sandton Year Tranche I Tranche II Tranche III Property (G)** 1999 14.50% 2000 12.72% 12.39% 12.04% 2001 11.39% 11.06% 11.04% 2002 8.50% 8.50% 8.50% 2003 9.63% 9.42% 9.63% 2004 7.59% 7.59% 7.59% 7.06% 2005 10.57% 10.23% 10.42% 10.32% 2006 11.70% 2007 15.17% 2008 12.89% 2009 8.36% 2010 6.21% 2011 6.51% 2012 (Interim) 4.70% * The bonuses rates for Sandton Properties are applicable for endowments. ** The bonus rates are applicable to those that have extended their original Sandton Property policy post the initial 5 year period. l The above bonus rates are after an allowance for tax and any ongoing management fees. Please Note l The interim rates are not guaranteed l The simulated bonuses above for the Excelsior Property portfolio are based on the Lifestyle Property portfolio bonuses. The Lifestyle portfolio ongoing management fees were added back so as to create approximate bonuses gross of ongoing fees. The returns for a company were based on the returns for a natural person and the returns for an untaxed institution were based on the RA returns. These are for illustrative purposes only. l The final rates net of management fees are an understatement of the true value due to estimation. The ongoing fees are levied on the interim bonus rate which is lower than the final bonus rate. The final bonus rate is only declared at the end of the year. l Prior to 2002, the RA returns were used as a proxy for the untaxed returns that could have been experienced under the Excelsior Property portfolio. l The returns are after an allowance for tax where indicated. l The returns are applicable to the amount of the lump sum invested and assume a single premium investment. l Whilst every attempt has been made to ensure the accuracy of the information contained herein, Liberty Life cannot be held responsible for any errors that may occur or for any damages suffered as a result of such errors. l This calculation is provided as an aid to assist you as financial adviser. It does not constitute advice by Liberty Life and you are urged to ensure that you verify the content and are comfortable with utilizing it as your personal advice. The results are an estimate based on the information provided and should not be relied on in isolation. l Any legal technical or product information contained in this document is subject to change from time to time and is not to be construed as advice by Liberty Life. Any recommendations made must take into consideration your specific needs and personal circumstances. If there are any discrepancies between this document and the contractual terms or, where applicable, any fund rules, the latter will prevail. Past performance cannot be relied on as an indication of future performance. Investment performance will depend on the growth in the underlying assets, which will be influenced by inflation levels in the economy and prevailing market conditions. E. And O.E. Liberty Investments Page 3 Of 3 Liberty Property Portfolio Returns Ver 1 (16 Jan 2012)