1. Weekly Market Recap December 17, 2012
The week in review Weekly data center Index returns Index characteristics
- European Finance Ministers agreed on the
Equities Last 1 week QTD YTD 1 year 3 years P/E Forward P/B Div. Yld. Mkt. Cap (bn)
ECB's role as sole regulator of large S&P 500 1414 -0.32 3.77 12.40 16.65 26.88 12.64 2.29 2.31 102.81
banks. Dow Jones 30 13135 -0.15 -2.25 7.51 11.09 25.08 11.84 2.82 2.46 N/A
- Jobless claims fell to 343k. Russell 2000 823.75 0.18 -1.64 11.18 16.27 35.09 16.57 1.69 1.49 1.28
Russell 1000 Growth 651.86 -0.56 -2.75 12.22 15.81 31.24 14.66 4.70 1.80 95.71
- Retail sales increased 0.3% for November. Russell 1000 Value 709.56 -0.04 -0.18 13.34 18.48 25.08 11.57 1.54 2.56 87.19
- Answer to last week's question: +1.7tn in MSCI EAFE 763.61 0.69 5.61 11.94 14.64 -0.42 11.91 1.43 3.54 44.14
3Q12 MSCI EM 46329 1.61 4.09 12.96 13.80 8.64 10.73 1.75 2.81 39.89
Fixed income Last 1 week QTD YTD 1 year 3 years Levels
The week ahead U.S. Aggregate 109.32 -0.28 -0.56 0.30 0.28 4.38 Currencies Latest -1 month -1 year
- Empire State Manufacturing Survey U.S. Corporates 113.86 -0.33 -0.54 3.47 3.75 7.10 $ per € 1.31 1.27 1.30
- Housing Starts Municipals (10yr) 114.70 -1.04 0.61 2.93 3.59 7.42 $ per £ 1.61 1.58 1.54
- Existing home sales High Yield 104.57 0.27 1.24 6.79 7.80 10.91 ¥ per $ 83.50 80.22 78.11
2-yr U.S. Treasuries 0.25 0.00 6.96 1.23 5.13 -70.95
- Philly Fed Manufacturing Survey Commodities Latest -1 month -1 year
10-yr U.S. Treasuries 1.71 4.92 4.53 -9.16 -10.38 -51.88
- 3Q12 Real GDP, final estimate 30-yr U.S. Treasuries 2.87 2.14 1.77 -0.69 -1.37 -35.94 Oil (WTI) 86.73 86.32 94.95
- Personal income and consumer spending 10-yr German Bund 1.35 4.02 -7.88 -26.98 -29.17 -57.83 Gasoline 3.35 3.39 3.29
- Consumer sentiment, final estimate Natural Gas 3.15 3.66 3.07
Key rates Last 1 week QTD YTD 1 year 3 years Gold 1696 1726 1603
3-mo. LIBOR 0.31 0.31 0.36 0.58 0.56 0.25
Thought of the week 3-mo. EURIBOR 0.19 0.19 0.22 1.38 1.44 0.73
Silver 32.52 32.48 29.92
Copper 8048 7635 7350
Last week, the Federal Reserve announced 6-mo. CD rate 0.32 0.33 0.34 0.64 0.67 0.30 Corn 7.34 7.20 5.67
it would begin purchasing longer-dated U.S. 30-yr fixed mortgage 3.47 3.52 3.53 4.07 4.12 4.92
Treasuries at a pace of $45bn per month to Prime Rate 3.25 3.25 3.25 3.25 3.25 3.25
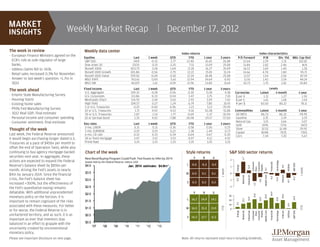
offset the end of Operation Twist, while also
continuing to buy agency mortgage-backed Chart of the week Style returns S&P 500 sector returns
securities next year. In aggregate, these New Bond Buying Program Could Push Fed Assets to $4tn by 2014 V B G
1.7
2
actions are expected to expand the Federal
Technology
Assets held by the Federal Reserve, trillions USD
Consumer
Consumer
Financials
L 0.0 -0.3 -0.5
S&P 500
Reserve's balance sheet by $85bn per $4.0 Jan. 2014 estimate: $4.0tn*
Utilities
Staples
Energy
0.5
0.4
1
Discr.
1 week
month, driving the Fed's assets to nearly
0.1
1 week
$3.5 M 0.0 0.1 0.1 0
$4tn by January 2014. Since the financial
Materials
Industrials
Health Care
Telecom
-0.2
crisis, the Fed's balance sheet has
-0.3
-0.4
$3.0
-0.5
-0.6
-1
-0.7
increased +350%, but the effectiveness of S 0.3 0.2 0.2
-1.2
the Fed's quantitative easing remains $2.5 -2
debatable. With additional unprecedented V B G
24.9
$2.0
21.6
19.6
19.0
30
monetary policy on the horizon, it is
14.9
13.9
13.0
12.8
L 16.2 14.9 14.1
11.2
important to remain cognizant of the risks $1.5 20
4.2
0.9
10
associated with these measures. For better
YTD
YTD
$1.0 M 16.5 15.3 13.9 0
or for worse, the Federal Reserve is in
Energy
Materials
Industrials
Consumer
Discr.
Consumer
Staples
Health Care
Financials
Technology
Telecom
Utilities
S&P 500
unchartered territory, and as such, it is as $0.5
S 14.2 12.7 11.2
important as ever that investors stay
balanced in an effort to grapple with the $0.0
'07 '08 '09 '10 '11 '12 '13
uncertainty created by unconventional
monetary policy.
Please see important disclosure on next page. Note: All returns represent total return including dividends.