1. Questions regarding Part I of the NCLB Report Card should be directed to the Division of Performance Reporting. Contact us at (512)
463-9704 or performance.reporting@tea.state.tx.us.
Special formats ('*', >99%, <1%, 'n/a') are used in order to comply with the Family Educational Rights and Privacy Act (FERPA).
For grades 3-8, the 2011-12 assessment results are based on the State of Texas Assessments of Academic Readiness (STAAR) results at the
TAKS-equivalency standard that was developed using the STAAR Bridge Study, including required changes due to the transition to the
new assessment program. The 2010-11 assessment results are based on the Texas Assessment of Knowledge and Skills (TAKS) results at
the Met Standard level.
Student Achievement results are rounded to the nearest whole percent.
* Asian, Pacific Islander and Two or More Races are not available for indicators that use the former race/ethnicity definitions. See the
Texas NCLB Glossary for details.
Portions of the NCLB Report Card (Part I, Part II, etc. or prior year information) may not appear when data are not reported.
Texas 2012 NCLB Report Card 1
Part I - District Level: Student Performance for Each District Compared to the State, Percent of Students Tested,
Student Achievement by Proficiency Level, 2010-11, 2011-12*
February 1, 2013
For MCKINNEY ISD (043907)
Questions regarding Part I of the NCLB Report Card should be directed to the Division of Performance Reporting. Contact us at (512)
463-9704 or performance.reporting@tea.state.tx.us.
Special formats ('*', >99%, <1%, 'n/a') are used in order to comply with the Family Educational Rights and Privacy Act (FERPA).
For grades 3-8, the 2011-12 assessment results are based on the State of Texas Assessments of Academic Readiness (STAAR) results at the
TAKS-equivalency standard that was developed using the STAAR Bridge Study, including required changes due to the transition to the
new assessment program. The 2010-11 assessment results are based on the Texas Assessment of Knowledge and Skills (TAKS) results at
the Met Standard level.
Student Achievement results are rounded to the nearest whole percent.
* Asian, Pacific Islander and Two or More Races are not available for indicators that use the former race/ethnicity definitions. See the
Texas NCLB Glossary for details.
Portions of the NCLB Report Card (Part I, Part II, etc. or prior year information) may not appear when data are not reported.
Texas 2012 NCLB Report Card 1
Part I - District Level: Student Performance for Each District Compared to the State, Percent of Students Tested,
Student Achievement by Proficiency Level, 2010-11, 2011-12*
February 1, 2013
For MCKINNEY ISD (043907)
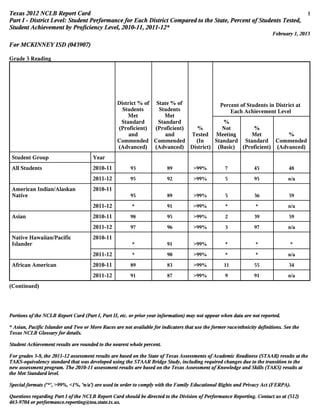
Grade 3 Reading
District % of
Students
Met
Standard
(Proficient)
and
Commended
(Advanced)
State % of
Students
Met
Standard
(Proficient)
and
Commended
(Advanced)
%
Tested
(In
District)
Percent of Students in District at
Each Achievement Level
%
Not
Meeting
Standard
(Basic)
%
Met
Standard
(Proficient)
%
Commended
(Advanced)
Student Group Year
All Students 2010-11 93 89 >99% 7 45 48
2011-12 95 92 >99% 5 95 n/a
American Indian/Alaskan
Native
2010-11
95 89 >99% 5 36 59
2011-12 * 91 >99% * * n/a
Asian 2010-11 98 95 >99% 2 39 59
2011-12 97 96 >99% 3 97 n/a
Native Hawaiian/Pacific
Islander
2010-11
* 91 >99% * * *
2011-12 * 90 >99% * * n/a
African American 2010-11 89 83 >99% 11 55 34
2011-12 91 87 >99% 9 91 n/a
(Continued)
2. Questions regarding Part I of the NCLB Report Card should be directed to the Division of Performance Reporting. Contact us at (512)
463-9704 or performance.reporting@tea.state.tx.us.
Special formats ('*', >99%, <1%, 'n/a') are used in order to comply with the Family Educational Rights and Privacy Act (FERPA).
For grades 3-8, the 2011-12 assessment results are based on the State of Texas Assessments of Academic Readiness (STAAR) results at the
TAKS-equivalency standard that was developed using the STAAR Bridge Study, including required changes due to the transition to the
new assessment program. The 2010-11 assessment results are based on the Texas Assessment of Knowledge and Skills (TAKS) results at
the Met Standard level.
Student Achievement results are rounded to the nearest whole percent.
* Asian, Pacific Islander and Two or More Races are not available for indicators that use the former race/ethnicity definitions. See the
Texas NCLB Glossary for details.
Portions of the NCLB Report Card (Part I, Part II, etc. or prior year information) may not appear when data are not reported.
Texas 2012 NCLB Report Card 2
Part I - District Level: Student Performance for Each District Compared to the State, Percent of Students Tested,
Student Achievement by Proficiency Level, 2010-11, 2011-12*
February 1, 2013
For MCKINNEY ISD (043907)
Grade 3 Reading
District % of
Students
Met
Standard
(Proficient)
and
Commended
(Advanced)
State % of
Students
Met
Standard
(Proficient)
and
Commended
(Advanced)
%
Tested
(In
District)
Percent of Students in District at
Each Achievement Level
%
Not
Meeting
Standard
(Basic)
%
Met
Standard
(Proficient)
%
Commended
(Advanced)
Student Group Year
Hispanic 2010-11 86 87 >99% 14 55 31
2011-12 89 90 >99% 11 89 n/a
White 2010-11 96 94 >99% 4 39 57
2011-12 99 96 >99% 1 99 n/a
Two or More Races 2010-11 88 93 >99% 13 25 63
2011-12 98 95 >99% 2 98 n/a
Female 2010-11 94 91 >99% 6 44 51
2011-12 96 93 >99% 4 96 n/a
Male 2010-11 91 87 >99% 9 46 45
2011-12 95 90 >99% 5 95 n/a
(Continued)
3. Questions regarding Part I of the NCLB Report Card should be directed to the Division of Performance Reporting. Contact us at (512)
463-9704 or performance.reporting@tea.state.tx.us.
Special formats ('*', >99%, <1%, 'n/a') are used in order to comply with the Family Educational Rights and Privacy Act (FERPA).
For grades 3-8, the 2011-12 assessment results are based on the State of Texas Assessments of Academic Readiness (STAAR) results at the
TAKS-equivalency standard that was developed using the STAAR Bridge Study, including required changes due to the transition to the
new assessment program. The 2010-11 assessment results are based on the Texas Assessment of Knowledge and Skills (TAKS) results at
the Met Standard level.
Student Achievement results are rounded to the nearest whole percent.
* Asian, Pacific Islander and Two or More Races are not available for indicators that use the former race/ethnicity definitions. See the
Texas NCLB Glossary for details.
Portions of the NCLB Report Card (Part I, Part II, etc. or prior year information) may not appear when data are not reported.
Texas 2012 NCLB Report Card 3
Part I - District Level: Student Performance for Each District Compared to the State, Percent of Students Tested,
Student Achievement by Proficiency Level, 2010-11, 2011-12*
February 1, 2013
For MCKINNEY ISD (043907)
Grade 3 Reading
District % of
Students
Met
Standard
(Proficient)
and
Commended
(Advanced)
State % of
Students
Met
Standard
(Proficient)
and
Commended
(Advanced)
%
Tested
(In
District)
Percent of Students in District at
Each Achievement Level
%
Not
Meeting
Standard
(Basic)
%
Met
Standard
(Proficient)
%
Commended
(Advanced)
Student Group Year
Special Education 2010-11 85 82 >99% 15 53 32
2011-12 93 86 >99% 7 93 n/a
Limited English Proficient 2010-11 83 85 >99% 17 61 22
2011-12 84 88 >99% 16 84 n/a
Economically Disadvantaged 2010-11 85 85 >99% 15 58 26
2011-12 89 89 >99% 11 89 n/a
Migrant 2010-11 * 80 * * * *
2011-12 * 84 * * * n/a
4. Questions regarding Part I of the NCLB Report Card should be directed to the Division of Performance Reporting. Contact us at (512)
463-9704 or performance.reporting@tea.state.tx.us.
Special formats ('*', >99%, <1%, 'n/a') are used in order to comply with the Family Educational Rights and Privacy Act (FERPA).
For grades 3-8, the 2011-12 assessment results are based on the State of Texas Assessments of Academic Readiness (STAAR) results at the
TAKS-equivalency standard that was developed using the STAAR Bridge Study, including required changes due to the transition to the
new assessment program. The 2010-11 assessment results are based on the Texas Assessment of Knowledge and Skills (TAKS) results at
the Met Standard level.
Student Achievement results are rounded to the nearest whole percent.
* Asian, Pacific Islander and Two or More Races are not available for indicators that use the former race/ethnicity definitions. See the
Texas NCLB Glossary for details.
Portions of the NCLB Report Card (Part I, Part II, etc. or prior year information) may not appear when data are not reported.
Texas 2012 NCLB Report Card 4
Part I - District Level: Student Performance for Each District Compared to the State, Percent of Students Tested,
Student Achievement by Proficiency Level, 2010-11, 2011-12*
February 1, 2013
For MCKINNEY ISD (043907)
Questions regarding Part I of the NCLB Report Card should be directed to the Division of Performance Reporting. Contact us at (512)
463-9704 or performance.reporting@tea.state.tx.us.
Special formats ('*', >99%, <1%, 'n/a') are used in order to comply with the Family Educational Rights and Privacy Act (FERPA).
For grades 3-8, the 2011-12 assessment results are based on the State of Texas Assessments of Academic Readiness (STAAR) results at the
TAKS-equivalency standard that was developed using the STAAR Bridge Study, including required changes due to the transition to the
new assessment program. The 2010-11 assessment results are based on the Texas Assessment of Knowledge and Skills (TAKS) results at
the Met Standard level.
Student Achievement results are rounded to the nearest whole percent.
* Asian, Pacific Islander and Two or More Races are not available for indicators that use the former race/ethnicity definitions. See the
Texas NCLB Glossary for details.
Portions of the NCLB Report Card (Part I, Part II, etc. or prior year information) may not appear when data are not reported.
Texas 2012 NCLB Report Card 4
Part I - District Level: Student Performance for Each District Compared to the State, Percent of Students Tested,
Student Achievement by Proficiency Level, 2010-11, 2011-12*
February 1, 2013
For MCKINNEY ISD (043907)
Grade 3 Mathematics
District % of
Students
Met
Standard
(Proficient)
and
Commended
(Advanced)
State % of
Students
Met
Standard
(Proficient)
and
Commended
(Advanced)
%
Tested
(In
District)
Percent of Students in District at
Each Achievement Level
%
Not
Meeting
Standard
(Basic)
%
Met
Standard
(Proficient)
%
Commended
(Advanced)
Student Group Year
All Students 2010-11 90 86 >99% 10 51 39
2011-12 89 86 >99% 11 89 n/a
American Indian/Alaskan
Native
2010-11
95 86 >99% 5 59 36
2011-12 81 87 >99% 19 81 n/a
Asian 2010-11 95 96 99 5 34 61
2011-12 91 96 >99% 9 91 n/a
Native Hawaiian/Pacific
Islander
2010-11
* 88 >99% * * *
2011-12 * 87 >99% * * n/a
African American 2010-11 82 77 >99% 18 60 22
2011-12 74 76 >99% 26 74 n/a
(Continued)
5. Questions regarding Part I of the NCLB Report Card should be directed to the Division of Performance Reporting. Contact us at (512)
463-9704 or performance.reporting@tea.state.tx.us.
Special formats ('*', >99%, <1%, 'n/a') are used in order to comply with the Family Educational Rights and Privacy Act (FERPA).
For grades 3-8, the 2011-12 assessment results are based on the State of Texas Assessments of Academic Readiness (STAAR) results at the
TAKS-equivalency standard that was developed using the STAAR Bridge Study, including required changes due to the transition to the
new assessment program. The 2010-11 assessment results are based on the Texas Assessment of Knowledge and Skills (TAKS) results at
the Met Standard level.
Student Achievement results are rounded to the nearest whole percent.
* Asian, Pacific Islander and Two or More Races are not available for indicators that use the former race/ethnicity definitions. See the
Texas NCLB Glossary for details.
Portions of the NCLB Report Card (Part I, Part II, etc. or prior year information) may not appear when data are not reported.
Texas 2012 NCLB Report Card 5
Part I - District Level: Student Performance for Each District Compared to the State, Percent of Students Tested,
Student Achievement by Proficiency Level, 2010-11, 2011-12*
February 1, 2013
For MCKINNEY ISD (043907)
Grade 3 Mathematics
District % of
Students
Met
Standard
(Proficient)
and
Commended
(Advanced)
State % of
Students
Met
Standard
(Proficient)
and
Commended
(Advanced)
%
Tested
(In
District)
Percent of Students in District at
Each Achievement Level
%
Not
Meeting
Standard
(Basic)
%
Met
Standard
(Proficient)
%
Commended
(Advanced)
Student Group Year
Hispanic 2010-11 82 84 >99% 18 55 27
2011-12 84 84 >99% 16 84 n/a
White 2010-11 94 92 >99% 6 49 46
2011-12 94 92 >99% 6 94 n/a
Two or More Races 2010-11 75 90 >99% 25 38 38
2011-12 90 90 >99% 10 90 n/a
Female 2010-11 90 86 >99% 10 54 36
2011-12 88 86 >99% 12 88 n/a
Male 2010-11 90 87 >99% 10 48 42
2011-12 90 86 >99% 10 90 n/a
(Continued)
6. Questions regarding Part I of the NCLB Report Card should be directed to the Division of Performance Reporting. Contact us at (512)
463-9704 or performance.reporting@tea.state.tx.us.
Special formats ('*', >99%, <1%, 'n/a') are used in order to comply with the Family Educational Rights and Privacy Act (FERPA).
For grades 3-8, the 2011-12 assessment results are based on the State of Texas Assessments of Academic Readiness (STAAR) results at the
TAKS-equivalency standard that was developed using the STAAR Bridge Study, including required changes due to the transition to the
new assessment program. The 2010-11 assessment results are based on the Texas Assessment of Knowledge and Skills (TAKS) results at
the Met Standard level.
Student Achievement results are rounded to the nearest whole percent.
* Asian, Pacific Islander and Two or More Races are not available for indicators that use the former race/ethnicity definitions. See the
Texas NCLB Glossary for details.
Portions of the NCLB Report Card (Part I, Part II, etc. or prior year information) may not appear when data are not reported.
Texas 2012 NCLB Report Card 6
Part I - District Level: Student Performance for Each District Compared to the State, Percent of Students Tested,
Student Achievement by Proficiency Level, 2010-11, 2011-12*
February 1, 2013
For MCKINNEY ISD (043907)
Grade 3 Mathematics
District % of
Students
Met
Standard
(Proficient)
and
Commended
(Advanced)
State % of
Students
Met
Standard
(Proficient)
and
Commended
(Advanced)
%
Tested
(In
District)
Percent of Students in District at
Each Achievement Level
%
Not
Meeting
Standard
(Basic)
%
Met
Standard
(Proficient)
%
Commended
(Advanced)
Student Group Year
Special Education 2010-11 81 78 >99% 19 58 23
2011-12 80 77 >99% 20 80 n/a
Limited English Proficient 2010-11 78 83 >99% 22 57 21
2011-12 82 83 >99% 18 82 n/a
Economically Disadvantaged 2010-11 80 82 >99% 20 56 23
2011-12 80 82 >99% 20 80 n/a
Migrant 2010-11 * 79 * * * *
2011-12 * 78 * * * n/a
7. Questions regarding Part I of the NCLB Report Card should be directed to the Division of Performance Reporting. Contact us at (512)
463-9704 or performance.reporting@tea.state.tx.us.
Special formats ('*', >99%, <1%, 'n/a') are used in order to comply with the Family Educational Rights and Privacy Act (FERPA).
For grades 3-8, the 2011-12 assessment results are based on the State of Texas Assessments of Academic Readiness (STAAR) results at the
TAKS-equivalency standard that was developed using the STAAR Bridge Study, including required changes due to the transition to the
new assessment program. The 2010-11 assessment results are based on the Texas Assessment of Knowledge and Skills (TAKS) results at
the Met Standard level.
Student Achievement results are rounded to the nearest whole percent.
* Asian, Pacific Islander and Two or More Races are not available for indicators that use the former race/ethnicity definitions. See the
Texas NCLB Glossary for details.
Portions of the NCLB Report Card (Part I, Part II, etc. or prior year information) may not appear when data are not reported.
Texas 2012 NCLB Report Card 7
Part I - District Level: Student Performance for Each District Compared to the State, Percent of Students Tested,
Student Achievement by Proficiency Level, 2010-11, 2011-12*
February 1, 2013
For MCKINNEY ISD (043907)
Questions regarding Part I of the NCLB Report Card should be directed to the Division of Performance Reporting. Contact us at (512)
463-9704 or performance.reporting@tea.state.tx.us.
Special formats ('*', >99%, <1%, 'n/a') are used in order to comply with the Family Educational Rights and Privacy Act (FERPA).
For grades 3-8, the 2011-12 assessment results are based on the State of Texas Assessments of Academic Readiness (STAAR) results at the
TAKS-equivalency standard that was developed using the STAAR Bridge Study, including required changes due to the transition to the
new assessment program. The 2010-11 assessment results are based on the Texas Assessment of Knowledge and Skills (TAKS) results at
the Met Standard level.
Student Achievement results are rounded to the nearest whole percent.
* Asian, Pacific Islander and Two or More Races are not available for indicators that use the former race/ethnicity definitions. See the
Texas NCLB Glossary for details.
Portions of the NCLB Report Card (Part I, Part II, etc. or prior year information) may not appear when data are not reported.
Texas 2012 NCLB Report Card 7
Part I - District Level: Student Performance for Each District Compared to the State, Percent of Students Tested,
Student Achievement by Proficiency Level, 2010-11, 2011-12*
February 1, 2013
For MCKINNEY ISD (043907)
Grade 4 Reading
District % of
Students
Met
Standard
(Proficient)
and
Commended
(Advanced)
State % of
Students
Met
Standard
(Proficient)
and
Commended
(Advanced)
%
Tested
(In
District)
Percent of Students in District at
Each Achievement Level
%
Not
Meeting
Standard
(Basic)
%
Met
Standard
(Proficient)
%
Commended
(Advanced)
Student Group Year
All Students 2010-11 89 85 >99% 11 43 46
2011-12 93 87 >99% 7 93 n/a
American Indian/Alaskan
Native
2010-11
77 86 >99% 23 46 31
2011-12 92 88 >99% 8 92 n/a
Asian 2010-11 97 93 >99% 3 31 66
2011-12 99 94 >99% 1 99 n/a
Native Hawaiian/Pacific
Islander
2010-11
* 84 >99% * * *
2011-12 86 90 >99% 14 86 n/a
African American 2010-11 79 79 >99% 21 48 32
2011-12 86 79 >99% 14 86 n/a
(Continued)
8. Questions regarding Part I of the NCLB Report Card should be directed to the Division of Performance Reporting. Contact us at (512)
463-9704 or performance.reporting@tea.state.tx.us.
Special formats ('*', >99%, <1%, 'n/a') are used in order to comply with the Family Educational Rights and Privacy Act (FERPA).
For grades 3-8, the 2011-12 assessment results are based on the State of Texas Assessments of Academic Readiness (STAAR) results at the
TAKS-equivalency standard that was developed using the STAAR Bridge Study, including required changes due to the transition to the
new assessment program. The 2010-11 assessment results are based on the Texas Assessment of Knowledge and Skills (TAKS) results at
the Met Standard level.
Student Achievement results are rounded to the nearest whole percent.
* Asian, Pacific Islander and Two or More Races are not available for indicators that use the former race/ethnicity definitions. See the
Texas NCLB Glossary for details.
Portions of the NCLB Report Card (Part I, Part II, etc. or prior year information) may not appear when data are not reported.
Texas 2012 NCLB Report Card 8
Part I - District Level: Student Performance for Each District Compared to the State, Percent of Students Tested,
Student Achievement by Proficiency Level, 2010-11, 2011-12*
February 1, 2013
For MCKINNEY ISD (043907)
Grade 4 Reading
District % of
Students
Met
Standard
(Proficient)
and
Commended
(Advanced)
State % of
Students
Met
Standard
(Proficient)
and
Commended
(Advanced)
%
Tested
(In
District)
Percent of Students in District at
Each Achievement Level
%
Not
Meeting
Standard
(Basic)
%
Met
Standard
(Proficient)
%
Commended
(Advanced)
Student Group Year
Hispanic 2010-11 77 82 99 23 52 25
2011-12 87 84 >99% 13 87 n/a
White 2010-11 96 93 >99% 4 38 57
2011-12 97 94 99 3 97 n/a
Two or More Races 2010-11 94 90 >99% 6 38 56
2011-12 98 91 >99% 2 98 n/a
Female 2010-11 90 87 >99% 10 42 48
2011-12 94 89 >99% 6 94 n/a
Male 2010-11 88 84 >99% 12 44 45
2011-12 92 85 99 8 92 n/a
(Continued)
9. Questions regarding Part I of the NCLB Report Card should be directed to the Division of Performance Reporting. Contact us at (512)
463-9704 or performance.reporting@tea.state.tx.us.
Special formats ('*', >99%, <1%, 'n/a') are used in order to comply with the Family Educational Rights and Privacy Act (FERPA).
For grades 3-8, the 2011-12 assessment results are based on the State of Texas Assessments of Academic Readiness (STAAR) results at the
TAKS-equivalency standard that was developed using the STAAR Bridge Study, including required changes due to the transition to the
new assessment program. The 2010-11 assessment results are based on the Texas Assessment of Knowledge and Skills (TAKS) results at
the Met Standard level.
Student Achievement results are rounded to the nearest whole percent.
* Asian, Pacific Islander and Two or More Races are not available for indicators that use the former race/ethnicity definitions. See the
Texas NCLB Glossary for details.
Portions of the NCLB Report Card (Part I, Part II, etc. or prior year information) may not appear when data are not reported.
Texas 2012 NCLB Report Card 9
Part I - District Level: Student Performance for Each District Compared to the State, Percent of Students Tested,
Student Achievement by Proficiency Level, 2010-11, 2011-12*
February 1, 2013
For MCKINNEY ISD (043907)
Grade 4 Reading
District % of
Students
Met
Standard
(Proficient)
and
Commended
(Advanced)
State % of
Students
Met
Standard
(Proficient)
and
Commended
(Advanced)
%
Tested
(In
District)
Percent of Students in District at
Each Achievement Level
%
Not
Meeting
Standard
(Basic)
%
Met
Standard
(Proficient)
%
Commended
(Advanced)
Student Group Year
Special Education 2010-11 74 77 >99% 26 46 28
2011-12 85 78 >99% 15 85 n/a
Limited English Proficient 2010-11 64 75 99 36 49 15
2011-12 82 79 >99% 18 82 n/a
Economically Disadvantaged 2010-11 73 80 99 27 52 21
2011-12 85 82 >99% 15 85 n/a
Migrant 2010-11 * 72 * * * *
2011-12 * 75 * * * n/a
10. Questions regarding Part I of the NCLB Report Card should be directed to the Division of Performance Reporting. Contact us at (512)
463-9704 or performance.reporting@tea.state.tx.us.
Special formats ('*', >99%, <1%, 'n/a') are used in order to comply with the Family Educational Rights and Privacy Act (FERPA).
For grades 3-8, the 2011-12 assessment results are based on the State of Texas Assessments of Academic Readiness (STAAR) results at the
TAKS-equivalency standard that was developed using the STAAR Bridge Study, including required changes due to the transition to the
new assessment program. The 2010-11 assessment results are based on the Texas Assessment of Knowledge and Skills (TAKS) results at
the Met Standard level.
Student Achievement results are rounded to the nearest whole percent.
* Asian, Pacific Islander and Two or More Races are not available for indicators that use the former race/ethnicity definitions. See the
Texas NCLB Glossary for details.
Portions of the NCLB Report Card (Part I, Part II, etc. or prior year information) may not appear when data are not reported.
Texas 2012 NCLB Report Card 10
Part I - District Level: Student Performance for Each District Compared to the State, Percent of Students Tested,
Student Achievement by Proficiency Level, 2010-11, 2011-12*
February 1, 2013
For MCKINNEY ISD (043907)
Questions regarding Part I of the NCLB Report Card should be directed to the Division of Performance Reporting. Contact us at (512)
463-9704 or performance.reporting@tea.state.tx.us.
Special formats ('*', >99%, <1%, 'n/a') are used in order to comply with the Family Educational Rights and Privacy Act (FERPA).
For grades 3-8, the 2011-12 assessment results are based on the State of Texas Assessments of Academic Readiness (STAAR) results at the
TAKS-equivalency standard that was developed using the STAAR Bridge Study, including required changes due to the transition to the
new assessment program. The 2010-11 assessment results are based on the Texas Assessment of Knowledge and Skills (TAKS) results at
the Met Standard level.
Student Achievement results are rounded to the nearest whole percent.
* Asian, Pacific Islander and Two or More Races are not available for indicators that use the former race/ethnicity definitions. See the
Texas NCLB Glossary for details.
Portions of the NCLB Report Card (Part I, Part II, etc. or prior year information) may not appear when data are not reported.
Texas 2012 NCLB Report Card 10
Part I - District Level: Student Performance for Each District Compared to the State, Percent of Students Tested,
Student Achievement by Proficiency Level, 2010-11, 2011-12*
February 1, 2013
For MCKINNEY ISD (043907)
Grade 4 Mathematics
District % of
Students
Met
Standard
(Proficient)
and
Commended
(Advanced)
State % of
Students
Met
Standard
(Proficient)
and
Commended
(Advanced)
%
Tested
(In
District)
Percent of Students in District at
Each Achievement Level
%
Not
Meeting
Standard
(Basic)
%
Met
Standard
(Proficient)
%
Commended
(Advanced)
Student Group Year
All Students 2010-11 89 88 >99% 11 45 44
2011-12 92 89 >99% 8 92 n/a
American Indian/Alaskan
Native
2010-11
* 89 >99% * * *
2011-12 92 90 >99% 8 92 n/a
Asian 2010-11 97 96 98 3 26 70
2011-12 97 97 >99% 3 97 n/a
Native Hawaiian/Pacific
Islander
2010-11
80 88 >99% 20 50 30
2011-12 86 93 >99% 14 86 n/a
African American 2010-11 77 80 >99% 23 50 26
2011-12 84 80 >99% 16 84 n/a
(Continued)
11. Questions regarding Part I of the NCLB Report Card should be directed to the Division of Performance Reporting. Contact us at (512)
463-9704 or performance.reporting@tea.state.tx.us.
Special formats ('*', >99%, <1%, 'n/a') are used in order to comply with the Family Educational Rights and Privacy Act (FERPA).
For grades 3-8, the 2011-12 assessment results are based on the State of Texas Assessments of Academic Readiness (STAAR) results at the
TAKS-equivalency standard that was developed using the STAAR Bridge Study, including required changes due to the transition to the
new assessment program. The 2010-11 assessment results are based on the Texas Assessment of Knowledge and Skills (TAKS) results at
the Met Standard level.
Student Achievement results are rounded to the nearest whole percent.
* Asian, Pacific Islander and Two or More Races are not available for indicators that use the former race/ethnicity definitions. See the
Texas NCLB Glossary for details.
Portions of the NCLB Report Card (Part I, Part II, etc. or prior year information) may not appear when data are not reported.
Texas 2012 NCLB Report Card 11
Part I - District Level: Student Performance for Each District Compared to the State, Percent of Students Tested,
Student Achievement by Proficiency Level, 2010-11, 2011-12*
February 1, 2013
For MCKINNEY ISD (043907)
Grade 4 Mathematics
District % of
Students
Met
Standard
(Proficient)
and
Commended
(Advanced)
State % of
Students
Met
Standard
(Proficient)
and
Commended
(Advanced)
%
Tested
(In
District)
Percent of Students in District at
Each Achievement Level
%
Not
Meeting
Standard
(Basic)
%
Met
Standard
(Proficient)
%
Commended
(Advanced)
Student Group Year
Hispanic 2010-11 80 86 >99% 20 50 30
2011-12 86 88 >99% 14 86 n/a
White 2010-11 95 92 >99% 5 43 52
2011-12 96 94 99 4 96 n/a
Two or More Races 2010-11 96 91 >99% 4 44 52
2011-12 83 92 >99% 17 83 n/a
Female 2010-11 89 88 >99% 11 48 41
2011-12 92 89 >99% 8 92 n/a
Male 2010-11 89 88 >99% 11 43 47
2011-12 91 88 >99% 9 91 n/a
(Continued)
12. Questions regarding Part I of the NCLB Report Card should be directed to the Division of Performance Reporting. Contact us at (512)
463-9704 or performance.reporting@tea.state.tx.us.
Special formats ('*', >99%, <1%, 'n/a') are used in order to comply with the Family Educational Rights and Privacy Act (FERPA).
For grades 3-8, the 2011-12 assessment results are based on the State of Texas Assessments of Academic Readiness (STAAR) results at the
TAKS-equivalency standard that was developed using the STAAR Bridge Study, including required changes due to the transition to the
new assessment program. The 2010-11 assessment results are based on the Texas Assessment of Knowledge and Skills (TAKS) results at
the Met Standard level.
Student Achievement results are rounded to the nearest whole percent.
* Asian, Pacific Islander and Two or More Races are not available for indicators that use the former race/ethnicity definitions. See the
Texas NCLB Glossary for details.
Portions of the NCLB Report Card (Part I, Part II, etc. or prior year information) may not appear when data are not reported.
Texas 2012 NCLB Report Card 12
Part I - District Level: Student Performance for Each District Compared to the State, Percent of Students Tested,
Student Achievement by Proficiency Level, 2010-11, 2011-12*
February 1, 2013
For MCKINNEY ISD (043907)
Grade 4 Mathematics
District % of
Students
Met
Standard
(Proficient)
and
Commended
(Advanced)
State % of
Students
Met
Standard
(Proficient)
and
Commended
(Advanced)
%
Tested
(In
District)
Percent of Students in District at
Each Achievement Level
%
Not
Meeting
Standard
(Basic)
%
Met
Standard
(Proficient)
%
Commended
(Advanced)
Student Group Year
Special Education 2010-11 77 79 >99% 23 51 26
2011-12 86 80 >99% 14 86 n/a
Limited English Proficient 2010-11 75 83 >99% 25 50 24
2011-12 83 85 >99% 17 83 n/a
Economically Disadvantaged 2010-11 76 84 >99% 24 53 23
2011-12 82 85 >99% 18 82 n/a
Migrant 2010-11 * 80 * * * *
2011-12 * 82 * * * n/a
13. Questions regarding Part I of the NCLB Report Card should be directed to the Division of Performance Reporting. Contact us at (512)
463-9704 or performance.reporting@tea.state.tx.us.
Special formats ('*', >99%, <1%, 'n/a') are used in order to comply with the Family Educational Rights and Privacy Act (FERPA).
For grades 3-8, the 2011-12 assessment results are based on the State of Texas Assessments of Academic Readiness (STAAR) results at the
TAKS-equivalency standard that was developed using the STAAR Bridge Study, including required changes due to the transition to the
new assessment program. The 2010-11 assessment results are based on the Texas Assessment of Knowledge and Skills (TAKS) results at
the Met Standard level.
Student Achievement results are rounded to the nearest whole percent.
* Asian, Pacific Islander and Two or More Races are not available for indicators that use the former race/ethnicity definitions. See the
Texas NCLB Glossary for details.
Portions of the NCLB Report Card (Part I, Part II, etc. or prior year information) may not appear when data are not reported.
Texas 2012 NCLB Report Card 13
Part I - District Level: Student Performance for Each District Compared to the State, Percent of Students Tested,
Student Achievement by Proficiency Level, 2010-11, 2011-12*
February 1, 2013
For MCKINNEY ISD (043907)
Questions regarding Part I of the NCLB Report Card should be directed to the Division of Performance Reporting. Contact us at (512)
463-9704 or performance.reporting@tea.state.tx.us.
Special formats ('*', >99%, <1%, 'n/a') are used in order to comply with the Family Educational Rights and Privacy Act (FERPA).
For grades 3-8, the 2011-12 assessment results are based on the State of Texas Assessments of Academic Readiness (STAAR) results at the
TAKS-equivalency standard that was developed using the STAAR Bridge Study, including required changes due to the transition to the
new assessment program. The 2010-11 assessment results are based on the Texas Assessment of Knowledge and Skills (TAKS) results at
the Met Standard level.
Student Achievement results are rounded to the nearest whole percent.
* Asian, Pacific Islander and Two or More Races are not available for indicators that use the former race/ethnicity definitions. See the
Texas NCLB Glossary for details.
Portions of the NCLB Report Card (Part I, Part II, etc. or prior year information) may not appear when data are not reported.
Texas 2012 NCLB Report Card 13
Part I - District Level: Student Performance for Each District Compared to the State, Percent of Students Tested,
Student Achievement by Proficiency Level, 2010-11, 2011-12*
February 1, 2013
For MCKINNEY ISD (043907)
Grade 5 Reading
District % of
Students
Met
Standard
(Proficient)
and
Commended
(Advanced)
State % of
Students
Met
Standard
(Proficient)
and
Commended
(Advanced)
%
Tested
(In
District)
Percent of Students in District at
Each Achievement Level
%
Not
Meeting
Standard
(Basic)
%
Met
Standard
(Proficient)
%
Commended
(Advanced)
Student Group Year
All Students 2010-11 96 92 >99% 4 47 49
2011-12 93 87 99 7 93 n/a
American Indian/Alaskan
Native
2010-11
90 93 >99% 10 60 30
2011-12 83 87 >99% 17 83 n/a
Asian 2010-11 98 96 >99% 2 34 63
2011-12 98 95 98 2 98 n/a
Native Hawaiian/Pacific
Islander
2010-11
* 94 >99% * * *
2011-12 * 88 >99% * * n/a
African American 2010-11 93 90 >99% 7 55 38
2011-12 86 82 99 14 86 n/a
(Continued)
14. Questions regarding Part I of the NCLB Report Card should be directed to the Division of Performance Reporting. Contact us at (512)
463-9704 or performance.reporting@tea.state.tx.us.
Special formats ('*', >99%, <1%, 'n/a') are used in order to comply with the Family Educational Rights and Privacy Act (FERPA).
For grades 3-8, the 2011-12 assessment results are based on the State of Texas Assessments of Academic Readiness (STAAR) results at the
TAKS-equivalency standard that was developed using the STAAR Bridge Study, including required changes due to the transition to the
new assessment program. The 2010-11 assessment results are based on the Texas Assessment of Knowledge and Skills (TAKS) results at
the Met Standard level.
Student Achievement results are rounded to the nearest whole percent.
* Asian, Pacific Islander and Two or More Races are not available for indicators that use the former race/ethnicity definitions. See the
Texas NCLB Glossary for details.
Portions of the NCLB Report Card (Part I, Part II, etc. or prior year information) may not appear when data are not reported.
Texas 2012 NCLB Report Card 14
Part I - District Level: Student Performance for Each District Compared to the State, Percent of Students Tested,
Student Achievement by Proficiency Level, 2010-11, 2011-12*
February 1, 2013
For MCKINNEY ISD (043907)
Grade 5 Reading
District % of
Students
Met
Standard
(Proficient)
and
Commended
(Advanced)
State % of
Students
Met
Standard
(Proficient)
and
Commended
(Advanced)
%
Tested
(In
District)
Percent of Students in District at
Each Achievement Level
%
Not
Meeting
Standard
(Basic)
%
Met
Standard
(Proficient)
%
Commended
(Advanced)
Student Group Year
Hispanic 2010-11 89 90 >99% 11 62 28
2011-12 84 84 99 16 84 n/a
White 2010-11 99 97 >99% 1 40 59
2011-12 97 93 99 3 97 n/a
Two or More Races 2010-11 * 96 >99% * * *
2011-12 94 92 >99% 6 94 n/a
Female 2010-11 96 93 >99% 4 42 54
2011-12 94 89 99 6 94 n/a
Male 2010-11 95 91 >99% 5 51 44
2011-12 91 86 99 9 91 n/a
(Continued)
15. Questions regarding Part I of the NCLB Report Card should be directed to the Division of Performance Reporting. Contact us at (512)
463-9704 or performance.reporting@tea.state.tx.us.
Special formats ('*', >99%, <1%, 'n/a') are used in order to comply with the Family Educational Rights and Privacy Act (FERPA).
For grades 3-8, the 2011-12 assessment results are based on the State of Texas Assessments of Academic Readiness (STAAR) results at the
TAKS-equivalency standard that was developed using the STAAR Bridge Study, including required changes due to the transition to the
new assessment program. The 2010-11 assessment results are based on the Texas Assessment of Knowledge and Skills (TAKS) results at
the Met Standard level.
Student Achievement results are rounded to the nearest whole percent.
* Asian, Pacific Islander and Two or More Races are not available for indicators that use the former race/ethnicity definitions. See the
Texas NCLB Glossary for details.
Portions of the NCLB Report Card (Part I, Part II, etc. or prior year information) may not appear when data are not reported.
Texas 2012 NCLB Report Card 15
Part I - District Level: Student Performance for Each District Compared to the State, Percent of Students Tested,
Student Achievement by Proficiency Level, 2010-11, 2011-12*
February 1, 2013
For MCKINNEY ISD (043907)
Grade 5 Reading
District % of
Students
Met
Standard
(Proficient)
and
Commended
(Advanced)
State % of
Students
Met
Standard
(Proficient)
and
Commended
(Advanced)
%
Tested
(In
District)
Percent of Students in District at
Each Achievement Level
%
Not
Meeting
Standard
(Basic)
%
Met
Standard
(Proficient)
%
Commended
(Advanced)
Student Group Year
Special Education 2010-11 90 87 >99% 10 68 22
2011-12 91 78 99 9 91 n/a
Limited English Proficient 2010-11 74 79 >99% 26 64 10
2011-12 66 72 99 34 66 n/a
Economically Disadvantaged 2010-11 88 89 >99% 12 63 25
2011-12 82 83 99 18 82 n/a
Migrant 2010-11 * 82 * * * *
2011-12 * 76 * * * *
16. Questions regarding Part I of the NCLB Report Card should be directed to the Division of Performance Reporting. Contact us at (512)
463-9704 or performance.reporting@tea.state.tx.us.
Special formats ('*', >99%, <1%, 'n/a') are used in order to comply with the Family Educational Rights and Privacy Act (FERPA).
For grades 3-8, the 2011-12 assessment results are based on the State of Texas Assessments of Academic Readiness (STAAR) results at the
TAKS-equivalency standard that was developed using the STAAR Bridge Study, including required changes due to the transition to the
new assessment program. The 2010-11 assessment results are based on the Texas Assessment of Knowledge and Skills (TAKS) results at
the Met Standard level.
Student Achievement results are rounded to the nearest whole percent.
* Asian, Pacific Islander and Two or More Races are not available for indicators that use the former race/ethnicity definitions. See the
Texas NCLB Glossary for details.
Portions of the NCLB Report Card (Part I, Part II, etc. or prior year information) may not appear when data are not reported.
Texas 2012 NCLB Report Card 16
Part I - District Level: Student Performance for Each District Compared to the State, Percent of Students Tested,
Student Achievement by Proficiency Level, 2010-11, 2011-12*
February 1, 2013
For MCKINNEY ISD (043907)
Questions regarding Part I of the NCLB Report Card should be directed to the Division of Performance Reporting. Contact us at (512)
463-9704 or performance.reporting@tea.state.tx.us.
Special formats ('*', >99%, <1%, 'n/a') are used in order to comply with the Family Educational Rights and Privacy Act (FERPA).
For grades 3-8, the 2011-12 assessment results are based on the State of Texas Assessments of Academic Readiness (STAAR) results at the
TAKS-equivalency standard that was developed using the STAAR Bridge Study, including required changes due to the transition to the
new assessment program. The 2010-11 assessment results are based on the Texas Assessment of Knowledge and Skills (TAKS) results at
the Met Standard level.
Student Achievement results are rounded to the nearest whole percent.
* Asian, Pacific Islander and Two or More Races are not available for indicators that use the former race/ethnicity definitions. See the
Texas NCLB Glossary for details.
Portions of the NCLB Report Card (Part I, Part II, etc. or prior year information) may not appear when data are not reported.
Texas 2012 NCLB Report Card 16
Part I - District Level: Student Performance for Each District Compared to the State, Percent of Students Tested,
Student Achievement by Proficiency Level, 2010-11, 2011-12*
February 1, 2013
For MCKINNEY ISD (043907)
Grade 5 Mathematics
District % of
Students
Met
Standard
(Proficient)
and
Commended
(Advanced)
State % of
Students
Met
Standard
(Proficient)
and
Commended
(Advanced)
%
Tested
(In
District)
Percent of Students in District at
Each Achievement Level
%
Not
Meeting
Standard
(Basic)
%
Met
Standard
(Proficient)
%
Commended
(Advanced)
Student Group Year
All Students 2010-11 95 92 >99% 5 44 52
2011-12 91 86 >99% 9 91 n/a
American Indian/Alaskan
Native
2010-11
* 92 >99% * * *
2011-12 92 85 >99% 8 92 n/a
Asian 2010-11 * 96 >99% * * *
2011-12 * 96 98 * * n/a
Native Hawaiian/Pacific
Islander
2010-11
* 91 >99% * * *
2011-12 88 88 >99% 13 88 n/a
African American 2010-11 90 86 >99% 10 56 33
2011-12 80 78 >99% 20 80 n/a
(Continued)
17. Questions regarding Part I of the NCLB Report Card should be directed to the Division of Performance Reporting. Contact us at (512)
463-9704 or performance.reporting@tea.state.tx.us.
Special formats ('*', >99%, <1%, 'n/a') are used in order to comply with the Family Educational Rights and Privacy Act (FERPA).
For grades 3-8, the 2011-12 assessment results are based on the State of Texas Assessments of Academic Readiness (STAAR) results at the
TAKS-equivalency standard that was developed using the STAAR Bridge Study, including required changes due to the transition to the
new assessment program. The 2010-11 assessment results are based on the Texas Assessment of Knowledge and Skills (TAKS) results at
the Met Standard level.
Student Achievement results are rounded to the nearest whole percent.
* Asian, Pacific Islander and Two or More Races are not available for indicators that use the former race/ethnicity definitions. See the
Texas NCLB Glossary for details.
Portions of the NCLB Report Card (Part I, Part II, etc. or prior year information) may not appear when data are not reported.
Texas 2012 NCLB Report Card 17
Part I - District Level: Student Performance for Each District Compared to the State, Percent of Students Tested,
Student Achievement by Proficiency Level, 2010-11, 2011-12*
February 1, 2013
For MCKINNEY ISD (043907)
Grade 5 Mathematics
District % of
Students
Met
Standard
(Proficient)
and
Commended
(Advanced)
State % of
Students
Met
Standard
(Proficient)
and
Commended
(Advanced)
%
Tested
(In
District)
Percent of Students in District at
Each Achievement Level
%
Not
Meeting
Standard
(Basic)
%
Met
Standard
(Proficient)
%
Commended
(Advanced)
Student Group Year
Hispanic 2010-11 90 91 >99% 10 56 34
2011-12 82 84 >99% 18 82 n/a
White 2010-11 98 96 >99% 2 37 61
2011-12 96 92 >99% 4 96 n/a
Two or More Races 2010-11 95 94 >99% 5 40 55
2011-12 94 90 >99% 6 94 n/a
Female 2010-11 96 92 >99% 4 44 51
2011-12 91 87 >99% 9 91 n/a
Male 2010-11 95 92 >99% 5 43 52
2011-12 90 86 >99% 10 90 n/a
(Continued)
18. Questions regarding Part I of the NCLB Report Card should be directed to the Division of Performance Reporting. Contact us at (512)
463-9704 or performance.reporting@tea.state.tx.us.
Special formats ('*', >99%, <1%, 'n/a') are used in order to comply with the Family Educational Rights and Privacy Act (FERPA).
For grades 3-8, the 2011-12 assessment results are based on the State of Texas Assessments of Academic Readiness (STAAR) results at the
TAKS-equivalency standard that was developed using the STAAR Bridge Study, including required changes due to the transition to the
new assessment program. The 2010-11 assessment results are based on the Texas Assessment of Knowledge and Skills (TAKS) results at
the Met Standard level.
Student Achievement results are rounded to the nearest whole percent.
* Asian, Pacific Islander and Two or More Races are not available for indicators that use the former race/ethnicity definitions. See the
Texas NCLB Glossary for details.
Portions of the NCLB Report Card (Part I, Part II, etc. or prior year information) may not appear when data are not reported.
Texas 2012 NCLB Report Card 18
Part I - District Level: Student Performance for Each District Compared to the State, Percent of Students Tested,
Student Achievement by Proficiency Level, 2010-11, 2011-12*
February 1, 2013
For MCKINNEY ISD (043907)
Grade 5 Mathematics
District % of
Students
Met
Standard
(Proficient)
and
Commended
(Advanced)
State % of
Students
Met
Standard
(Proficient)
and
Commended
(Advanced)
%
Tested
(In
District)
Percent of Students in District at
Each Achievement Level
%
Not
Meeting
Standard
(Basic)
%
Met
Standard
(Proficient)
%
Commended
(Advanced)
Student Group Year
Special Education 2010-11 86 85 >99% 14 64 22
2011-12 84 74 99 16 84 n/a
Limited English Proficient 2010-11 78 84 99 22 66 13
2011-12 69 77 >99% 31 69 n/a
Economically Disadvantaged 2010-11 89 89 >99% 11 60 28
2011-12 80 82 >99% 20 80 n/a
Migrant 2010-11 * 85 * * * *
2011-12 * 78 * * * *
19. Questions regarding Part I of the NCLB Report Card should be directed to the Division of Performance Reporting. Contact us at (512)
463-9704 or performance.reporting@tea.state.tx.us.
Special formats ('*', >99%, <1%, 'n/a') are used in order to comply with the Family Educational Rights and Privacy Act (FERPA).
For grades 3-8, the 2011-12 assessment results are based on the State of Texas Assessments of Academic Readiness (STAAR) results at the
TAKS-equivalency standard that was developed using the STAAR Bridge Study, including required changes due to the transition to the
new assessment program. The 2010-11 assessment results are based on the Texas Assessment of Knowledge and Skills (TAKS) results at
the Met Standard level.
Student Achievement results are rounded to the nearest whole percent.
* Asian, Pacific Islander and Two or More Races are not available for indicators that use the former race/ethnicity definitions. See the
Texas NCLB Glossary for details.
Portions of the NCLB Report Card (Part I, Part II, etc. or prior year information) may not appear when data are not reported.
Texas 2012 NCLB Report Card 19
Part I - District Level: Student Performance for Each District Compared to the State, Percent of Students Tested,
Student Achievement by Proficiency Level, 2010-11, 2011-12*
February 1, 2013
For MCKINNEY ISD (043907)
Questions regarding Part I of the NCLB Report Card should be directed to the Division of Performance Reporting. Contact us at (512)
463-9704 or performance.reporting@tea.state.tx.us.
Special formats ('*', >99%, <1%, 'n/a') are used in order to comply with the Family Educational Rights and Privacy Act (FERPA).
For grades 3-8, the 2011-12 assessment results are based on the State of Texas Assessments of Academic Readiness (STAAR) results at the
TAKS-equivalency standard that was developed using the STAAR Bridge Study, including required changes due to the transition to the
new assessment program. The 2010-11 assessment results are based on the Texas Assessment of Knowledge and Skills (TAKS) results at
the Met Standard level.
Student Achievement results are rounded to the nearest whole percent.
* Asian, Pacific Islander and Two or More Races are not available for indicators that use the former race/ethnicity definitions. See the
Texas NCLB Glossary for details.
Portions of the NCLB Report Card (Part I, Part II, etc. or prior year information) may not appear when data are not reported.
Texas 2012 NCLB Report Card 19
Part I - District Level: Student Performance for Each District Compared to the State, Percent of Students Tested,
Student Achievement by Proficiency Level, 2010-11, 2011-12*
February 1, 2013
For MCKINNEY ISD (043907)
Grade 5 Science
District % of
Students
Met
Standard
(Proficient)
and
Commended
(Advanced)
State % of
Students
Met
Standard
(Proficient)
and
Commended
(Advanced)
%
Tested
(In
District)
Percent of Students in District at
Each Achievement Level
%
Not
Meeting
Standard
(Basic)
%
Met
Standard
(Proficient)
%
Commended
(Advanced)
Student Group Year
All Students 2010-11 92 86 99 8 33 58
2011-12 92 87 99 8 92 n/a
American Indian/Alaskan
Native
2010-11
* 86 >99% * * *
2011-12 * 87 >99% * * n/a
Asian 2010-11 95 93 99 5 26 69
2011-12 * 97 >99% * * n/a
Native Hawaiian/Pacific
Islander
2010-11
90 83 >99% 10 60 30
2011-12 * 87 >99% * * n/a
African American 2010-11 81 78 >99% 19 46 35
2011-12 79 79 >99% 21 79 n/a
(Continued)
20. Questions regarding Part I of the NCLB Report Card should be directed to the Division of Performance Reporting. Contact us at (512)
463-9704 or performance.reporting@tea.state.tx.us.
Special formats ('*', >99%, <1%, 'n/a') are used in order to comply with the Family Educational Rights and Privacy Act (FERPA).
For grades 3-8, the 2011-12 assessment results are based on the State of Texas Assessments of Academic Readiness (STAAR) results at the
TAKS-equivalency standard that was developed using the STAAR Bridge Study, including required changes due to the transition to the
new assessment program. The 2010-11 assessment results are based on the Texas Assessment of Knowledge and Skills (TAKS) results at
the Met Standard level.
Student Achievement results are rounded to the nearest whole percent.
* Asian, Pacific Islander and Two or More Races are not available for indicators that use the former race/ethnicity definitions. See the
Texas NCLB Glossary for details.
Portions of the NCLB Report Card (Part I, Part II, etc. or prior year information) may not appear when data are not reported.
Texas 2012 NCLB Report Card 20
Part I - District Level: Student Performance for Each District Compared to the State, Percent of Students Tested,
Student Achievement by Proficiency Level, 2010-11, 2011-12*
February 1, 2013
For MCKINNEY ISD (043907)
Grade 5 Science
District % of
Students
Met
Standard
(Proficient)
and
Commended
(Advanced)
State % of
Students
Met
Standard
(Proficient)
and
Commended
(Advanced)
%
Tested
(In
District)
Percent of Students in District at
Each Achievement Level
%
Not
Meeting
Standard
(Basic)
%
Met
Standard
(Proficient)
%
Commended
(Advanced)
Student Group Year
Hispanic 2010-11 84 82 99 16 43 40
2011-12 86 84 99 14 86 n/a
White 2010-11 96 93 99 4 27 70
2011-12 97 94 99 3 97 n/a
Two or More Races 2010-11 93 91 >99% 7 28 65
2011-12 94 92 >99% 6 94 n/a
Female 2010-11 92 84 99 8 37 54
2011-12 92 86 99 8 92 n/a
Male 2010-11 91 87 99 9 30 62
2011-12 93 88 99 7 93 n/a
(Continued)
21. Questions regarding Part I of the NCLB Report Card should be directed to the Division of Performance Reporting. Contact us at (512)
463-9704 or performance.reporting@tea.state.tx.us.
Special formats ('*', >99%, <1%, 'n/a') are used in order to comply with the Family Educational Rights and Privacy Act (FERPA).
For grades 3-8, the 2011-12 assessment results are based on the State of Texas Assessments of Academic Readiness (STAAR) results at the
TAKS-equivalency standard that was developed using the STAAR Bridge Study, including required changes due to the transition to the
new assessment program. The 2010-11 assessment results are based on the Texas Assessment of Knowledge and Skills (TAKS) results at
the Met Standard level.
Student Achievement results are rounded to the nearest whole percent.
* Asian, Pacific Islander and Two or More Races are not available for indicators that use the former race/ethnicity definitions. See the
Texas NCLB Glossary for details.
Portions of the NCLB Report Card (Part I, Part II, etc. or prior year information) may not appear when data are not reported.
Texas 2012 NCLB Report Card 21
Part I - District Level: Student Performance for Each District Compared to the State, Percent of Students Tested,
Student Achievement by Proficiency Level, 2010-11, 2011-12*
February 1, 2013
For MCKINNEY ISD (043907)
Grade 5 Science
District % of
Students
Met
Standard
(Proficient)
and
Commended
(Advanced)
State % of
Students
Met
Standard
(Proficient)
and
Commended
(Advanced)
%
Tested
(In
District)
Percent of Students in District at
Each Achievement Level
%
Not
Meeting
Standard
(Basic)
%
Met
Standard
(Proficient)
%
Commended
(Advanced)
Student Group Year
Special Education 2010-11 74 67 99 26 45 28
2011-12 76 69 99 24 76 n/a
Limited English Proficient 2010-11 62 68 99 38 46 16
2011-12 72 72 99 28 72 n/a
Economically Disadvantaged 2010-11 80 80 99 20 46 33
2011-12 82 82 99 18 82 n/a
Migrant 2010-11 * 74 * * * *
2011-12 * 76 * * * *
22. Questions regarding Part I of the NCLB Report Card should be directed to the Division of Performance Reporting. Contact us at (512)
463-9704 or performance.reporting@tea.state.tx.us.
Special formats ('*', >99%, <1%, 'n/a') are used in order to comply with the Family Educational Rights and Privacy Act (FERPA).
For grades 3-8, the 2011-12 assessment results are based on the State of Texas Assessments of Academic Readiness (STAAR) results at the
TAKS-equivalency standard that was developed using the STAAR Bridge Study, including required changes due to the transition to the
new assessment program. The 2010-11 assessment results are based on the Texas Assessment of Knowledge and Skills (TAKS) results at
the Met Standard level.
Student Achievement results are rounded to the nearest whole percent.
* Asian, Pacific Islander and Two or More Races are not available for indicators that use the former race/ethnicity definitions. See the
Texas NCLB Glossary for details.
Portions of the NCLB Report Card (Part I, Part II, etc. or prior year information) may not appear when data are not reported.
Texas 2012 NCLB Report Card 22
Part I - District Level: Student Performance for Each District Compared to the State, Percent of Students Tested,
Student Achievement by Proficiency Level, 2010-11, 2011-12*
February 1, 2013
For MCKINNEY ISD (043907)
Questions regarding Part I of the NCLB Report Card should be directed to the Division of Performance Reporting. Contact us at (512)
463-9704 or performance.reporting@tea.state.tx.us.
Special formats ('*', >99%, <1%, 'n/a') are used in order to comply with the Family Educational Rights and Privacy Act (FERPA).
For grades 3-8, the 2011-12 assessment results are based on the State of Texas Assessments of Academic Readiness (STAAR) results at the
TAKS-equivalency standard that was developed using the STAAR Bridge Study, including required changes due to the transition to the
new assessment program. The 2010-11 assessment results are based on the Texas Assessment of Knowledge and Skills (TAKS) results at
the Met Standard level.
Student Achievement results are rounded to the nearest whole percent.
* Asian, Pacific Islander and Two or More Races are not available for indicators that use the former race/ethnicity definitions. See the
Texas NCLB Glossary for details.
Portions of the NCLB Report Card (Part I, Part II, etc. or prior year information) may not appear when data are not reported.
Texas 2012 NCLB Report Card 22
Part I - District Level: Student Performance for Each District Compared to the State, Percent of Students Tested,
Student Achievement by Proficiency Level, 2010-11, 2011-12*
February 1, 2013
For MCKINNEY ISD (043907)
Grade 6 Reading
District % of
Students
Met
Standard
(Proficient)
and
Commended
(Advanced)
State % of
Students
Met
Standard
(Proficient)
and
Commended
(Advanced)
%
Tested
(In
District)
Percent of Students in District at
Each Achievement Level
%
Not
Meeting
Standard
(Basic)
%
Met
Standard
(Proficient)
%
Commended
(Advanced)
Student Group Year
All Students 2010-11 91 84 >99% 9 41 50
2011-12 92 86 >99% 8 92 n/a
American Indian/Alaskan
Native
2010-11
94 86 >99% 6 71 24
2011-12 * 86 >99% * * n/a
Asian 2010-11 94 93 >99% 6 38 56
2011-12 94 94 >99% 6 94 n/a
Native Hawaiian/Pacific
Islander
2010-11
83 85 >99% 17 58 25
2011-12 88 87 >99% 13 88 n/a
African American 2010-11 85 80 >99% 15 49 37
2011-12 86 82 99 14 86 n/a
(Continued)
23. Questions regarding Part I of the NCLB Report Card should be directed to the Division of Performance Reporting. Contact us at (512)
463-9704 or performance.reporting@tea.state.tx.us.
Special formats ('*', >99%, <1%, 'n/a') are used in order to comply with the Family Educational Rights and Privacy Act (FERPA).
For grades 3-8, the 2011-12 assessment results are based on the State of Texas Assessments of Academic Readiness (STAAR) results at the
TAKS-equivalency standard that was developed using the STAAR Bridge Study, including required changes due to the transition to the
new assessment program. The 2010-11 assessment results are based on the Texas Assessment of Knowledge and Skills (TAKS) results at
the Met Standard level.
Student Achievement results are rounded to the nearest whole percent.
* Asian, Pacific Islander and Two or More Races are not available for indicators that use the former race/ethnicity definitions. See the
Texas NCLB Glossary for details.
Portions of the NCLB Report Card (Part I, Part II, etc. or prior year information) may not appear when data are not reported.
Texas 2012 NCLB Report Card 23
Part I - District Level: Student Performance for Each District Compared to the State, Percent of Students Tested,
Student Achievement by Proficiency Level, 2010-11, 2011-12*
February 1, 2013
For MCKINNEY ISD (043907)
Grade 6 Reading
District % of
Students
Met
Standard
(Proficient)
and
Commended
(Advanced)
State % of
Students
Met
Standard
(Proficient)
and
Commended
(Advanced)
%
Tested
(In
District)
Percent of Students in District at
Each Achievement Level
%
Not
Meeting
Standard
(Basic)
%
Met
Standard
(Proficient)
%
Commended
(Advanced)
Student Group Year
Hispanic 2010-11 78 79 >99% 22 48 30
2011-12 85 82 >99% 15 85 n/a
White 2010-11 96 91 >99% 4 36 60
2011-12 96 93 >99% 4 96 n/a
Two or More Races 2010-11 * 89 >99% * * *
2011-12 95 92 >99% 5 95 n/a
Female 2010-11 93 87 >99% 7 37 56
2011-12 94 88 >99% 6 94 n/a
Male 2010-11 88 81 >99% 12 44 44
2011-12 90 84 >99% 10 90 n/a
(Continued)
24. Questions regarding Part I of the NCLB Report Card should be directed to the Division of Performance Reporting. Contact us at (512)
463-9704 or performance.reporting@tea.state.tx.us.
Special formats ('*', >99%, <1%, 'n/a') are used in order to comply with the Family Educational Rights and Privacy Act (FERPA).
For grades 3-8, the 2011-12 assessment results are based on the State of Texas Assessments of Academic Readiness (STAAR) results at the
TAKS-equivalency standard that was developed using the STAAR Bridge Study, including required changes due to the transition to the
new assessment program. The 2010-11 assessment results are based on the Texas Assessment of Knowledge and Skills (TAKS) results at
the Met Standard level.
Student Achievement results are rounded to the nearest whole percent.
* Asian, Pacific Islander and Two or More Races are not available for indicators that use the former race/ethnicity definitions. See the
Texas NCLB Glossary for details.
Portions of the NCLB Report Card (Part I, Part II, etc. or prior year information) may not appear when data are not reported.
Texas 2012 NCLB Report Card 24
Part I - District Level: Student Performance for Each District Compared to the State, Percent of Students Tested,
Student Achievement by Proficiency Level, 2010-11, 2011-12*
February 1, 2013
For MCKINNEY ISD (043907)
Grade 6 Reading
District % of
Students
Met
Standard
(Proficient)
and
Commended
(Advanced)
State % of
Students
Met
Standard
(Proficient)
and
Commended
(Advanced)
%
Tested
(In
District)
Percent of Students in District at
Each Achievement Level
%
Not
Meeting
Standard
(Basic)
%
Met
Standard
(Proficient)
%
Commended
(Advanced)
Student Group Year
Special Education 2010-11 71 69 >99% 29 56 15
2011-12 71 71 >99% 29 71 n/a
Limited English Proficient 2010-11 53 58 >99% 47 44 9
2011-12 61 61 >99% 39 61 n/a
Economically Disadvantaged 2010-11 75 78 >99% 25 48 27
2011-12 80 80 99 20 80 n/a
Migrant 2010-11 * 68 * * * *
2011-12 * 70 * * * n/a
25. Questions regarding Part I of the NCLB Report Card should be directed to the Division of Performance Reporting. Contact us at (512)
463-9704 or performance.reporting@tea.state.tx.us.
Special formats ('*', >99%, <1%, 'n/a') are used in order to comply with the Family Educational Rights and Privacy Act (FERPA).
For grades 3-8, the 2011-12 assessment results are based on the State of Texas Assessments of Academic Readiness (STAAR) results at the
TAKS-equivalency standard that was developed using the STAAR Bridge Study, including required changes due to the transition to the
new assessment program. The 2010-11 assessment results are based on the Texas Assessment of Knowledge and Skills (TAKS) results at
the Met Standard level.
Student Achievement results are rounded to the nearest whole percent.
* Asian, Pacific Islander and Two or More Races are not available for indicators that use the former race/ethnicity definitions. See the
Texas NCLB Glossary for details.
Portions of the NCLB Report Card (Part I, Part II, etc. or prior year information) may not appear when data are not reported.
Texas 2012 NCLB Report Card 25
Part I - District Level: Student Performance for Each District Compared to the State, Percent of Students Tested,
Student Achievement by Proficiency Level, 2010-11, 2011-12*
February 1, 2013
For MCKINNEY ISD (043907)
Questions regarding Part I of the NCLB Report Card should be directed to the Division of Performance Reporting. Contact us at (512)
463-9704 or performance.reporting@tea.state.tx.us.
Special formats ('*', >99%, <1%, 'n/a') are used in order to comply with the Family Educational Rights and Privacy Act (FERPA).
For grades 3-8, the 2011-12 assessment results are based on the State of Texas Assessments of Academic Readiness (STAAR) results at the
TAKS-equivalency standard that was developed using the STAAR Bridge Study, including required changes due to the transition to the
new assessment program. The 2010-11 assessment results are based on the Texas Assessment of Knowledge and Skills (TAKS) results at
the Met Standard level.
Student Achievement results are rounded to the nearest whole percent.
* Asian, Pacific Islander and Two or More Races are not available for indicators that use the former race/ethnicity definitions. See the
Texas NCLB Glossary for details.
Portions of the NCLB Report Card (Part I, Part II, etc. or prior year information) may not appear when data are not reported.
Texas 2012 NCLB Report Card 25
Part I - District Level: Student Performance for Each District Compared to the State, Percent of Students Tested,
Student Achievement by Proficiency Level, 2010-11, 2011-12*
February 1, 2013
For MCKINNEY ISD (043907)
Grade 6 Mathematics
District % of
Students
Met
Standard
(Proficient)
and
Commended
(Advanced)
State % of
Students
Met
Standard
(Proficient)
and
Commended
(Advanced)
%
Tested
(In
District)
Percent of Students in District at
Each Achievement Level
%
Not
Meeting
Standard
(Basic)
%
Met
Standard
(Proficient)
%
Commended
(Advanced)
Student Group Year
All Students 2010-11 92 82 >99% 8 41 50
2011-12 83 82 >99% 17 83 n/a
American Indian/Alaskan
Native
2010-11
76 84 >99% 24 53 24
2011-12 * 83 >99% * * n/a
Asian 2010-11 99 95 >99% 1 31 67
2011-12 * 95 >99% * * n/a
Native Hawaiian/Pacific
Islander
2010-11
92 84 >99% 8 42 50
2011-12 * 85 * * * n/a
African American 2010-11 82 73 >99% 18 52 30
2011-12 76 72 >99% 24 76 n/a
(Continued)
26. Questions regarding Part I of the NCLB Report Card should be directed to the Division of Performance Reporting. Contact us at (512)
463-9704 or performance.reporting@tea.state.tx.us.
Special formats ('*', >99%, <1%, 'n/a') are used in order to comply with the Family Educational Rights and Privacy Act (FERPA).
For grades 3-8, the 2011-12 assessment results are based on the State of Texas Assessments of Academic Readiness (STAAR) results at the
TAKS-equivalency standard that was developed using the STAAR Bridge Study, including required changes due to the transition to the
new assessment program. The 2010-11 assessment results are based on the Texas Assessment of Knowledge and Skills (TAKS) results at
the Met Standard level.
Student Achievement results are rounded to the nearest whole percent.
* Asian, Pacific Islander and Two or More Races are not available for indicators that use the former race/ethnicity definitions. See the
Texas NCLB Glossary for details.
Portions of the NCLB Report Card (Part I, Part II, etc. or prior year information) may not appear when data are not reported.
Texas 2012 NCLB Report Card 26
Part I - District Level: Student Performance for Each District Compared to the State, Percent of Students Tested,
Student Achievement by Proficiency Level, 2010-11, 2011-12*
February 1, 2013
For MCKINNEY ISD (043907)
Grade 6 Mathematics
District % of
Students
Met
Standard
(Proficient)
and
Commended
(Advanced)
State % of
Students
Met
Standard
(Proficient)
and
Commended
(Advanced)
%
Tested
(In
District)
Percent of Students in District at
Each Achievement Level
%
Not
Meeting
Standard
(Basic)
%
Met
Standard
(Proficient)
%
Commended
(Advanced)
Student Group Year
Hispanic 2010-11 85 79 >99% 15 53 32
2011-12 80 79 >99% 20 80 n/a
White 2010-11 96 89 >99% 4 35 61
2011-12 87 90 >99% 13 87 n/a
Two or More Races 2010-11 * 87 >99% * * *
2011-12 89 87 >99% 11 89 n/a
Female 2010-11 92 83 >99% 8 40 52
2011-12 85 83 >99% 15 85 n/a
Male 2010-11 92 81 >99% 8 43 49
2011-12 81 82 >99% 19 81 n/a
(Continued)
27. Questions regarding Part I of the NCLB Report Card should be directed to the Division of Performance Reporting. Contact us at (512)
463-9704 or performance.reporting@tea.state.tx.us.
Special formats ('*', >99%, <1%, 'n/a') are used in order to comply with the Family Educational Rights and Privacy Act (FERPA).
For grades 3-8, the 2011-12 assessment results are based on the State of Texas Assessments of Academic Readiness (STAAR) results at the
TAKS-equivalency standard that was developed using the STAAR Bridge Study, including required changes due to the transition to the
new assessment program. The 2010-11 assessment results are based on the Texas Assessment of Knowledge and Skills (TAKS) results at
the Met Standard level.
Student Achievement results are rounded to the nearest whole percent.
* Asian, Pacific Islander and Two or More Races are not available for indicators that use the former race/ethnicity definitions. See the
Texas NCLB Glossary for details.
Portions of the NCLB Report Card (Part I, Part II, etc. or prior year information) may not appear when data are not reported.
Texas 2012 NCLB Report Card 27
Part I - District Level: Student Performance for Each District Compared to the State, Percent of Students Tested,
Student Achievement by Proficiency Level, 2010-11, 2011-12*
February 1, 2013
For MCKINNEY ISD (043907)
Grade 6 Mathematics
District % of
Students
Met
Standard
(Proficient)
and
Commended
(Advanced)
State % of
Students
Met
Standard
(Proficient)
and
Commended
(Advanced)
%
Tested
(In
District)
Percent of Students in District at
Each Achievement Level
%
Not
Meeting
Standard
(Basic)
%
Met
Standard
(Proficient)
%
Commended
(Advanced)
Student Group Year
Special Education 2010-11 72 65 >99% 28 55 18
2011-12 71 66 >99% 29 71 n/a
Limited English Proficient 2010-11 72 67 >99% 28 60 12
2011-12 69 67 >99% 31 69 n/a
Economically Disadvantaged 2010-11 81 77 >99% 19 57 24
2011-12 76 77 >99% 24 76 n/a
Migrant 2010-11 * 72 * * * *
2011-12 * 70 * * * n/a
28. Questions regarding Part I of the NCLB Report Card should be directed to the Division of Performance Reporting. Contact us at (512)
463-9704 or performance.reporting@tea.state.tx.us.
Special formats ('*', >99%, <1%, 'n/a') are used in order to comply with the Family Educational Rights and Privacy Act (FERPA).
For grades 3-8, the 2011-12 assessment results are based on the State of Texas Assessments of Academic Readiness (STAAR) results at the
TAKS-equivalency standard that was developed using the STAAR Bridge Study, including required changes due to the transition to the
new assessment program. The 2010-11 assessment results are based on the Texas Assessment of Knowledge and Skills (TAKS) results at
the Met Standard level.
Student Achievement results are rounded to the nearest whole percent.
* Asian, Pacific Islander and Two or More Races are not available for indicators that use the former race/ethnicity definitions. See the
Texas NCLB Glossary for details.
Portions of the NCLB Report Card (Part I, Part II, etc. or prior year information) may not appear when data are not reported.
Texas 2012 NCLB Report Card 28
Part I - District Level: Student Performance for Each District Compared to the State, Percent of Students Tested,
Student Achievement by Proficiency Level, 2010-11, 2011-12*
February 1, 2013
For MCKINNEY ISD (043907)
Questions regarding Part I of the NCLB Report Card should be directed to the Division of Performance Reporting. Contact us at (512)
463-9704 or performance.reporting@tea.state.tx.us.
Special formats ('*', >99%, <1%, 'n/a') are used in order to comply with the Family Educational Rights and Privacy Act (FERPA).
For grades 3-8, the 2011-12 assessment results are based on the State of Texas Assessments of Academic Readiness (STAAR) results at the
TAKS-equivalency standard that was developed using the STAAR Bridge Study, including required changes due to the transition to the
new assessment program. The 2010-11 assessment results are based on the Texas Assessment of Knowledge and Skills (TAKS) results at
the Met Standard level.
Student Achievement results are rounded to the nearest whole percent.
* Asian, Pacific Islander and Two or More Races are not available for indicators that use the former race/ethnicity definitions. See the
Texas NCLB Glossary for details.
Portions of the NCLB Report Card (Part I, Part II, etc. or prior year information) may not appear when data are not reported.
Texas 2012 NCLB Report Card 28
Part I - District Level: Student Performance for Each District Compared to the State, Percent of Students Tested,
Student Achievement by Proficiency Level, 2010-11, 2011-12*
February 1, 2013
For MCKINNEY ISD (043907)
Grade 7 Reading
District % of
Students
Met
Standard
(Proficient)
and
Commended
(Advanced)
State % of
Students
Met
Standard
(Proficient)
and
Commended
(Advanced)
%
Tested
(In
District)
Percent of Students in District at
Each Achievement Level
%
Not
Meeting
Standard
(Basic)
%
Met
Standard
(Proficient)
%
Commended
(Advanced)
Student Group Year
All Students 2010-11 91 85 99 9 44 47
2011-12 95 88 >99% 5 95 n/a
American Indian/Alaskan
Native
2010-11
88 86 >99% 13 25 63
2011-12 89 91 91 11 89 n/a
Asian 2010-11 96 93 >99% 4 41 56
2011-12 95 94 99 5 95 n/a
Native Hawaiian/Pacific
Islander
2010-11
89 85 >99% 11 67 22
2011-12 92 87 >99% 8 92 n/a
African American 2010-11 82 80 >99% 18 60 22
2011-12 92 84 >99% 8 92 n/a
(Continued)
29. Questions regarding Part I of the NCLB Report Card should be directed to the Division of Performance Reporting. Contact us at (512)
463-9704 or performance.reporting@tea.state.tx.us.
Special formats ('*', >99%, <1%, 'n/a') are used in order to comply with the Family Educational Rights and Privacy Act (FERPA).
For grades 3-8, the 2011-12 assessment results are based on the State of Texas Assessments of Academic Readiness (STAAR) results at the
TAKS-equivalency standard that was developed using the STAAR Bridge Study, including required changes due to the transition to the
new assessment program. The 2010-11 assessment results are based on the Texas Assessment of Knowledge and Skills (TAKS) results at
the Met Standard level.
Student Achievement results are rounded to the nearest whole percent.
* Asian, Pacific Islander and Two or More Races are not available for indicators that use the former race/ethnicity definitions. See the
Texas NCLB Glossary for details.
Portions of the NCLB Report Card (Part I, Part II, etc. or prior year information) may not appear when data are not reported.
Texas 2012 NCLB Report Card 29
Part I - District Level: Student Performance for Each District Compared to the State, Percent of Students Tested,
Student Achievement by Proficiency Level, 2010-11, 2011-12*
February 1, 2013
For MCKINNEY ISD (043907)
Grade 7 Reading
District % of
Students
Met
Standard
(Proficient)
and
Commended
(Advanced)
State % of
Students
Met
Standard
(Proficient)
and
Commended
(Advanced)
%
Tested
(In
District)
Percent of Students in District at
Each Achievement Level
%
Not
Meeting
Standard
(Basic)
%
Met
Standard
(Proficient)
%
Commended
(Advanced)
Student Group Year
Hispanic 2010-11 82 81 >99% 18 53 29
2011-12 89 84 >99% 11 89 n/a
White 2010-11 97 93 99 3 38 59
2011-12 98 93 >99% 2 98 n/a
Two or More Races 2010-11 98 91 >99% 2 37 61
2011-12 98 93 >99% 2 98 n/a
Female 2010-11 93 87 99 7 42 50
2011-12 97 91 >99% 3 97 n/a
Male 2010-11 90 84 >99% 10 46 45
2011-12 93 85 99 7 93 n/a
(Continued)
30. Questions regarding Part I of the NCLB Report Card should be directed to the Division of Performance Reporting. Contact us at (512)
463-9704 or performance.reporting@tea.state.tx.us.
Special formats ('*', >99%, <1%, 'n/a') are used in order to comply with the Family Educational Rights and Privacy Act (FERPA).
For grades 3-8, the 2011-12 assessment results are based on the State of Texas Assessments of Academic Readiness (STAAR) results at the
TAKS-equivalency standard that was developed using the STAAR Bridge Study, including required changes due to the transition to the
new assessment program. The 2010-11 assessment results are based on the Texas Assessment of Knowledge and Skills (TAKS) results at
the Met Standard level.
Student Achievement results are rounded to the nearest whole percent.
* Asian, Pacific Islander and Two or More Races are not available for indicators that use the former race/ethnicity definitions. See the
Texas NCLB Glossary for details.
Portions of the NCLB Report Card (Part I, Part II, etc. or prior year information) may not appear when data are not reported.
Texas 2012 NCLB Report Card 30
Part I - District Level: Student Performance for Each District Compared to the State, Percent of Students Tested,
Student Achievement by Proficiency Level, 2010-11, 2011-12*
February 1, 2013
For MCKINNEY ISD (043907)
Grade 7 Reading
District % of
Students
Met
Standard
(Proficient)
and
Commended
(Advanced)
State % of
Students
Met
Standard
(Proficient)
and
Commended
(Advanced)
%
Tested
(In
District)
Percent of Students in District at
Each Achievement Level
%
Not
Meeting
Standard
(Basic)
%
Met
Standard
(Proficient)
%
Commended
(Advanced)
Student Group Year
Special Education 2010-11 71 70 >99% 29 60 11
2011-12 77 71 99 23 77 n/a
Limited English Proficient 2010-11 55 55 99 45 50 5
2011-12 69 62 >99% 31 69 n/a
Economically Disadvantaged 2010-11 78 80 99 22 55 23
2011-12 85 83 99 15 85 n/a
Migrant 2010-11 * 68 * * * *
2011-12 * 73 * * * *
31. Questions regarding Part I of the NCLB Report Card should be directed to the Division of Performance Reporting. Contact us at (512)
463-9704 or performance.reporting@tea.state.tx.us.
Special formats ('*', >99%, <1%, 'n/a') are used in order to comply with the Family Educational Rights and Privacy Act (FERPA).
For grades 3-8, the 2011-12 assessment results are based on the State of Texas Assessments of Academic Readiness (STAAR) results at the
TAKS-equivalency standard that was developed using the STAAR Bridge Study, including required changes due to the transition to the
new assessment program. The 2010-11 assessment results are based on the Texas Assessment of Knowledge and Skills (TAKS) results at
the Met Standard level.
Student Achievement results are rounded to the nearest whole percent.
* Asian, Pacific Islander and Two or More Races are not available for indicators that use the former race/ethnicity definitions. See the
Texas NCLB Glossary for details.
Portions of the NCLB Report Card (Part I, Part II, etc. or prior year information) may not appear when data are not reported.
Texas 2012 NCLB Report Card 31
Part I - District Level: Student Performance for Each District Compared to the State, Percent of Students Tested,
Student Achievement by Proficiency Level, 2010-11, 2011-12*
February 1, 2013
For MCKINNEY ISD (043907)
Questions regarding Part I of the NCLB Report Card should be directed to the Division of Performance Reporting. Contact us at (512)
463-9704 or performance.reporting@tea.state.tx.us.
Special formats ('*', >99%, <1%, 'n/a') are used in order to comply with the Family Educational Rights and Privacy Act (FERPA).
For grades 3-8, the 2011-12 assessment results are based on the State of Texas Assessments of Academic Readiness (STAAR) results at the
TAKS-equivalency standard that was developed using the STAAR Bridge Study, including required changes due to the transition to the
new assessment program. The 2010-11 assessment results are based on the Texas Assessment of Knowledge and Skills (TAKS) results at
the Met Standard level.
Student Achievement results are rounded to the nearest whole percent.
* Asian, Pacific Islander and Two or More Races are not available for indicators that use the former race/ethnicity definitions. See the
Texas NCLB Glossary for details.
Portions of the NCLB Report Card (Part I, Part II, etc. or prior year information) may not appear when data are not reported.
Texas 2012 NCLB Report Card 31
Part I - District Level: Student Performance for Each District Compared to the State, Percent of Students Tested,
Student Achievement by Proficiency Level, 2010-11, 2011-12*
February 1, 2013
For MCKINNEY ISD (043907)
Grade 7 Mathematics
District % of
Students
Met
Standard
(Proficient)
and
Commended
(Advanced)
State % of
Students
Met
Standard
(Proficient)
and
Commended
(Advanced)
%
Tested
(In
District)
Percent of Students in District at
Each Achievement Level
%
Not
Meeting
Standard
(Basic)
%
Met
Standard
(Proficient)
%
Commended
(Advanced)
Student Group Year
All Students 2010-11 90 80 >99% 10 50 40
2011-12 94 83 >99% 6 94 n/a
American Indian/Alaskan
Native
2010-11
88 80 >99% 13 25 63
2011-12 89 85 >99% 11 89 n/a
Asian 2010-11 98 94 >99% 2 44 54
2011-12 97 95 >99% 3 97 n/a
Native Hawaiian/Pacific
Islander
2010-11
67 83 >99% 33 33 33
2011-12 78 86 >99% 22 78 n/a
African American 2010-11 79 69 >99% 21 61 17
2011-12 90 73 99 10 90 n/a
(Continued)
32. Questions regarding Part I of the NCLB Report Card should be directed to the Division of Performance Reporting. Contact us at (512)
463-9704 or performance.reporting@tea.state.tx.us.
Special formats ('*', >99%, <1%, 'n/a') are used in order to comply with the Family Educational Rights and Privacy Act (FERPA).
For grades 3-8, the 2011-12 assessment results are based on the State of Texas Assessments of Academic Readiness (STAAR) results at the
TAKS-equivalency standard that was developed using the STAAR Bridge Study, including required changes due to the transition to the
new assessment program. The 2010-11 assessment results are based on the Texas Assessment of Knowledge and Skills (TAKS) results at
the Met Standard level.
Student Achievement results are rounded to the nearest whole percent.
* Asian, Pacific Islander and Two or More Races are not available for indicators that use the former race/ethnicity definitions. See the
Texas NCLB Glossary for details.
Portions of the NCLB Report Card (Part I, Part II, etc. or prior year information) may not appear when data are not reported.
Texas 2012 NCLB Report Card 32
Part I - District Level: Student Performance for Each District Compared to the State, Percent of Students Tested,
Student Achievement by Proficiency Level, 2010-11, 2011-12*
February 1, 2013
For MCKINNEY ISD (043907)
Grade 7 Mathematics
District % of
Students
Met
Standard
(Proficient)
and
Commended
(Advanced)
State % of
Students
Met
Standard
(Proficient)
and
Commended
(Advanced)
%
Tested
(In
District)
Percent of Students in District at
Each Achievement Level
%
Not
Meeting
Standard
(Basic)
%
Met
Standard
(Proficient)
%
Commended
(Advanced)
Student Group Year
Hispanic 2010-11 80 77 >99% 20 57 23
2011-12 88 80 >99% 12 88 n/a
White 2010-11 96 89 >99% 4 45 50
2011-12 97 91 >99% 3 97 n/a
Two or More Races 2010-11 95 86 >99% 5 51 44
2011-12 96 89 >99% 4 96 n/a
Female 2010-11 91 80 >99% 9 47 43
2011-12 94 84 >99% 6 94 n/a
Male 2010-11 89 80 >99% 11 53 37
2011-12 94 82 >99% 6 94 n/a
(Continued)
33. Questions regarding Part I of the NCLB Report Card should be directed to the Division of Performance Reporting. Contact us at (512)
463-9704 or performance.reporting@tea.state.tx.us.
Special formats ('*', >99%, <1%, 'n/a') are used in order to comply with the Family Educational Rights and Privacy Act (FERPA).
For grades 3-8, the 2011-12 assessment results are based on the State of Texas Assessments of Academic Readiness (STAAR) results at the
TAKS-equivalency standard that was developed using the STAAR Bridge Study, including required changes due to the transition to the
new assessment program. The 2010-11 assessment results are based on the Texas Assessment of Knowledge and Skills (TAKS) results at
the Met Standard level.
Student Achievement results are rounded to the nearest whole percent.
* Asian, Pacific Islander and Two or More Races are not available for indicators that use the former race/ethnicity definitions. See the
Texas NCLB Glossary for details.
Portions of the NCLB Report Card (Part I, Part II, etc. or prior year information) may not appear when data are not reported.
Texas 2012 NCLB Report Card 33
Part I - District Level: Student Performance for Each District Compared to the State, Percent of Students Tested,
Student Achievement by Proficiency Level, 2010-11, 2011-12*
February 1, 2013
For MCKINNEY ISD (043907)
Grade 7 Mathematics
District % of
Students
Met
Standard
(Proficient)
and
Commended
(Advanced)
State % of
Students
Met
Standard
(Proficient)
and
Commended
(Advanced)
%
Tested
(In
District)
Percent of Students in District at
Each Achievement Level
%
Not
Meeting
Standard
(Basic)
%
Met
Standard
(Proficient)
%
Commended
(Advanced)
Student Group Year
Special Education 2010-11 72 65 >99% 28 60 12
2011-12 82 68 >99% 18 82 n/a
Limited English Proficient 2010-11 63 60 >99% 38 55 8
2011-12 72 64 99 28 72 n/a
Economically Disadvantaged 2010-11 77 74 >99% 23 58 19
2011-12 86 77 99 14 86 n/a
Migrant 2010-11 * 67 * * * *
2011-12 * 71 * * * *
34. Questions regarding Part I of the NCLB Report Card should be directed to the Division of Performance Reporting. Contact us at (512)
463-9704 or performance.reporting@tea.state.tx.us.
Special formats ('*', >99%, <1%, 'n/a') are used in order to comply with the Family Educational Rights and Privacy Act (FERPA).
For grades 3-8, the 2011-12 assessment results are based on the State of Texas Assessments of Academic Readiness (STAAR) results at the
TAKS-equivalency standard that was developed using the STAAR Bridge Study, including required changes due to the transition to the
new assessment program. The 2010-11 assessment results are based on the Texas Assessment of Knowledge and Skills (TAKS) results at
the Met Standard level.
Student Achievement results are rounded to the nearest whole percent.
* Asian, Pacific Islander and Two or More Races are not available for indicators that use the former race/ethnicity definitions. See the
Texas NCLB Glossary for details.
Portions of the NCLB Report Card (Part I, Part II, etc. or prior year information) may not appear when data are not reported.
Texas 2012 NCLB Report Card 34
Part I - District Level: Student Performance for Each District Compared to the State, Percent of Students Tested,
Student Achievement by Proficiency Level, 2010-11, 2011-12*
February 1, 2013
For MCKINNEY ISD (043907)
Questions regarding Part I of the NCLB Report Card should be directed to the Division of Performance Reporting. Contact us at (512)
463-9704 or performance.reporting@tea.state.tx.us.
Special formats ('*', >99%, <1%, 'n/a') are used in order to comply with the Family Educational Rights and Privacy Act (FERPA).
For grades 3-8, the 2011-12 assessment results are based on the State of Texas Assessments of Academic Readiness (STAAR) results at the
TAKS-equivalency standard that was developed using the STAAR Bridge Study, including required changes due to the transition to the
new assessment program. The 2010-11 assessment results are based on the Texas Assessment of Knowledge and Skills (TAKS) results at
the Met Standard level.
Student Achievement results are rounded to the nearest whole percent.
* Asian, Pacific Islander and Two or More Races are not available for indicators that use the former race/ethnicity definitions. See the
Texas NCLB Glossary for details.
Portions of the NCLB Report Card (Part I, Part II, etc. or prior year information) may not appear when data are not reported.
Texas 2012 NCLB Report Card 34
Part I - District Level: Student Performance for Each District Compared to the State, Percent of Students Tested,
Student Achievement by Proficiency Level, 2010-11, 2011-12*
February 1, 2013
For MCKINNEY ISD (043907)
Grade 8 Reading
District % of
Students
Met
Standard
(Proficient)
and
Commended
(Advanced)
State % of
Students
Met
Standard
(Proficient)
and
Commended
(Advanced)
%
Tested
(In
District)
Percent of Students in District at
Each Achievement Level
%
Not
Meeting
Standard
(Basic)
%
Met
Standard
(Proficient)
%
Commended
(Advanced)
Student Group Year
All Students 2010-11 97 93 >99% 3 37 61
2011-12 95 89 99 5 95 n/a
American Indian/Alaskan
Native
2010-11
* 94 >99% * * *
2011-12 * 90 >99% * * n/a
Asian 2010-11 98 96 >99% 2 26 72
2011-12 98 94 >99% 2 98 n/a
Native Hawaiian/Pacific
Islander
2010-11
* 92 * * * *
2011-12 * 91 >99% * * n/a
African American 2010-11 95 91 >99% 5 55 40
2011-12 89 86 >99% 11 89 n/a
(Continued)
35. Questions regarding Part I of the NCLB Report Card should be directed to the Division of Performance Reporting. Contact us at (512)
463-9704 or performance.reporting@tea.state.tx.us.
Special formats ('*', >99%, <1%, 'n/a') are used in order to comply with the Family Educational Rights and Privacy Act (FERPA).
For grades 3-8, the 2011-12 assessment results are based on the State of Texas Assessments of Academic Readiness (STAAR) results at the
TAKS-equivalency standard that was developed using the STAAR Bridge Study, including required changes due to the transition to the
new assessment program. The 2010-11 assessment results are based on the Texas Assessment of Knowledge and Skills (TAKS) results at
the Met Standard level.
Student Achievement results are rounded to the nearest whole percent.
* Asian, Pacific Islander and Two or More Races are not available for indicators that use the former race/ethnicity definitions. See the
Texas NCLB Glossary for details.
Portions of the NCLB Report Card (Part I, Part II, etc. or prior year information) may not appear when data are not reported.
Texas 2012 NCLB Report Card 35
Part I - District Level: Student Performance for Each District Compared to the State, Percent of Students Tested,
Student Achievement by Proficiency Level, 2010-11, 2011-12*
February 1, 2013
For MCKINNEY ISD (043907)
Grade 8 Reading
District % of
Students
Met
Standard
(Proficient)
and
Commended
(Advanced)
State % of
Students
Met
Standard
(Proficient)
and
Commended
(Advanced)
%
Tested
(In
District)
Percent of Students in District at
Each Achievement Level
%
Not
Meeting
Standard
(Basic)
%
Met
Standard
(Proficient)
%
Commended
(Advanced)
Student Group Year
Hispanic 2010-11 94 91 >99% 6 50 44
2011-12 90 86 99 10 90 n/a
White 2010-11 99 97 >99% 1 27 72
2011-12 99 95 98 1 99 n/a
Two or More Races 2010-11 98 97 >99% 2 51 47
2011-12 98 94 >99% 2 98 n/a
Female 2010-11 99 95 >99% 1 32 66
2011-12 96 91 99 4 96 n/a
Male 2010-11 96 92 >99% 4 41 55
2011-12 95 88 99 5 95 n/a
(Continued)
36. Questions regarding Part I of the NCLB Report Card should be directed to the Division of Performance Reporting. Contact us at (512)
463-9704 or performance.reporting@tea.state.tx.us.
Special formats ('*', >99%, <1%, 'n/a') are used in order to comply with the Family Educational Rights and Privacy Act (FERPA).
For grades 3-8, the 2011-12 assessment results are based on the State of Texas Assessments of Academic Readiness (STAAR) results at the
TAKS-equivalency standard that was developed using the STAAR Bridge Study, including required changes due to the transition to the
new assessment program. The 2010-11 assessment results are based on the Texas Assessment of Knowledge and Skills (TAKS) results at
the Met Standard level.
Student Achievement results are rounded to the nearest whole percent.
* Asian, Pacific Islander and Two or More Races are not available for indicators that use the former race/ethnicity definitions. See the
Texas NCLB Glossary for details.
Portions of the NCLB Report Card (Part I, Part II, etc. or prior year information) may not appear when data are not reported.
Texas 2012 NCLB Report Card 36
Part I - District Level: Student Performance for Each District Compared to the State, Percent of Students Tested,
Student Achievement by Proficiency Level, 2010-11, 2011-12*
February 1, 2013
For MCKINNEY ISD (043907)
Grade 8 Reading
District % of
Students
Met
Standard
(Proficient)
and
Commended
(Advanced)
State % of
Students
Met
Standard
(Proficient)
and
Commended
(Advanced)
%
Tested
(In
District)
Percent of Students in District at
Each Achievement Level
%
Not
Meeting
Standard
(Basic)
%
Met
Standard
(Proficient)
%
Commended
(Advanced)
Student Group Year
Special Education 2010-11 89 83 >99% 11 73 16
2011-12 82 72 99 18 82 n/a
Limited English Proficient 2010-11 70 66 98 30 66 4
2011-12 57 57 >99% 43 57 n/a
Economically Disadvantaged 2010-11 93 90 >99% 7 54 39
2011-12 88 85 99 12 88 n/a
Migrant 2010-11 * 82 * * * *
2011-12 * 76 * * * n/a
37. Questions regarding Part I of the NCLB Report Card should be directed to the Division of Performance Reporting. Contact us at (512)
463-9704 or performance.reporting@tea.state.tx.us.
Special formats ('*', >99%, <1%, 'n/a') are used in order to comply with the Family Educational Rights and Privacy Act (FERPA).
For grades 3-8, the 2011-12 assessment results are based on the State of Texas Assessments of Academic Readiness (STAAR) results at the
TAKS-equivalency standard that was developed using the STAAR Bridge Study, including required changes due to the transition to the
new assessment program. The 2010-11 assessment results are based on the Texas Assessment of Knowledge and Skills (TAKS) results at
the Met Standard level.
Student Achievement results are rounded to the nearest whole percent.
* Asian, Pacific Islander and Two or More Races are not available for indicators that use the former race/ethnicity definitions. See the
Texas NCLB Glossary for details.
Portions of the NCLB Report Card (Part I, Part II, etc. or prior year information) may not appear when data are not reported.
Texas 2012 NCLB Report Card 37
Part I - District Level: Student Performance for Each District Compared to the State, Percent of Students Tested,
Student Achievement by Proficiency Level, 2010-11, 2011-12*
February 1, 2013
For MCKINNEY ISD (043907)
Questions regarding Part I of the NCLB Report Card should be directed to the Division of Performance Reporting. Contact us at (512)
463-9704 or performance.reporting@tea.state.tx.us.
Special formats ('*', >99%, <1%, 'n/a') are used in order to comply with the Family Educational Rights and Privacy Act (FERPA).
For grades 3-8, the 2011-12 assessment results are based on the State of Texas Assessments of Academic Readiness (STAAR) results at the
TAKS-equivalency standard that was developed using the STAAR Bridge Study, including required changes due to the transition to the
new assessment program. The 2010-11 assessment results are based on the Texas Assessment of Knowledge and Skills (TAKS) results at
the Met Standard level.
Student Achievement results are rounded to the nearest whole percent.
* Asian, Pacific Islander and Two or More Races are not available for indicators that use the former race/ethnicity definitions. See the
Texas NCLB Glossary for details.
Portions of the NCLB Report Card (Part I, Part II, etc. or prior year information) may not appear when data are not reported.
Texas 2012 NCLB Report Card 37
Part I - District Level: Student Performance for Each District Compared to the State, Percent of Students Tested,
Student Achievement by Proficiency Level, 2010-11, 2011-12*
February 1, 2013
For MCKINNEY ISD (043907)
Grade 8 Mathematics
District % of
Students
Met
Standard
(Proficient)
and
Commended
(Advanced)
State % of
Students
Met
Standard
(Proficient)
and
Commended
(Advanced)
%
Tested
(In
District)
Percent of Students in District at
Each Achievement Level
%
Not
Meeting
Standard
(Basic)
%
Met
Standard
(Proficient)
%
Commended
(Advanced)
Student Group Year
All Students 2010-11 94 87 >99% 6 62 32
2011-12 93 81 >99% 7 93 n/a
American Indian/Alaskan
Native
2010-11
95 85 >99% 5 74 21
2011-12 * 82 >99% * * n/a
Asian 2010-11 96 96 >99% 4 32 64
2011-12 98 95 >99% 2 98 n/a
Native Hawaiian/Pacific
Islander
2010-11
* 89 * * * *
2011-12 88 87 >99% 13 88 n/a
African American 2010-11 88 80 >99% 12 79 9
2011-12 85 72 >99% 15 85 n/a
(Continued)
38. Questions regarding Part I of the NCLB Report Card should be directed to the Division of Performance Reporting. Contact us at (512)
463-9704 or performance.reporting@tea.state.tx.us.
Special formats ('*', >99%, <1%, 'n/a') are used in order to comply with the Family Educational Rights and Privacy Act (FERPA).
For grades 3-8, the 2011-12 assessment results are based on the State of Texas Assessments of Academic Readiness (STAAR) results at the
TAKS-equivalency standard that was developed using the STAAR Bridge Study, including required changes due to the transition to the
new assessment program. The 2010-11 assessment results are based on the Texas Assessment of Knowledge and Skills (TAKS) results at
the Met Standard level.
Student Achievement results are rounded to the nearest whole percent.
* Asian, Pacific Islander and Two or More Races are not available for indicators that use the former race/ethnicity definitions. See the
Texas NCLB Glossary for details.
Portions of the NCLB Report Card (Part I, Part II, etc. or prior year information) may not appear when data are not reported.
Texas 2012 NCLB Report Card 38
Part I - District Level: Student Performance for Each District Compared to the State, Percent of Students Tested,
Student Achievement by Proficiency Level, 2010-11, 2011-12*
February 1, 2013
For MCKINNEY ISD (043907)
Grade 8 Mathematics
District % of
Students
Met
Standard
(Proficient)
and
Commended
(Advanced)
State % of
Students
Met
Standard
(Proficient)
and
Commended
(Advanced)
%
Tested
(In
District)
Percent of Students in District at
Each Achievement Level
%
Not
Meeting
Standard
(Basic)
%
Met
Standard
(Proficient)
%
Commended
(Advanced)
Student Group Year
Hispanic 2010-11 89 84 >99% 11 71 18
2011-12 84 77 99 16 84 n/a
White 2010-11 97 93 >99% 3 56 41
2011-12 97 90 >99% 3 97 n/a
Two or More Races 2010-11 90 92 >99% 10 65 25
2011-12 94 88 >99% 6 94 n/a
Female 2010-11 95 88 >99% 5 63 32
2011-12 94 82 >99% 6 94 n/a
Male 2010-11 92 86 >99% 8 61 31
2011-12 92 81 >99% 8 92 n/a
(Continued)
39. Questions regarding Part I of the NCLB Report Card should be directed to the Division of Performance Reporting. Contact us at (512)
463-9704 or performance.reporting@tea.state.tx.us.
Special formats ('*', >99%, <1%, 'n/a') are used in order to comply with the Family Educational Rights and Privacy Act (FERPA).
For grades 3-8, the 2011-12 assessment results are based on the State of Texas Assessments of Academic Readiness (STAAR) results at the
TAKS-equivalency standard that was developed using the STAAR Bridge Study, including required changes due to the transition to the
new assessment program. The 2010-11 assessment results are based on the Texas Assessment of Knowledge and Skills (TAKS) results at
the Met Standard level.
Student Achievement results are rounded to the nearest whole percent.
* Asian, Pacific Islander and Two or More Races are not available for indicators that use the former race/ethnicity definitions. See the
Texas NCLB Glossary for details.
Portions of the NCLB Report Card (Part I, Part II, etc. or prior year information) may not appear when data are not reported.
Texas 2012 NCLB Report Card 39
Part I - District Level: Student Performance for Each District Compared to the State, Percent of Students Tested,
Student Achievement by Proficiency Level, 2010-11, 2011-12*
February 1, 2013
For MCKINNEY ISD (043907)
Grade 8 Mathematics
District % of
Students
Met
Standard
(Proficient)
and
Commended
(Advanced)
State % of
Students
Met
Standard
(Proficient)
and
Commended
(Advanced)
%
Tested
(In
District)
Percent of Students in District at
Each Achievement Level
%
Not
Meeting
Standard
(Basic)
%
Met
Standard
(Proficient)
%
Commended
(Advanced)
Student Group Year
Special Education 2010-11 83 74 >99% 17 75 8
2011-12 77 63 >99% 23 77 n/a
Limited English Proficient 2010-11 71 63 99 29 68 3
2011-12 57 56 99 43 57 n/a
Economically Disadvantaged 2010-11 86 82 >99% 14 73 13
2011-12 84 75 99 16 84 n/a
Migrant 2010-11 * 75 * * * *
2011-12 * 65 * * * n/a