SlideShare a Scribd company logo
1 of 26
Download to read offline
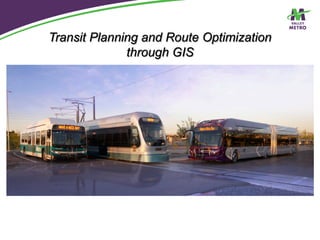
Transit Planning and Route Optimization
through GIS
About Valley Metro
• Public transit agency
for the Phoenix,
Arizona area
• Light rail
• Bus
• Vanpool
• Paratransit services
Transit for Super Bowl XLIX
Overview
• Before- Planning the route
Route Analysis Tool
• During-Implemnting the route
Web Maps
Bus Stop Database
• After-Analyzing the route
On Time Performance app
Planning the Route
GIS is the best tool to answer these questions
Route Analysis Tool
Service Type
Fiscal year of
service
Peak and off-
peak
frequency
Span of
service
Route Analysis Tool Data
Route Specific Data
Number of trips - Miles traveled - Net cost- Fleet Required - Existing Ridership -
Projected Ridership
Demographic Data
Total Population - Households - Zero & One Car Households - Low Income - Elderly
Youth - Disability - Minority
Employment
Number of Employees - Current Transit Riders – People Interested in Transit
Route Analysis Tool Model
Add Fields BuffersSpatial JoinsField CalculationsCost EstimatesFleet EstimatesFile Outputs
Route Analysis Tool Example
• Cost: $1.1 M
• Fleet: 7 Buses
Lower:
• Pop Density
• Minority
• Low Income
• Zero Car HH
• Disability
• Projected
Boardings
Higher:
• Youth
• Employment
Density
Processing Time:
• 6 Minutes
Route Analysis Tool Benefits
• Ability to quickly analyze potential route.
• Demographics comparison to the entire
county and the service area.
• Cost and fleet estimates.
• Speed!!!!
Implementing the Route
Planning the route
Route in Operation
Valley Metro System Map
ArcGIS
Online
Previous Bus Stop Setup
Finance Scheduling
Operations GIS
Optimal Bus Stop Data Setup
GIS
Finance Scheduling Operations
Bus Stop Data Collection
• Visit
• Validate
• View
Using Collector for ArcGIS
Bus Stop Data Collected
• Bus Stop ID
• NextRide ID
• Generalized Location
• Jurisdiction
• # Shelters
• # Benches
• Bus Bay
• # Bike Racks
• Water Fountain
• Public Art
• ADA Compliant
• Emergency Call Box
• Information Display
• Stop Type
• Date Updated
• Sidewalk
• Photo
• Scheduling ID
• Detailed Location
• Travel Direction
• Latitude
• Longitude
• Routes
Bus Stop Database Example
Benefits of using a GIS database
for bus stops
• Location based
• GIS database used to feed information to
all the subsequent processes
• ONE LOCATION!!!
Analyzing the Route
On-Time Performance App
OTP App Example
OTP App Attributes Collected
• Date
• Bus Number
• Data Collector
• Route Name
• Route Direction
• Run
• Block
• Trip
• Published Time
• Wheelchair Boarding
• Bicycle Boarding
• Location
• Arrival Time
• Timepoint
• Departure Time
• # of Boardings at Stop
• # of Alightings at Stop
• Comment
• Total Boardings
• Total Alightings
• Max Passenger Load
23
OTP App Benefits
• Capture accurate arrival and departure
times at every bus stop
• Verify ridership totals from existing
systems
• Possible extenuating circumstances for
poor on-time performance
• Gain a better understanding of a route
outside of planning
Summary
• Quickly provide and analyze essential
demographic, economic, and cost
estimates for planning new routes
• Collect data and inform the transit riders of
changes to the routes
• Analyze how the route is performing
Cory Whittaker, GISP
GIS Administrator
cwhittaker@valleymetro.org
valleymetro.org

More Related Content

Similar to Transit Planning and Route Optimization with GIS Tools

Cloud.DorogaTV - services for intelligent public transportation
Cloud.DorogaTV - services for intelligent public transportationCloud.DorogaTV - services for intelligent public transportation
Cloud.DorogaTV - services for intelligent public transportationShashnizel
 
Traffic studies ORIGIN AND DESTINATION STUDIES
Traffic studies ORIGIN AND DESTINATION STUDIESTraffic studies ORIGIN AND DESTINATION STUDIES
Traffic studies ORIGIN AND DESTINATION STUDIESDavinderpal Singh
 
Disruptive open transport data
Disruptive open transport dataDisruptive open transport data
Disruptive open transport dataJonathan Raper
 
Urban Data Challenge - Christopher A. Pangilinan
Urban Data Challenge - Christopher A. PangilinanUrban Data Challenge - Christopher A. Pangilinan
Urban Data Challenge - Christopher A. Pangilinanswissnex San Francisco
 
February21st esp179-traffic
February21st esp179-trafficFebruary21st esp179-traffic
February21st esp179-trafficKevin Fang
 
Dubuque Smarter Travel
Dubuque Smarter TravelDubuque Smarter Travel
Dubuque Smarter TravelRPO America
 
App design presentation 4.10
App design presentation 4.10App design presentation 4.10
App design presentation 4.10Jorden Prussing
 
2016 Commuter Choice Summit - TDM Technology Session
2016 Commuter Choice Summit - TDM Technology Session2016 Commuter Choice Summit - TDM Technology Session
2016 Commuter Choice Summit - TDM Technology SessionSean Barbeau
 
180412_Nayi Disha_Delhi Govt_ITDP.pptx
180412_Nayi Disha_Delhi Govt_ITDP.pptx180412_Nayi Disha_Delhi Govt_ITDP.pptx
180412_Nayi Disha_Delhi Govt_ITDP.pptxMiracle574616
 
Remix Conference 2015—Robert del Rosario, "Shaking Up Service and Standardizi...
Remix Conference 2015—Robert del Rosario, "Shaking Up Service and Standardizi...Remix Conference 2015—Robert del Rosario, "Shaking Up Service and Standardizi...
Remix Conference 2015—Robert del Rosario, "Shaking Up Service and Standardizi...Remix Software
 
Facilitating Mobility: Parking, Public and Alternative Transportation
Facilitating Mobility: Parking, Public and Alternative Transportation   Facilitating Mobility: Parking, Public and Alternative Transportation
Facilitating Mobility: Parking, Public and Alternative Transportation Christian McCarrick
 
CK2017: Leveraging Open and Standardized Data for Land-Use and Transportation...
CK2017: Leveraging Open and Standardized Data for Land-Use and Transportation...CK2017: Leveraging Open and Standardized Data for Land-Use and Transportation...
CK2017: Leveraging Open and Standardized Data for Land-Use and Transportation...WRI Ross Center for Sustainable Cities
 
Analyzing NYC Transit Data
Analyzing NYC Transit DataAnalyzing NYC Transit Data
Analyzing NYC Transit DataWork-Bench
 
ATS-16: Making Data Count, Krista Nordback
ATS-16: Making Data Count, Krista NordbackATS-16: Making Data Count, Krista Nordback
ATS-16: Making Data Count, Krista NordbackBTAOregon
 
KTH-Texxi Project 2010
KTH-Texxi Project 2010KTH-Texxi Project 2010
KTH-Texxi Project 2010Texxi Global
 

Similar to Transit Planning and Route Optimization with GIS Tools (20)

Sygic Smart Mobility Platform
Sygic Smart Mobility PlatformSygic Smart Mobility Platform
Sygic Smart Mobility Platform
 
i-TINS_overview
i-TINS_overviewi-TINS_overview
i-TINS_overview
 
Cloud.DorogaTV - services for intelligent public transportation
Cloud.DorogaTV - services for intelligent public transportationCloud.DorogaTV - services for intelligent public transportation
Cloud.DorogaTV - services for intelligent public transportation
 
Traffic studies ORIGIN AND DESTINATION STUDIES
Traffic studies ORIGIN AND DESTINATION STUDIESTraffic studies ORIGIN AND DESTINATION STUDIES
Traffic studies ORIGIN AND DESTINATION STUDIES
 
SF-CHAMP 5 - FROGGER - San Francisco's Newly-updated Travel Model
SF-CHAMP 5 - FROGGER - San Francisco's Newly-updated Travel ModelSF-CHAMP 5 - FROGGER - San Francisco's Newly-updated Travel Model
SF-CHAMP 5 - FROGGER - San Francisco's Newly-updated Travel Model
 
Disruptive open transport data
Disruptive open transport dataDisruptive open transport data
Disruptive open transport data
 
Urban Data Challenge - Christopher A. Pangilinan
Urban Data Challenge - Christopher A. PangilinanUrban Data Challenge - Christopher A. Pangilinan
Urban Data Challenge - Christopher A. Pangilinan
 
February21st esp179-traffic
February21st esp179-trafficFebruary21st esp179-traffic
February21st esp179-traffic
 
Dubuque Smarter Travel
Dubuque Smarter TravelDubuque Smarter Travel
Dubuque Smarter Travel
 
App design presentation 4.10
App design presentation 4.10App design presentation 4.10
App design presentation 4.10
 
2016 Commuter Choice Summit - TDM Technology Session
2016 Commuter Choice Summit - TDM Technology Session2016 Commuter Choice Summit - TDM Technology Session
2016 Commuter Choice Summit - TDM Technology Session
 
180412_Nayi Disha_Delhi Govt_ITDP.pptx
180412_Nayi Disha_Delhi Govt_ITDP.pptx180412_Nayi Disha_Delhi Govt_ITDP.pptx
180412_Nayi Disha_Delhi Govt_ITDP.pptx
 
Remix Conference 2015—Robert del Rosario, "Shaking Up Service and Standardizi...
Remix Conference 2015—Robert del Rosario, "Shaking Up Service and Standardizi...Remix Conference 2015—Robert del Rosario, "Shaking Up Service and Standardizi...
Remix Conference 2015—Robert del Rosario, "Shaking Up Service and Standardizi...
 
Facilitating Mobility: Parking, Public and Alternative Transportation
Facilitating Mobility: Parking, Public and Alternative Transportation   Facilitating Mobility: Parking, Public and Alternative Transportation
Facilitating Mobility: Parking, Public and Alternative Transportation
 
Transportation Studies in the 21st Century: Incorporating all Modes
Transportation Studies in the 21st Century: Incorporating all ModesTransportation Studies in the 21st Century: Incorporating all Modes
Transportation Studies in the 21st Century: Incorporating all Modes
 
CK2017: Leveraging Open and Standardized Data for Land-Use and Transportation...
CK2017: Leveraging Open and Standardized Data for Land-Use and Transportation...CK2017: Leveraging Open and Standardized Data for Land-Use and Transportation...
CK2017: Leveraging Open and Standardized Data for Land-Use and Transportation...
 
Analyzing NYC Transit Data
Analyzing NYC Transit DataAnalyzing NYC Transit Data
Analyzing NYC Transit Data
 
ATS-16: Making Data Count, Krista Nordback
ATS-16: Making Data Count, Krista NordbackATS-16: Making Data Count, Krista Nordback
ATS-16: Making Data Count, Krista Nordback
 
2014 CUTC Summer Meeting: David Plazak
2014 CUTC Summer Meeting: David Plazak2014 CUTC Summer Meeting: David Plazak
2014 CUTC Summer Meeting: David Plazak
 
KTH-Texxi Project 2010
KTH-Texxi Project 2010KTH-Texxi Project 2010
KTH-Texxi Project 2010
 

Transit Planning and Route Optimization with GIS Tools

  • 1. Transit Planning and Route Optimization through GIS
  • 2. About Valley Metro • Public transit agency for the Phoenix, Arizona area • Light rail • Bus • Vanpool • Paratransit services
  • 3. Transit for Super Bowl XLIX
  • 4. Overview • Before- Planning the route Route Analysis Tool • During-Implemnting the route Web Maps Bus Stop Database • After-Analyzing the route On Time Performance app
  • 5. Planning the Route GIS is the best tool to answer these questions
  • 6. Route Analysis Tool Service Type Fiscal year of service Peak and off- peak frequency Span of service
  • 7. Route Analysis Tool Data Route Specific Data Number of trips - Miles traveled - Net cost- Fleet Required - Existing Ridership - Projected Ridership Demographic Data Total Population - Households - Zero & One Car Households - Low Income - Elderly Youth - Disability - Minority Employment Number of Employees - Current Transit Riders – People Interested in Transit
  • 8. Route Analysis Tool Model Add Fields BuffersSpatial JoinsField CalculationsCost EstimatesFleet EstimatesFile Outputs
  • 9. Route Analysis Tool Example • Cost: $1.1 M • Fleet: 7 Buses Lower: • Pop Density • Minority • Low Income • Zero Car HH • Disability • Projected Boardings Higher: • Youth • Employment Density Processing Time: • 6 Minutes
  • 10. Route Analysis Tool Benefits • Ability to quickly analyze potential route. • Demographics comparison to the entire county and the service area. • Cost and fleet estimates. • Speed!!!!
  • 11. Implementing the Route Planning the route Route in Operation
  • 12. Valley Metro System Map ArcGIS Online
  • 13. Previous Bus Stop Setup Finance Scheduling Operations GIS
  • 14. Optimal Bus Stop Data Setup GIS Finance Scheduling Operations
  • 15. Bus Stop Data Collection • Visit • Validate • View
  • 17. Bus Stop Data Collected • Bus Stop ID • NextRide ID • Generalized Location • Jurisdiction • # Shelters • # Benches • Bus Bay • # Bike Racks • Water Fountain • Public Art • ADA Compliant • Emergency Call Box • Information Display • Stop Type • Date Updated • Sidewalk • Photo • Scheduling ID • Detailed Location • Travel Direction • Latitude • Longitude • Routes
  • 18. Bus Stop Database Example
  • 19. Benefits of using a GIS database for bus stops • Location based • GIS database used to feed information to all the subsequent processes • ONE LOCATION!!!
  • 23. OTP App Attributes Collected • Date • Bus Number • Data Collector • Route Name • Route Direction • Run • Block • Trip • Published Time • Wheelchair Boarding • Bicycle Boarding • Location • Arrival Time • Timepoint • Departure Time • # of Boardings at Stop • # of Alightings at Stop • Comment • Total Boardings • Total Alightings • Max Passenger Load 23
  • 24. OTP App Benefits • Capture accurate arrival and departure times at every bus stop • Verify ridership totals from existing systems • Possible extenuating circumstances for poor on-time performance • Gain a better understanding of a route outside of planning
  • 25. Summary • Quickly provide and analyze essential demographic, economic, and cost estimates for planning new routes • Collect data and inform the transit riders of changes to the routes • Analyze how the route is performing
  • 26. Cory Whittaker, GISP GIS Administrator cwhittaker@valleymetro.org valleymetro.org