Recommended

Recommended
More Related Content
Recently uploaded
Recently uploaded (20)
Featured
Featured (20)
2010 Dealers\' Report Card
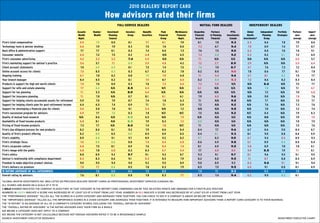
- 1. 2010 dealers’ report card How advisors rated their firms Full-service dealers mutual Fund dealers independent dealers assante dundee- investment investors manulife peak Worldsource desjardins partners pFsl Global independent portfolio perform- import- Wealth Wealth planning Group securities Financial Financial Financial in planning investments maxfin planning strategies ance ance mgmt. counsel Group mgmt. security Financial canada investments* Group average average Firm’s total compensation 6.9 7.9 8.0 8.1 7.7 8.1 7.9 8.1 7.8 9.3 6.3 8.6 7.8 7.9 8.6 technology tools & advisor desktop 6.6 7.9 7.9 8.3 7.5 7.6 8.0 7.3 6.7 9.4 7.0 8.9 7.4 7.7 8.7 Back office & administrative support 7.7 7.7 8.1 8.3 7.4 8.0 7.3 7.6 7.5 9.0 6.2 8.8 7.6 7.8 9.1 consumer website 6.0 7.2 7.5 8.2 6.8 N/a 6.5 7.3 6.8 9.2 6.3 8.2 6.1 7.2 6.9 Firm’s consumer advertising 4.2 5.3 5.2 7.4 6.5 N/a N/a 7.1 N/a N/a N/a N/a N/a 6.0 5.7 Firm’s marketing support for advisor’s practice 5.6 5.7 7.1 8.4 5.9 4.8 4.2 7.2 2.7 8.9 3.9 N/a N/a 5.9 6.4 client account statements 7.0 6.9 6.9 8.1 7.5 7.4 7.5 7.6 7.0 8.7 4.7 7.6 7.3 7.2 8.4 online account access for clients 7.5 8.5 8.3 8.3 6.7 8.2 7.8 8.2 8.0 9.0 7.8 8.6 7.7 8.1 7.8 ongoing training 6.7 7.8 8.2 8.8 7.9 7.0 6.8 7.1 5.4 9.6 5.7 8.1 8.2 7.5 7.7 Your branch manager 8.4 8.5 8.2 8.1 7.9 8.7 8.4 8.2 8.4 9.3 7.2 8.6 8.2 8.3 8.4 products & support for high net-worth clients 7.6 7.6 8.0 8.3 7.6 7.3 6.6 7.2 5.8 N/a N/a 8.6 N/a 7.5 7.7 support for wills and estate planning 7.7 6.4 N/a 8.5 6.4 N/c N/a 6.1 N/a N/a N/a 7.8 N/a 7.1 6.7 support for tax planning 7.1 5.3 N/a 8.9 6.6 N/a N/a N/a N/a N/a N/a 7.2 N/a 7.0 6.8 support for insurance planning 7.1 7.8 N/a 8.7 8.1 8.1 6.1 7.9 6.0 9.6 N/a 9.0 N/a 7.8 7.6 support for helping clients accumulate assets for retirement 5.9 7.0 7.9 8.7 7.4 7.8 6.3 7.1 N/a 9.5 N/a 7.7 N/a 7.5 7.7 support for helping clients plan for post-retirement income 6.4 6.5 7.4 8.9 7.1 7.1 5.9 7.2 N/a 9.2 N/a 7.6 N/a 7.3 7.6 support for developing a financial plan for clients 5.6 5.8 7.8 9.1 5.4 N/a 7.2 N/a N/a 9.8 N/a 7.0 N/a 7.2 7.4 Firm’s succession program for advisors 6.9 7.7 7.6 8.3 7.8 N/c N/c 7.5 N/a 9.2 N/c 8.4 N/a 7.9 8.3 Quality of mutual fund research N/a 8.6 N/a 8.9 6.5 N/a 7.5 N/a N/a N/a N/a N/a N/a 7.9 7.0 availability of fixed-income products 6.8 8.1 N/a 8.5 7.9 8.3 7.2 8.0 N/a N/a N/a N/a N/a 7.8 7.5 pricing of fixed-income products 7.3 7.7 N/a 8.0 7.4 7.8 N/c 7.1 N/a N/a N/a N/a N/a 7.5 7.6 Firm’s due diligence process for new products 8.2 8.6 8.1 9.2 7.9 8.6 8.4 8.4 7.7 9.6 6.7 8.6 9.0 8.4 8.7 Quality of firm’s product offering 8.2 8.9 8.5 8.9 8.5 8.9 8.5 8.4 8.1 9.3 8.1 9.0 8.8 8.6 8.9 Firm’s stability 8.9 8.8 9.1 9.7 8.9 9.2 8.2 9.7 8.2 9.9 6.7 9.4 8.4 8.9 9.3 Firm’s strategic focus 7.6 8.0 8.6 8.8 7.6 8.4 6.8 8.6 6.9 9.8 6.1 8.9 8.4 8.0 8.4 Firm’s corporate culture 6.8 7.5 8.1 8.9 7.6 8.4 7.4 8.1 6.9 9.5 5.8 8.9 7.8 7.8 8.1 Firm’s image with the public 6.8 7.8 6.8 8.3 8.3 6.7 5.4 7.7 6.0 8.0 4.9 8.5 7.9 7.1 8.1 Firm’s ethics 8.8 8.9 9.2 9.7 9.1 9.3 8.7 9.3 9.1 9.7 8.1 9.6 9.5 9.1 9.5 advisor’s relationship with compliance department 8.3 8.3 8.6 9.1 8.3 8.5 7.9 8.2 8.0 9.5 7.1 8.7 8.8 8.4 8.9 Freedom to make objective product choices 9.0 9.5 9.4 9.0 9.2 9.5 8.9 9.0 8.9 9.3 8.3 9.6 9.1 9.1 9.4 Firm’s delivery on promises 7.0 7.7 8.6 8.5 7.8 8.3 7.9 8.5 7.5 9.5 6.0 9.1 8.8 8.1 8.9 ie ratinG (averaGe oF all cateGories) 7.1 7.6 8.0 8.6 7.5 8.0 7.3 7.8 7.1 9.3 6.5 8.5 8.2 7.8 overall rating by advisors 7.6 8.1 8.5 8.8 7.8 8.3 7.7 8.5 7.4 9.4 6.2 9.0 8.3 8.1 *Global Maxfin investMents inc. was listed on previous dealers’ report cards as professional investMent services (canada) inc. all scores are based on a scale of 0 to 10 a bold nuMber indicates the coMpany placed first in that cateGory in the report card. coMpanies can be tied. no extra points are awarded for a first-place position nuMbers in Green indicate a score has increased by at least 0.5 of a point froM last year. nuMbers in red indicate a score has decreased by at least 0.5 of a point froM last year the “perforMance averaGe” tallies all the scores in a Given cateGory and averaGes theM toGether. you can check to see if a coMpany is above or below the averaGe the “iMportance averaGe” tallies all the iMportance scores in a Given cateGory and averaGes theM toGether. it is intended to Measure how iMportant advisors think a report card cateGory is to their business the “ie ratinG” is an averaGe of all of a coMpany’s cateGory scores, excludinG the “overall ratinG by advisors” the “overall ratinG by advisors” is the ratinG advisors Gave their firM as a whole n/a Means a cateGory does not apply to a coMpany n/c Means the cateGory is not calculable because not enouGh advisors rated it to be a reasonable saMple source: investMent executive research investMent executive chart