Australia: World Class Innovation Destination
•
1 like•183 views

Australian researchers are driving or collaborating on cutting-edge research and have regularly published their findings in many of the world’s most cited publications. There is strong support for R&D in Australia, with significant funding from public and private sector organisations. International partners will find many opportunities to participate in research projects with Australia’s leading universities and science organisations.
Recommended

Recommended
More Related Content
Similar to Australia: World Class Innovation Destination
Similar to Australia: World Class Innovation Destination (20)
More from Cerule Consulting
More from Cerule Consulting (9)
Recently uploaded
Recently uploaded (20)
Australia: World Class Innovation Destination
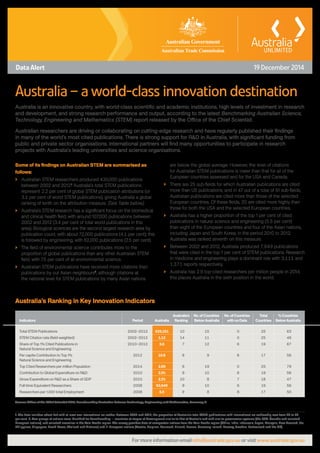
- 1. Data Alert 19 December 2014 Australia – a world-class innovation destination Australia is an innovative country, with world-class scientific and academic institutions, high levels of investment in research and development, and strong research performance and output, according to the latest Benchmarking Australian Science, Technology, Engineering and Mathematics (STEM) report released by the Office of the Chief Scientist. Australian researchers are driving or collaborating on cutting-edge research and have regularly published their findings in many of the world’s most cited publications. There is strong support for RD in Australia, with significant funding from public and private sector organisations. International partners will find many opportunities to participate in research projects with Australia’s leading universities and science organisations. For more information email info@austrade.gov.au or visit www.austrade.gov.au Some of its findings on Australian STEM are summarised as follows: ›› Australian STEM researchers produced 430,000 publications between 2002 and 2012.1 Australia’s total STEM publications represent 2.2 per cent of global STEM publication attributions (or 3.1 per cent of world STEM publications), giving Australia a global ranking of tenth on the attribution measure. (See Table below.) ›› Australia’s STEM research has a significant focus on the biomedical and clinical health field, with around 107,000 publications between 2002 and 2012 (3.4 per cent of total world publications in this area). Biological sciences are the second largest research area by publication count, with about 72,000 publications (4.1 per cent); this is followed by engineering, with 62,000 publications (2.5 per cent). ›› The field of environmental science contributes more to the proportion of global publications than any other Australian STEM field, with 7.5 per cent of all environmental science. ›› Australian STEM publications have received more citations than publications by our Asian neighbours2 , although citations at the national level for STEM publications by many Asian nations are below the global average. However, the level of citations for Australian STEM publications is lower than that for all of the European countries assessed and for the USA and Canada. ›› There are 25 sub-fields for which Australian publications are cited more than US publications, and in 47 out of a total of 91 sub-fields, Australian publications are cited more than those of the selected European countries. Of these fields, 20 are cited more highly than those for both the USA and the selected European countries. ›› Australia has a higher proportion of the top 1 per cent of cited publications in natural science and engineering (5.5 per cent) than eight of the European countries and four of the Asian nations, including Japan and South Korea, in the period 2010 to 2012. Australia was ranked seventh on this measure. ›› Between 2002 and 2012, Australia produced 7,949 publications that were cited in the top 1 per cent of STEM publications. Research in medicine and engineering plays a dominant role with 3,111 and 1,371 reports respectively. ›› Australia has 2.9 top-cited researchers per million people in 2014; this places Australia in the sixth position in the world. Australia’s Ranking in Key Innovation Indicators Source: Office of the Chief Scientist 2014, Benchmarking Australian Science Technology, Engineering and Mathematics, Summary V 1. The data includes about half with at least one international co-author. Between 2002 and 2012, the proportion of Australia’s total STEM publications with international co-authorship rose from 45 to 57 per cent. 2. Two groups of nations were identified for benchmarking — countries at stages of development similar to that of Australia and with similar governance systems (the USA, Canada and selected European nations), and selected countries in the Asia-Pacific region. The survey provides data of comparator nations from the Asia-Pacific region (China, India, Indonesia, Japan, Malaysia, New Zealand, the Philippines, Singapore, South Korea, Thailand and Vietnam) and 11 European nations (Austria, Belgium, Denmark, Finland, France, Germany, Ireland, Norway, Sweden, Switzerland and the UK). Australia’s No. of Countries No. of Countries Total % Countries Indicators Period Australia Ranking Below Australia with no Data Countries Below Australia Total STEM Publications 2002–2012 429,161 10 15 0 25 63 STEM Citation rate (field-weighted) 2002–2012 1.12 14 11 0 25 46 Share of Top 1% Cited Publications in 2010–2012 5.5 7 12 6 19 67 Natural Science and Engineering Per capita Contribution to Top 1% 2012 10.6 8 9 8 17 56 Natural Science and Engineering Top Cited Researchers per million Population 2014 2.89 6 19 0 25 79 Contribution to Global Expenditure on RD 2010 2.0% 9 10 6 19 56 Gross Expenditure on RD as a Share of GDP 2010 2.2% 10 8 7 18 47 Full-time Equivalent Researchers 2008 92,649 9 10 6 19 56 Researchers per 1,000 total Employment 2008 8.5 9 8 8 17 50