Thought to be one of the largest of its kind, the survey - in partnership with 'The Engineer' - saw 4,365 engineers from across the industry answer questions on everything from salary and benefits to wider levels of job satisfaction as well as their views on pressing industry concerns such as the gender divide and the skills gap.
1. JUNE 2015 | theEnGineeR | 21 | theEnGineeR | JUNE 2015
The results of The Engineer’s 2015 salary survey provide
a fascinating glimpse into the engineering profession and
how salaries vary according to sector, seniority and region
Pay scale
Despite only 35 per cent feeling that their earnings
suitably reflect their workload, the majority expect
to remain in engineering for the next five years
“
The highest earnings
can be found in the
energy and fuel sectors.
Engineers in oil and gas
top the table, earning
£55,265 on average
“
->
Salary survey In partnership with: In partnership with:
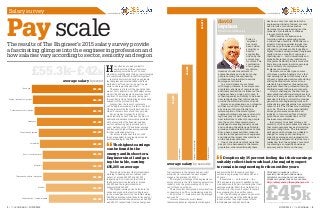
Today’s
‘engineer’
has rarely
been valued
so highly or
been so
sought after,
driven by the
current war
for talent. The
combination
of an ageing
workforce,
decades of under-investment in
apprenticeships and a lack of young
people entering the engineering
professions has resulted in serious
shortages at all levels.
In a world where we are faced
with mega problems, for example over-
population, shortage of resources and
environmental issues, it strikes me that
engineers have a huge part to play. It
is their ingenuity and ability to harness
new technologies that will invariably
provide the solutions that we all seek.
However, engineering as a profession
still has much to do to promote itself
as a career of choice. Clearly the
misconception of the stereotypical
engineer holding a spanner and an oily
rag does play its part. Despite many
new initiatives to attract young people
into the sector, there remain many
challenges in meeting industry needs
and in closing the skills gaps. Notably,
prominent industrialists such as James
Dyson have expressed their concerns
over the future generation of engineers
and indeed the impact this could have
on the business economy.
One of the obvious talent pools that
has yet to be harnessed is the female
population, where traditionally there
david
leyshon
Chairman,CBSbutler
has been a very low uptake into the
engineering industry. Indeed, we only
need to look at countries such as
Germany where engineering is at the
pinnacle of professions to witness
a far greater diversity.
With decades of experience in
recruiting within engineering across
a wide range of sectors, CBSbutler can
attest to having specialist insight into
both the opportunities and challenges
afforded to job seekers. Well-qualified,
highly trained and experienced engineers
really do have a wealth of options at
their disposal — both domestically and
globally. Moreover, those individuals
who prefer flexibility in their work will
find strong demand, lucrative earnings
and continuity of employment via
freelance contracting.
However, we cannot ignore some
of the less positive findings. It is a fact
that earning levels within many areas
of heavy engineering and manufacturing
still lag behind other sectors. Also, a
relatively high number of experienced
engineers leave the profession through
disillusionment with career prospects.
A major challenge is the chronic age
demographics befitting strategic sectors
such as oil and gas and construction. The
decades of failing to attract the younger
generation into engineering roles and
cutbacks in apprenticeships has certainly
taken its toll. The UK has much catching
up to do. There is a clear responsibility
across government, education and
industry to turn around this situation
given the severe implications on UK
business competitiveness.
In summary, the sheer volume and
diversity of job opportunities will ensure
that most engineers have a stimulating
and rewarding future. The forecasted
skill gaps and shortages are unlikely to
change for many years, resulting in
attractive earnings and progression for
talented professionals. At last there is a
realisation that ‘the engineer’ is central
to achieving a competitive business
economy and is firmly on the map.
fuel, engineers in the defence and security/
marine sector command the next highest
wages, at an average of £53,151.
The largest percentage of the engineers we
surveyed work in the UK’s booming automotive
industry, with the group making up 13.6 per
cent of those questioned.
There were few demographic surprises from
our sample group. The overwhelming majority
— 95.5 per cent — were male, and the average
age was 44.
In terms of seniority, most classed
themselves as senior engineers or managers,
Click here to make use of our
specially developed online salary
calculator, and see how your salary
stacks up against those of your peers.
http://salarysurvey.theengineer.co.uk/
average salary by sector
average salary by seniority
£55,265
£55.3k–£42k
£45kAverage salary for engineers across all sectors
£54,408
£53,151
£51,283
£49,887
£48,953
£46,830
£46,798
£46,489
£44,379
£42,082
Aerospace
Chemicals and pharma
Automotive
Rail / civil and structural
Materials
Telecoms and utilities / electronics
Medical
Food and drink / consumer goods
Oil and gas
Directororabove
Manager/seniorengineer
Juniorengineer
Defence and security / marine
Energy / renewables / nuclear
H
ow often do you ask yourself if
engineers in a different sector are
earning more than you? Or even
whether your skills might bring greater rewards
in a completely different industry altogether?
In which sectors of industry do engineers
feel happiest and most satisfied with their
work and pay? And can you expert to earn
more in one region than another?
These are just a few of the questions that
we set out to answer in our 2015 salary survey.
And with 4,365 engineers from across the UK
and from 18 sectors of industry taking part,
the results provide a fascinating and revealing
snapshot of the profession today.
Judging from the tenor of comments
on The Engineer website, it is fair to say that
UK engineers often feel pretty hard done by
when it comes to how much they get paid.
But, as we have frequently reported,
while industry doesn’t often see the kind of
stratospheric salaries commonly associated
with some parts of the financial services
sector, engineering pay is actually pretty
good: well above the UK’s national average,
and frequently higher than average salaries
in other professional sectors.
Our survey results bear this out, with
the average salary for engineers across all
sectors standing at £45,055.
This is below the level that professionals
working in banking and accountancy can
expect, at around £54,000 and £51,000
respectively. But it is above that for both
the financial services industry, at around
£46,000, and the legal profession, at
approximately £39,000.
The highest earnings can be found in the
various energy and fuel sectors. Engineers
in the oil and gas sector top the table, earning
£55,265 on average, while those in the energy/
renewables/nuclear industries receive £54,408
and £52,471 respectively. Outside energy and
and almost half of those surveyed have
worked in engineering for between 20 and
40 years.
It seems that — on the whole — the
UK’s engineers are a pretty satisfied bunch.
And despite only 35 per cent feeling that their
earnings suitably reflect their workload, the
vast majority (84 per cent) expect to remain
in engineering for the next five years.
Over the following pages we’ve gone into
more detail on some of these findings, and
looked at what they might mean for both
individuals and industry as whole.
£32,233
£46,238
£68,672
2. JUNE 2015 | theEnGineeR | 43 | theEnGineeR | JUNE 2015
More than 80 per
cent of respondents to
the salary survey describe
themselves as senior
engineers or above.
However there is huge
salary variation between
different sectors
“
Regional variations in
salary are relatively small.
Salaries in the automotive
sector appear to be most
affected by location
“
In terms of seniority, the response reflects
The Engineer’s audience of senior engineers.
More than 80 per cent of respondents describe
themselves as senior engineers or above: 45.5
per cent as senior engineers, 31.3 per cent as
managers and 6.3 per cent as directors.
The overall average salary for a junior engineer
is £32,233; for a manager/senior engineer it is
£47,238; and for a director or above it is £68,672.
However, there is huge variation between
sectors: a director or above working in defence
and security earns almost £30,000 more than
someone of similar seniority in food and drink.
What’s more, it doesn’t follow that the sector
that pays the highest director salaries also pays
more for its junior engineers and managers.
Indeed, salaries for junior engineers in defence
and security sit near the bottom of the table,
while the chemicals and pharmaceuticals sector
ranks highly for both junior and senior engineers.
Interestingly, considering the difficulties
that it’s currently facing, the oil and gas sector
features in the top three for all levels of seniority.
Respondents to the survey were spread
throughout the UK and beyond, and provide an
interesting glimpse of regional salary variations
across the different engineering sectors. The
regional spread also provides a reminder that,
contrary to perceptions outside of the industry,
a high proportion of engineering roles are
based in London and the south east.
Perhaps unsurprisingly, London and the south
east offers the highest salaries in many of the
sectors and for a number of sectors outperforms
the regions that are typically regarded as
centres of excellence. For instance, automotive
and aerospace expertise, which tends to be
concentrated in theWest Midlands and the south
west respectively, commands a higher salary in
the south east. Indeed, somewhat surprisingly,
our results suggest that the south west actually
offers the poorest salaries in the aerospace sector.
Although most regional variations are
relatively small, the sector that seems to vary
most according to location is automotive. Here,
the highest average salary is found in London
and the south east (£51,333), while the lowest
within the UK (£38,720) are found in Scotland,
Wales and Northern Ireland. Some of the
highest salaries on offer are found outside the UK.
Job satisfaction levels show minor variations
according to region, with engineers in Scotland,
Wales and Northern Ireland coming out on top
in the happiness stakes (51.6 per cent).
Engineers in the south west are least likely
to be happy with their salaries (31.9 per cent
believe they are fairly remunerated), while
engineers in the Midlands and East Anglia
show the highest levels of contentment with
their pay (35.6 per cent).
1. seniority 2. regions
£81.5k
average salary by industry junior engineer
senior engineer / manager
director or above
the age of the
UK’s engineering
workforce
The ageing nature of the UK’s engineering
workforce has been the subject of significant
debate in recent years, with many concerned
that the impending retirement of many
of our most highly-skilled and experienced
engineers could lead to crippling skills
shortages in a number of key sectors,
But here our survey offers some cause for
optimism. Of those questioned, the average
age of engineer was 44. Engineers in the civil
and structural engineering sector are the
youngest on average, at 40, while the oldest
in the profession can be found in the process
industry, with an average age of 45.
These averages hide a slightly more
worrying trend though, since more engineers
can be found in the 50-54 age band (16.6 per
cent) than any other, suggesting that many
will be retiring over the next ten years.
Meanwhile, at the other end of the spectrum,
just 12 per cent of the engineers we surveyed
were under 30.
Oil and gas
Chemicals and pharma
Rail / civil and structural
Energy / renewables / nuclear
Automotive
Defence and security / marine
Aerospace
Food and drink / consumer goods
Medical
Telecoms and utilities / electronics
Materials
Chemicals and pharma
Energy / renewables / nuclear
Telecoms and utilities / electronics
Aerospace
Oil and gas
Medical
Defence and security / marine
Materials
Food and drink / consumer goods
Rail / civil and structural
Automotive
Oil and gas
Energy / renewables / nuclear
Automotive
Telecoms and utilities / electronics
Aerospace
Food and drink / consumer goods
Materials
Medical
Rail / civil and structural
Defence and security / marine
Chemicals and pharma
Energy / renewables / nuclear
Oil and gas
Rail / civil and structura
Food and drink / consumer goods
Aerospace
Defence and security / marine
Telecoms and utilities / electronics
Medical
Automotive
Materials
Chemicals and pharma
Defence and security / marine
Oil and gas
Chemicals and pharma
Energy / renewables / nuclear
Medical
Materials
Telecoms and utilities / electronics
Rail / civil and structural
Food and drink / consumer goods
Automotive
Aerospace
Energy / renewables / nuclear
Oil and gas
Materials
Food, drink and consumer goods
Medical
Automotive
Telecoms and utilities / electronics
Defence, security and marine
Aerospace
Rail, civil, structural
Chemicals and pharma
Chemicals and pharma
Defence, security and marine
Medical
Telecoms and utilities / electronics
Food, drink and consumer goods
Automotive
Aerospace
Oil and gas
Rail, civil, structural
Materials
Energy / renewables / nuclear
Defence and security / marine
Aerospace
Energy / renewables / nuclear
Telecoms and utilities / electronics
Automotive
Materials
Chemical and pharma
Rail / civil and structural
Medical
Food and drink / consumer goods
Oil and gas
Chemicals and pharma
Energy / renewables / nuclear
Defence and security / marine
Medical
Aerospace
Automotive
Rail / civil and structural
Telecoms and utilities / electronics
Food and drink / consumer goods
Materials
Oil and gas
36,566
33,678
32,566
34,557
33,411
30,381
29,062
33,990
33,357
30,209
26,790
51,000
45,710
42,630
47,776
45,561
42,102
40,659
47,330
44,886
41,950
40,250
55,250
45,769
40,211
48,417
42,670
39,451
35,438
46,171
42,333
36,000
33,125
56,667
51,333
44,654
55,121
47,293
44,355
43,760
54,600
47,290
44,326
41,761
52,480
44,422
43,373
49,356
44,205
41,797
39,477
47,893
43,441
41,066
38,344
52,757
45,200
39,565
50,465
43,438
39,375
38,720
47,615
41,667
39,299
36,000
65,263
58,464
46,414
59,457
51,007
43,004
36,041
59,277
48,757
39,995
34,974
52,362
45,387
44,794
52,233
45,069
44,257
42,887
50,834
45,047
43,747
41,996
81,499
77,580
64,408
78,421
68,931
62,743
59,008
78,394
68,709
62,555
53,150
26.7% East Anglia, West Midlands
and East Midlands
20.9% London and south east
18.7% North
13% South west
11.7% Outside of the UK (roughly
split between Europe, US
and Asia-Pacific)
9.1% Wales, Scotland, Northern
Ireland
where are the
UK’s engineers?
midlands and east anglia south west
london and south east north
scotland, wales and NI outside UK
The average salary of directors
or above working in the defence
and security/marine industries
Salary survey In partnership with: In partnership with:
3. In partnership with:
JUNE 2015 | theEnGineeR | 6
Salary survey In partnership with:
5 | theEnGineeR | JUNE 2015
“
“
Despite a challenging
climate, salaries in the
oil and gas sectors were
higher, on average, than
salaries in any other
engineer ing sector.
Satisfaction levels are
correspondingly high
The various energy
sectors are at the heart
of the UK’s plans for the
future, and high average
salaries across the board
reflect the industry’s
priority status
It is no secret that the UK’s oil and gas industry
is facing challenging times. As North Sea wells
decline, producers are having to drill in harsher
environments, while the recent decline in the
price of oil has hit margins.
But with up to 24 billion barrels of oil
potentially left to recover from the UK
Continental Shelf, demand for skilled engineers
remains high. As a result, salaries in the sector
are also high, with the average oil and gas
engineer earning £55,265, which is more
than any other sector covered by the survey.
Engineers working in the sector accounted
for 8.6% of overall respondents, and -
somewhat surprisingly – appear to be fairly
evenly spread throughout the UK . The largest
grouping (24.5 per cent) are based in the North
of England, closely followed by London and the
south east which accounts for 18.5 per cent of
those taking part.
The highest average salaries in the sector
(£59,457) are found outside the UK, although
salaries in London and the South East – home
to the UK corporate headquarters for many of
the biggest players – are also high (£56,667)
The lowest paid region, according to our survey,
is the South West where professionals in the
sector average around £36,000.
In terms of seniority, the gap between junior
engineer and those at director level or above is
relatively pronounced, with the sector boasting
the highest average director level salaries
(£78,294)
Against this backdrop, satisfaction levels
are also understandably high. 57.1 per cent of
respondents from the sector say they are happy
in their current job and 46.9 per cent are happy
with their salary: the highest percentage of the
industries surveyed.
In demographic terms the sector mirrors
much of the rest of industry with 93.6 percent
of respondents describing themselves as male,
and just 6.4 percent as female.
However, it performs relatively well in terms
of ethnic diversity, with 9.6 per cent of
respondents describing themselves as either
black,Asian, or minority ethnic (BAME)
01. oil & gas
Junior engineer
Senior engineer / manager
Director or above
Scotland,Wales & NI
North
South west
Outside UK
Midlands & East anglia
London & South East
36,566
50,834
78,394
36,000
44,886
50,465
49,356
56,667
59,457
£50.8kThe average salary of senior engineers working in the oil and gas sectors
average salary by seniority
average salary by region
With the drive to reduce the UK’s greenhouse
gas emissions, both the renewables and nuclear
industries are in vibrant health.
The UK is on the verge of a nuclear
renaissance, with plans for at least 12 new
plants, accounting for just under half of the
country’s generating capacity. Meanwhile
renewables reached a record share of the UK’s
electricity generation in 2014, contributing
19.2 per cent of the country’s power mix.
Average salaries in the sectors - which
account for 8.8 per cent of response to the
salary survey - are correspondingly high with
engineers earning on average £54,405. This puts
the sector in second place behind the highest-
paying industry, oil & gas.
There is some variation in salary across
the different region s although this is not as
pronounced as in some other sectors. The
highest average salary is found in London and
the South East, where engineers working in
renewables, nuclear, or energy earn £55,121 on
average. The lowest is found in the South West,
where engineers earn on average £46,171.
There is obviously also some variation
according to seniority, and the gap between
those at director level or above (£77,580) and
engineers further down the ladder is more
marked than in some of other sectors covered
in the report.
Interestingly, despite the relatively high
salaries on offer, engineers in these sectors don’t
appear to be particularly happy with their level
of remuneration. Just 39.3 per cent say that
they are content with their salary compared to
46.9 per cent of engineers in the only marginally
better-paid oil and gas sector. Despite this,
contentment levels are relatively high, with 57
per cent of those surveyed happy in their job,
and 86.4 per cent saying that they are likely
to stay in industry for the next five years.
The average age of engineers working in
these sectors is 42.6 and 93.9 per cent of those
responding are male. 6.4 per cent of responses
came from members of the black,Asian or
minority ethnic communities.
02. energy /
renewables / nuclear
Junior engineer
Senior engineer / manager
Director or above
Scotland,Wales & NI
North
South west
Outside UK
Midlands & East Anglia
London & South East
33,411
52,233
77,580
46,171
47,776
52,480
51,007
52,757
55,121
£52.2kThe average salary of senior engineers working in the energy / renewables / nuclear sectors
average salary by seniority
average salary by region
4. “Despite cuts to defence
spending, salaries in the
defence & security / marine
sectors are the second
highest, on average, of all
the sectord featured in the
survey. 95 per cent of all
respondents are male
Despite recent headlines about cuts to the
UK’s military spending, the country still has the
biggest defence budget in Europe, investing
over two per cent of its income on the armed
forces and its equipment and support.
The International Institute for Strategic
Studies notes that Britain’s 2013 defence
expenditure ranks it fifth in the world behind
the USA, Russia, China, and Saudi Arabia. The
industry as a whole has an annual turnover of
£22bn and defence export sales stood at £9.8bn
in 2013, an 11.4 per cent increase on 2012.
Engineers working in the defence & security
/ marine sectors account for 5.9 per cent of all
respondents. The average salary for engineers
working in the sector is £53,151, which places it
just behind oil and gas and energy as one of the
most highly paid sectors covered by the survey.
Unlike some other sectors, regional salary
variation does not appear to be particularly
marked within the UK. Engineers working in
Scotland,Wales and NI earn the lowest average
salaries (£39,565) whilst those working in the
South West earn the highest (£48,417). However,
engineers working overseas appear to earn
considerably more on average (£65,263)
Satisfaction levels are reasonably high when
compared with other sectors. Just over half of
engineers surveyed are happy in their current
jobs, and only 46 percent are considering
switching to another sector. This is the lowest
percentage of any sector featured in the survey.
Despite this, and despite the relatively high
salaries, satisfaction with the level of pay is
relatively low, with just 28.5 per cent saying that
they are happy with their salary.
Of the engineers surveyed from the defence,
security, and marine industries, 95 per cent are
male. The average age is 43, and just 4.4 per
cent of those come from black,Asian or ethnic
minority groups.
03. defence and
security / marine
Salary survey In partnership with: In partnership with:
8.6 per cent of
respondents work in the
UK’s thriving aerospace
sector. UK salaries are
highest in London and the
South East, and lowest in
the sectors heartland: the
South West.
“
The aerospace sector is one of the UK’s most
successful industries, with a value of around £20
billion. It employs around 250,000 people across
the country.
Engineers employed primarily by this sector
account for the second largest group after
automotive (8.6 percent) and earn a slightly
higher salary on average ( £51,283). This
compares very favourably with the average
salary across all sectors, which is £45,066.
Aerospace engineers based overseas
command the highest wages in the sector, at
£59,277, while those in the South West – home
to much of the UK’s aerospace expertise and
just over a quarter of respondents from the
sector - take home the least, with an average
of £39,451. The second highest average salaries
(£47,290) are found in London & the south east,
which accounts for 18.9 percent of aerospace
respondents,
The salary spread according to seniority is
slightly more pronounced than in many other
sectors, with junior engineers (average salary
£30, 381) earning less than half that of engineers
at director level or above (average salary
£78,421)
Satisfaction levels in the sector are similar
to those in engineering as a whole, with 50 per
cent happy in their jobs, while 32 per cent feel
they are appropriately paid and 89.6 per cent of
those surveyed say that it’s likely they will be
staying in industry for the next five years.
Over half of the respondents from this sector
(51.5 per cent) believe that industry knowledge
is a skill lacking in industry today, whilst 41.4
per cent believe engineers also need to get
better at communicating.
Of those aerospace engineers surveyed, 95
per cent are male, and 92 per cent are white.
The average age is 42, while 17 per cent of
engineers in the sector are below the age of 30,
higher than that for engineering as a whole
04. aerospace
Junior engineer
Senior engineer / manager
Director or above
Scotland,Wales & NI
North
South west
Outside UK
Midlands & east anglia
London & South East
30,381
45,047
78,421
41,667
39,477
45,561
47,290
39,451
59,277
£45.5kThe average salary of senior engineers working in the aerospace industries
average salary by seniority
average salary by region
Junior engineer
Senior engineer / manager
Director or above
Scotland,Wales & NI
North
South West
Outside UK
Midlands & east anglia
London & south east
32,566
45,387
81,499
39,565
41,066
42,102
41,761
48,417
65,263
£45.4kThe average salary of senior engineers working in the defence and security/marine industries
average salary by seniority
average salary by region
JUNE 2015 | theEnGineeR | 87 | theEnGineeR | JUNE 2015
5. The UK’s buoyant
automotive sector
accounted for the survey’s
largest sample group.
Unsurprisingly, salary
and satisfaction levels
are relatively high
“
The UK’s automotive industry is in excellent
health, and while there are no major British-
owned carmakers left, Britain now makes
— and exports — more cars now than it has
at any time.
Unsurprisingly, therefore, engineers
employed primarily by the automotive sector
account for a large proportion of respondents
to the survey (13.6 per cent)
Perhaps more surprising is the fact that
salaries in this buoyant sector didn’t top the
list of averages. Nevertheless, automotive
engineers responding to the survey earn an
average of £48,953, marginally more than the
figure for all engineers at £45,055, and roughly
in the middle of the table when compared
alongside other sectors.
Unsurprisingly the largest group of
respondents from this sector (39.1 per cent) are
based in the Midlands and East Anglia. London
and the South East is the next biggest regional
employer, with 17.5 per cent of those surveyed
based in this area.
Engineers working in London and the South
East earn the highest wages on average in the
automotive industry, at around £51,333 and are
closely followed by those based in Midlands
& East Anglia, who earn on average £47,330.
Those based outside of the UK take home
the lowest salary, earning an average of £34,974.
The sector sees the same kind of seniority-
related seniority jumps observed in other
sectors, with junior engineers taking home
on average £33,357, whist those at director
level or above can expect to earn in the region
of £68k. Automotive compares favourably with
all other sectors, and sites around the middle
of the table for each level of seniority.
Satisfaction levels in the sector are in line
with those across engineering, with half of the
automotive engineers surveyed happy in their
job, and 34 per cent content with their salaries.
The overwhelming majority - 97 per cent -
of respondents are male, and 90 per cent are
white. The average age of automotive engineers
is 44, although the largest group of those
questioned – 17.3 per cent – are between
50 and 54 years old.
06. automotive
Salary survey In partnership with: In partnership with:
Junior engineer
Senior engineer / manager
Director or above
Scotland,Wales & NI
North
South West
Outside UK
Midlands & East Anglia
London & South East
33,357
44,794
68,709
34,974
38,720
43,373
40,211
47,330
51,333
£44.8kThe average salary of senior engineers or above working in the automotive sector
average salary by seniority
average salary by region
JUNE 2015 | theEnGineeR | 109 | theEnGineeR | JUNE 2015
“The chemical and
pharma sectors offer high
average salaries, and
generous benefits. 62 per
cent of those working in
the sectors receive an
annual bonus.
05. chemical / pharma
Junior engineer
Senior engineer / manager
Director or above
Scotland,Wales & NI
North
South west
Outside UK
Midlands & east anglia
London & South East
34,557
52,362
62,743
47,615
47,893
54,600
51,000
55,250
58,464
£52.4kThe average salary of senior engineers working in the chemicals and Pharmaceuticals sector
average salary by seniority
average salary by region
The chemical and pharmaceutical industries
are vitally important to the UK economy.
Every day the country’s pharmaceutical
industry spends £12.5 million on research and
development, while the chemical sector has
an annual turnover of more than £57 billion.
The average salary in the industries is
correspondingly high, at £49,887 per year. The
sector is also the most generous for bonuses,
with 62 per cent of those in the industries
receiving one, compared to an average for
engineering as a whole of 47 per cent.
Around one quarter of those surveyed are
based in the North West of England, while
a significant proportion of engineers, 18 per
cent, are based overseas, the majority of whom
work in mainland Europe.
And those process engineers based outside
the UK earn significantly more than the average,
on £58,464, while at the other end of the scale
those in Wales, Scotland and Northern Ireland
take home around £47,615.
Men accounted for 95.1 per cent of those
responding and the average age for the sector
is 45. Just 2.8% of respondents come from a
non-white ethnic group, making this one of the
least ethnically balanced sectors in the report.
Employer focus
supported by
Despite a hostile climate in oil and gas
and chemical production, there is never
a shortage of engaging opportunities
within both the chemical and
pharmaceutical marketplaces in the UK.
Healthcare and promoting quality of life
continues to be a key priority across all
political forums, with major investment
in new drugs and a drive to bring better
products to market quicker, more
efficiently, and to a wider audience.
In chemicals, the challenge as ever is
quality and availability of professional
engineers, and the ability to drive down
raw material costs, increase production
efficiencies, comply with tightening
EHS regulations and compete with
cost-effective overseas competition.
Matt Lawrence
Director of Engineering Recruitment, SRG
6. Salary survey In partnership with: In partnership with:
Respondents working
in the UK’s diverse
materials sector earn
just above the industry
average. However, the
sector’s most generous
salaries are found outside
the UK
“
The UK’s materials sector is a diverse and
highly innovative area of industry, spanning
new developments in metallurgy, advanced
lightweight composites, and emerging materials
such as graphene.
Advances made in the sector are key to the
success of other areas of industry, particularly
the automotive and aerospace industries, where
new materials are helping to meet stringent
global emissions targets by reducing weight,
and improving efficiency.
Engineers working in the materials sector
accounted for 4.2 per cent of all responses to
the salary survey, and earn, on average, £46,798.
According to the survey, the highest average
salaries in the sector are found outside the UK
(£46,414), followed closely by the North of
England (£44,422) and then London and the
South East (£44,355). The poorest performing
region is the South West (£33,125). This is
a surprising result given the huge amount
of materials – and particularly composites
- expertise that can be found in this region, and
could potentially be explained by the relatively
small size of the sample group for the sector
in this region.
Of the materials engineers we surveyed, 59
per cent are happy in their jobs, 39 per cent are
satisfied with their salaries, and 84 per cent
expect to stay in engineering for at least the
next five years.
The average age of engineers in the sector
is 44, with 91 per cent describing themselves as
white. The sector boasts a better than average
gender balance, with females accounting for
10 per cent of responses.
In line with other sectors, many of those
responding believe that the biggest issue
industry faces has to do with industry and
knowledge. 29.6 per cent of respondents feel
that action on the gender gap should be
a priority for industry.
08 materials
Junior engineer
Senior engineer / manager
Director or above
Scotland,Wales & NI
North
South West
Outside UK
Midlands & East Anglia
London & south East
33,990
41,996
64,408
33,125
36,000
44,355
41,950
44,422
46,414
£41.9kThe average salary of senior engineers or above working in the defence and security/marine industries
average salary by seniority
average salary by region
JUNE 2015 | theEnGineeR | 1211 | theEnGineeR | JUNE 2015
“Salaries in the civil and
structural sectors are only
just above average, and
satisfaction levels are
relatively low. However,
the industry boasts the
healthiest diversity
credentials
Despite turbulent times during the recession,
the UK’s rail, civil and structural engineering
industry is now on the receiving end of billions
of pounds worth of investment in new
infrastructure projects. As a result, engineers
working in the sector frequently find themselves
working on some of the UK’s most iconic
flagship projects.
The average salary in the industry is £46,830,
which puts it below many other sectors,
including automotive, aerospace and oil and
gas. And perhaps as a result of this the sector
boasts mixed satisfaction levels. 39.4 per cent
of respondents say they are happy with their
salaries, which puts the sector near the top
of the table.
However, the same percentage say they are
happy in their jobs, which, when compared to
the results from other sectors, is relatively low.
As a result 52.1 percent report that they are
considering a change in job, which puts the
sector behind just the food and drink and the
chemical and pharmaceutical sectors.
That increases to £45,200 for civil engineers
working in Wales, Scotland and Northern
Ireland, while those in the South West earn
significantly less, on £35,438.
The largest single group of respondents
(27.7 per cent) are based in London and the
South East where the average salary is £43,760.
However, the highest average salary (£45,200)
for the sector is found in Scotland,Wales and NI
which accounted for 7.5 percent of responses
from civil, rail and structural engineers.
Respondents are evenly spread across the
seniority levels, and the differences in salary for
junior, senior and director level engineers are
roughly in line with those seen elsewhere in
industry.
Although the industry is perceived by many
to be very male-dominated, civil and structural
engineering has a significantly better gender
balance than of any of the other sectors
surveyed, with women making up 15 per cent
of its engineering workforce. It is also the most
multi-cultural sector, with 26 per cent of those
surveyed describing themselves as non-white,
compared to eight per cent for engineering as
a whole. The average age is 40.
07. rail /
civil & sructural
Junior engineer
Senior engineer / manager
Director or above
Scotland,Wales & NI
North
South west
Outside UK
Midlands & East Anglia
London & South East
33,678
44,257
62,555
35,438
38,344
40,250
39,995
43,760
45,200
£44.3kThe average salary of senior engineers working in the rail / civil and structural sectors
average salary by seniority
average salary by region
7. The UK’s thriving medical technologies industry
consists of thousands of small and medium-
sized companies, developing new devices and
treatments for the healthcare market.
This is partly because inventing world-
changing medical technology is a fast-moving
and costly business and there’s always a risk
your new device might never make it through
clinical trials. However, small companies are
also much quicker when it comes to creating
jobs. And the UK’s medtech sector has
experienced a boom in recent years, growing
6.6 per cent in 2012 compared to the 0.2 per
cent growth in the wider economy.
Around a quarter of the engineers working
in the industry are based in the South East of
England. The average salary in the sector is
£44,379, and 47 per cent receive a bonus.
Once again, engineers working outside the
UK can expect to earn the highest wages,
taking home £48,757 on average. That compares
to £39,299 for medical engineers in Wales,
Scotland and Northern Ireland. The second-
highest average salaries are found in the South
West (£45,769)
Half of the engineers in the sector said they
were happy in their current jobs, and 36 per
cent are satisfied with their salary. Just 48.3 per
cent are potentially considering a change of job,
which is lower than every other sector apart
from Defence & Security and materials.
Of the engineers surveyed, 92 per cent are
male, and the same percentage describe
themselves as white. The average age is 43.
10. medical
Junior engineer
Senior engineer / manager
Director or above
Scotland,Wales & NI
North
South West
Outside UK
Midlands & East Anglia
London & South East
26,790
43,747
59,008
39,299
42,630
44,326
43,441
45,769
48,757
£43.7k
average salary by seniority
average salary by region
The average salary of senior engineers working in the medical industries
Salary survey In partnership with: In partnership with:
JUNE 2015 | theEnGineeR | 1413 | theEnGineeR | JUNE 2015
Engineers in these
sectors accounted for 8.4
per cent of our overall
sample group. Salaries in
the sector are just above
average, but satisfaction
levels appear to be
relatively low
“
There may not be any British electronics
companies with household names to rival the
likes of Apple, Samsung or Sony, but the UK
does house the largest consumer devices
manufacturing sector in Europe.
According to the results of our survey, the
average salary for engineers in the field - which
accounts for 8.4 per cent of our total response is
£46,489, which is just above the average salary
for all respondents and places the sector above
the medical, academic and Food & Drink /
consumer goods fields.
Responses come from across the UK, and
although London and the South East represents
the largest grouping (24.9 per cent), the
Midlands (12.4 per cent) and the South West
(14.3 per cent) are also well represented.
Telecoms and electronics engineers working
in London and the South East command the
highest salaries, at around £47,293, while those
in Wales, Scotland and Northern Ireland earn
the least, at £39,375.
Whilst the average salaries for senior and
director level engineers compare favourably
with other sectors, junior engineers working
in the field appear to be, on average, the most
poorly paid junior engineers in industry, earning
just £26,790. Unsurprisingly, the major factor
driving engineers in the sector to consider other
opportunities is a better salary. However many
also report a desire to engage with a new
challenge as a big motivating factor.
Perhaps unsurprisingly, this translates into
fairly poor satisfaction levels across the sector
with only 28.7 per cent of respondents happy
with their salary and more than half (55 per
cent) considering a change of job.
The average age of engineers working in
this sector is, at 45.2, slightly above the broader
industry average and 94.7 per cent of
respondents are male. 87.9 per cent of those
surveyed describe themselves as white, and just
over 10 per cent as black,Asian or multi-ethnic.
Wider attitudes to the sector reflect concerns
raised in other areas of industry. 52.9 per cent
of respondents feel that lack of industry
knowledge is an issue that needs addressing,
whilst 28.3 per cent consider action on
industry’s gender gap to be important.
09. telecoms and
utilities / electronics
Scotland,Wales & NI
North
South west
Outside UK
Midlands & East Anglia
London & South East 47293
45710
42670
43004
41797
39375
£47.3k
salary by region
Average telecomms, utilities & electornics salary in London & South East
“The UK’s fast moving
medical sector has been
tipped for greatness and
has experienced a boom
in recent years. Salaries
are justabove average
but satisfaction levels
are particularly high
8. “Engineers working
in these sectors account
for 6.9 per cent of overall
response. Average salaries
are low, as are satisfaction
levels, with 52.6 per cent
considering a change
of job
The food and drink industry is the UK’s largest
manufacturing sector, with 15 per cent of the
country’s production output, while demand for
consumer goods is likely to increase as the
economy improves.
Engineers working in these sectors account
for 6.9 per cent of the overall survey response.
The average salary for engineers working in
the food and drink / consumer goods sectors is
£42,082, the lowest amongst all of the groups
sampled in the survey.
Overall, engineers working in the two
industries earn the highest wages in London
and the South East, at £44,654, while those
based overseas earn the least, with an average
salary of £36,041.
Seniority-based salary variation is
unspectacular when compared with other
sectors. Whilst those at director level or above
are earning an average of £53, 150, junior
engineers are only just over £20k behind
them on £30,209.
Unsurprisingly, given the relatively low
salaries, engineers working in this group are
some of the least satisfied with their salary.
Just 29.1 per cent say they are happy with
their level of remuneration.
Given the importance of salary to all of those
who responded to the survey, these sectors
perform relatively poorly in most of the other
measures of satisfaction.46.2 per cent of
respondents say they are happy in their current
roles, and 52.6 per cent say they are considering
a change of job. Only the telecoms / utilities and
electronics sectors have a greater percentage of
potential leavers.
The sector features one of the worst male
to female gender ratios amongst all of the
surveyed sectors with female engineers
accounting for just 1.5 per cent of respondents.
Just under a quarter of those surveyed believe
that the gender divide is an issue requiring
attention, so there is perhaps some hope that
the balance may improve in the future.
On a more positive note, the sector is more
ethnically diverse than some others, with 7.8
per cent of respondents coming from black,
Asian or multi ethnic backgrounds. Interestingly,
at 2.9 per cent, the sector boasts one of the
highest proportions of black engineers
of all groups surveyed.
12. food & drink/
consumer goods
Junior engineer
Senior engineer / manager
Director or above
Scotland,Wales & NI
North
South West
Outside UK
Midlands & East Anglia
London & South East
30,209
42,887
53,150
36,041
40,659
43,438
42,333
44,205
44,654
average salary by seniority
average salary by region
£42.9kThe average salary of senior engineers working in the food & drink / consumer sectors
Scotland,Wales & NI
North
South West
Outside UK
Midlands & East Anglia
London & South East 55889
46391
43579
45111
33857
24077
£55.8k
salary by region
The average salary of engineering academics in London & South East
Salary survey In partnership with:
15 | theEnGineeR | JUNE 2015 JUNE 2015 | theEnGineeR | 16
Salaries for engineers
in academia are lower than
average, and whilst half
are happy in their jobs,
many feel overworked
“
The UK’s engineering research leads the world
in its productivity, thanks to the vital
collaboration between industry and academia.
Engineers working in academia account for
a relatively low percentage of respondents (just
2.7 per cent) but the findings nevertheless
provide interesting insight into the
remuneration and satisfaction levels in this
critical area.
The average salary of engineers in academia
is £43,290 although this rises significantly to
£55,889 for those based in London and the
South East.
Academics based overseas earn the least,
on average, at around £24,077.
Just 6 per cent of engineers in academia
receive a bonus on top of the salary, by far the
lowest proportion in our survey. Academics
are also the most likely to feel overworked
and undervalued by their employers,
although around half are happy in their
jobs overall.
11. academia
Employer focus
supported by
Working for the Science and Technology
Facilities Council (STFC), you’ll join
a community of experts that is driving
science and technology forward.
We provide and exploit space and
astronomy technology, a world-leading
neutron scattering facility, ultra-fast
supercomputers, amazing scientific
instruments and some of the most
powerful lasers in the world.
Our world-class facilities are home
to an incredible diversity of projects.
Our engineers design cutting-edge
solutions in areas including cancer
treatment, airport security, hydrogen-
powered cars, energy generation and
accident scene emergency care.
We offer the opportunity to work
on projects that lead to real-world
solutions in areas such as health,
national security and future energy.
With the flexibility and freedom to
focus on what you do best, and our
incredible facilities, you can help shape
societies, strengthen economies, and
transform lives. With STFC you can
play a part in breakthroughs and
achievements that will give you
lifelong pride and satisfaction.
9. JUNE 2015 | theEnGineeR | 1817 | theEnGineeR | JUNE 2015
01. job satisfaction
Despite some well-documented gripes
– particularly around salary issues – UK
engineers are a moderately satisfied bunch
when compared with other industries. More
than 50 per cent of respondents state that
they are happy in their jobs, almost half are
comfortable with their workload, and around
a third feel that they are underpaid.
Scottish engineers have the greatest sense
of job satisfaction, while those in the South
West of England are most likely to complain
about their salary, according to the survey.
Around half of all the engineers who
responded to the survey say they are happy in
their current job, but only 35 per cent feel that
their earnings suitably reflect their workload.
working in academia, who were most likely
to be unhappy with their workload, and to feel
undervalued by their employers (38.1 per cent)
As well as their own immediate concerns,
respondents were also asked about wider
issues, and which skills or attributes they
consider to be lacking in the engineering
industry. Just over half (50.9 per cent) cite
industry knowledge as an attribute that is
lacking in the sector today, whilst 37.3 per cent
say that a lack of communication skills is an
issue that needs addressing. Interestingly,
professional qualifications appear to be less
of a priority issue, with just 15 per cent of
respondents saying that industry falls down
in this area.
compares with engineers in the oil and gas
industry, where 47 per cent are happy with
their salary, against an average of 35 per cent.
Engineers working in the materials sector
enjoy their work more than those in other
sectors, with 59.4 per cent happy in their
current jobs. This sector is closely followed by
oil and gas, where 57.1 per cent of respondents
say there are happy in their current jobs.
Engineers in the materials sector are also the
most likely to feel valued by their employers
(46.9 per cent). Again, the sector is closely
followed by oil and gas, where 45.9 per cent say
they feel valued, and the energy / renewables /
nuclear sectors where 45.8 per cent feel valued.
But spare a thought for those engineers
Across the UK, 41 per cent of engineers in
the North East of England say they are happy
with their salary, compared to only 32 per cent
in the South West. And while 57 per cent of
Scots are happy in their jobs, only 21 per cent
of Welsh engineers feel the same way.
Overall, male engineers appear to be
marginally happier with their lot than their
female counterparts, with a slightly greater
percentage satisfied with both their jobs and
pay. This perhaps reflects the substantial pay
gap between the men and women surveyed.
Despite this, marine engineers are also the
most likely to be unhappy with their pay, with
49 per cent discontented with their earnings
compared to an average of 35 per cent. This
Salary survey In partnership with: In partnership with:
Scotland,Wales & NI
North
South west
Outside UK
Midlands & East Anglia
London & South East
31.9
34.3
34.6
34.9
35.6
36
28.5
36.1
28.7
38.8
29.1
39.3
31.9
39.4
34
42.2
35.9
46.9
percentage happy with salary
by region
percentage happy with salary
by sector
Defence and security / marine
Aerospace
Energy / renewables / nuclear
Telecoms and utilities / electronics
Automotive
Materials
Academia
Chemical and pharma
Rail / civil and structural
Medical
Food and drink / consumer goods
Oil and gas
Percentage
considering
change of job
Percentage
happy in
current job
Percentage
content
with salary
Average
age
Average
salary (£)
Percentage likely
to stay in industry
for five years
Percetage that
feel valued in
current role
Percentage
that do not
feel valued
46.5 86.1 45.9 26.1
50.1 86.4 45.8 26.6
43 89.9 42.3 30.5
49 84.6 37.9 31.2
52 87.1 37.4 28.6
49.4 84.7 40.5 30
52.1 85.7 42.6 23.9
44 84.4 46.9 23.1
55 80 40.7 28.3
48.3 80 38.6 24.8
48.4 85.6 33 38.1
52.6 85.7 37.8 31.9
Sector
Oil and gas
Energy / renewables / nuclear
Defence and security / marine
Aerospace
Chemicals and pharma
Automotive
Rail / civil and structural
Materials
Telecoms / utilities / electronics
Medical
Academia
Food and drink / consumer goods
55,265 42 46.9 57.1
54,405 42.6 39.3 57
53,151 43.1 28.5 53.6
51,283 42.2 31.9 50.2
49,887 45 42.2 48.3
48,953 44 34 48.7
46,830 40.1 39.4 39.4
46,798 44.2 38.8 59.4
46,489 45.2 28.7 41.7
44,379 43.1 35.9 51
43,290 45.5 36.1 48.5
42,082 44.1 29.1 46.2
In partnership with:
Senior engineer / manager
Director or above
Junior engineer 31.7
33.7
46.5
% happy with salary by seniority % happy with salary by age % happy in job by age
35.2
32
36.6
35.1
36.2
60+
30–39
50–59
> 30
40–49
60.5
46
47.2
51.6
57.8
60+
30–39
50–59
> 30
40–49
10. 19 | theEnGineeR | JUNE 2015 JUNE 2015 | theEnGineeR | 20
Despite the satsifaction and salary concerns
reported in the previsou section, respondents
are a fairly settled bunch it would seem.
The vast majority of those surveyed – 84 per
cent – expect to remain in engineering for the
next five years, and only 7 per cent are likely
to leave within that time.
Of those engineers that are considering
a change of profession, most cite the need for
a fresh challenge as the reason for their itchy
feet, whilst those hankering after a change
of job within industry are more likely to be
motivated by a better salary.
Amongst the different sectors, engineers
in the defence & security / marine sector are
most likely to remain in industry for the next
five years (89.9 per cent) whilst those working
in the medical and telecommunications, utilities
and electronics sectors are apparently the least
settled, with 80 per cent saying they will
definitely stay in industry for the next five years.
When it comes to moving around within the
industry, around half of engineers are content to
stay in their current position, while 41 per cent
are considering a new job. Perhaps
unsurprisingly, the biggest motivator for those
looking for a new role is a desire for a better
salary, with 68 per cent of those interested in
a change of post citing it as their main reason
for doing so.
Once again, engineers in the defence,
security & marine sectors appear to be the
least likely to want to move, whilst 57.3 per cent
of those from the food & drink / consumer
industries are considering a change of sector.
Although similar percentages of men and
women are considering a change of job, a
higher percentage of women are considering
moving out of engineering altogether. A lack
of opportunities for flexible working, which is
often cited as one of the main reasons for the
shortage of women in industry, is given as
a factor by around a third of female engineers
wishing to leave the profession. For women
wanting to switch jobs salary is the main factor.
02. change of job / leaving industry
% likely to remain in industry
(next 5 years) by sector
% considering a change of job
by sector
89.9
85.6
87.1
84.7
86.4
84.6
86.1
84.4
85.7
80
85.7
80
Defence and security / marine
Aerospace
Energy / renewables / nuclear
Telecoms and utilities / electronics
Automotive
Materials
Academia
Chemical and pharma
Rail / civil and structural
Medical
Food and drink / consumer goods
Oil and gas
57.3
52
56.9
51.7
55.1
51.5
55
49.4
54.8
47.8
53
Aerospace
Energy / renewables / nuclear
Telecoms and utilities / electronics
Automotive
Materials
Academia
Chemical and pharma
Rail / civil and structural
Medical
Food and drink / consumer goods
Oil and gas
46Defence and security / marine
top 3 motivations for considering
a change of job within industry (%)
68.0
66.8
48.3
Better salary
Limited opportunity in current role
New challenge
top 3 motivations for considering
a change of job outside industry (%)
64.4
48.0
43.3
Better salary
Limited opportunity in cuurent role
New challenge
Salary survey In partnership with:
% receiving contributory pension by sector
% receiving bonus by sector
% receiving bonus by seniority
03.benefits&bonuses
If you are looking for an engineering job
that is likely to come with a bonus on top
of your salary, head for the chemicals &
Pharmaceuticals sector, where 62 per cent
of respondents receive an annual bonus.
On average just under half of engineers
across all sectors receive a bonus, but as well as
chem & pharma the various energy sectors all
perform particularly well. The worst performing
sector is academia, where just 6 per cent of
respondents say that they receive a bonus.
There is some variation across the seniority
levels, with senior engineers / managers most
likely to receive a bonus (48.4%) and junior
engineers least likely to benefit (38.5%)
In partnership with:
48.4
47.8
38.5
Senior engineer or manager
Junior engineer
Director or above
62
47.1
53
46.7
51.7
45.3
49.8
40.5
48.7
38
47.6
6.2
Defence and security / marine
Aerospace
Energy / renewables / nuclear
Telecoms and utilities / electronics
Automotive
Materials
Academia
Chemical and pharma
Rail / civil and structural
Medical
Food and drink / consumer goods
77.3
69.9
75.4
69.9
74.1
68.7
72.7
67.2
71.2
65.9
71
63.1
Defence and security / marine
Aerospace
Energy / renewables / nuclear
Telecoms and utilities / electronics
Automotive
Materials
Academia
Chemical and pharma
Rail / civil and structural
Medical
Oil and gas
Food and drink / consumer goods
Oil and gas
A total of 80.9 per cent of respondents
have some form of pension with 70.9 per cent
enjoying the benefits of a contributory pension.
Once again, there is some variation across the
different sectors, with engineers from academia
most likely to be enrolled on contributory
schemes (77.3 percent) and those in the
materials sector least likely (63.1 per cent)
Of the other perks engineers receive, 40 per
cent benefit from private medical insurance and
28.9 are able to make use of flexible working
arrangements.
Unsurprisingly, engineers in academia have
the longest holidays of each of the sectors, with
around three quarters benefiting from more
than 26 days paid leave. This compares sharply
with the food and drink industry, where only
a quarter receive the same amount of paid
holiday.
It’s not all bad news for those in the food
and drinks industry though, as they are also the
second-most likely to receive private medical
insurance, with 54 per cent of engineers in the
sector benefiting from the perk.
%
receiving
private m
edical
insurance
%benefitting
from
flexible
working
oil and gas 53.2 27.7
food drink & consumer 46.7 21.4
materials 43.5 17.3
medical 42 28
automotive 41.1 22
aerospace 36.6 40.6
rail civil &strucutural 35.9 29.7
energy, nuclear
& renewables 35.4 35.1
defence security
& marine 28.3 44.1
academia 7.2 32
11. Salary survey In partnership with:
21 | theEnGineeR | JUNE 2015 JUNE 2015 | theEnGineeR | 22
04. routes into industry 05. professional registration
% professionally registered
by sector
% apprenticeships by age
% professionally registered
by salary
% professionally registered by seniority% degrees by age
% agree professional registration
leads to higher salary by seniority
53.5
35.8
47
30.7
46.3
29.6
45.3
29.1
39.3
25.2
39.2
24.6
Defence and security / marine
Aerospace
Energy / renewables / nuclear
Telecoms and utilities / electronics
Automotive
Materials
Academia
Chemical and pharma
Rail / civil and structural
Medical
Food and drink / consumer goods
Oil and gas
% qualified by apprenticeships
by sector
50.8
38.3
48.3
37.5
47.7
34.7
41.2
34.6
40.8
33.1
39.9
31.6
Defence and security / marine
Aerospace
Energy / renewables / nuclear
Telecoms and utilities / electronics
Automotive
Materials
Academia
Chemical and pharma
Rail / civil and structural
Medical
Food and drink / consumer goods
Oil and gas
% qualified by bachelor / hons degree
by sector
53
56.2
50
49
49.1
55.3
52.4
44
43.2
53.6
44.8
50.7
Defence and security / marine
Aerospace
Energy / renewables / nuclear
Telecoms and utilities / electronics
Automotive
Materials
Academia
Chemical and pharma
Rail / civil and structural
Medical
Food and drink / consumer goods
Oil and gas
63.2
56.8
8.6
44.3 25.2
53.6
51.3
10.1
35.7 17.8
38.8
30.7
52
28.3 14.425
24.1
56.9
76k+
60+
Directors and above Directors
and
above
> 30k
30–39
51–75k
50–59
Senior engineer and manager Senior
engineer and
manager
60+
30–39
50–59
40–49
31–50k
40–49
Junior engineer Junior
engineer
When it comes to getting into engineering,
whether through apprenticeships or a degree,
there is a significant age divide.
The younger generation, on the whole, favour
the university route. Engineers between the
ages of 30 to 39 are most likely to have a degree,
with 56.9 per cent of respondents entering the
industry in this way. This group is closely
followed by the under 30s, where 55.1 per cent
of respondents entered industry via the degree
route.
These two age groups are the least likely to
have undertaken an apprenticeship, with just
23.5 per cent of under 30s and 25 per cent of
under forties having chosen this route.
At the other end of the age scale over 60 per
cent of all engineers between 60 and 69 entered
the profession via an apprenticeship, and just
over half of those between 50 and 59 took the
same route.
The food and drink industry has the highest
proportion of engineers who have undertaken
an apprenticeship, with 50.8 per cent, which
compares to an average of 41 per cent for the
profession as a whole. Automotive and
aerospace, two of the UK’s largest and most
established sectors also fare well, with 40.8 per
cent and 47.7 per cent respectively qualifying
via an apprenticeship. The lowest percentage
of apprenticeship-qualified engineers can be
found in the rail / civil & structural sectors
where just 31.6 per cent of respondents entered
industry in this way.
Meanwhile, the energy, renewables and
nuclear sectors boast the highest proportion
of engineers with degrees, with 56.2 per cent
of respondents qualifying via this route. These
sectors are closely followed by Chemicals &
Pharmaceuticals, telecoms and utilities and
medical. Somewhat surprisingly given its close
links with the academic research base, the
lowest percentage of degree-qualified engineers
(43.2%) is found in the materials sector which
also has a relatively low-level of apprentice-
qualified workers (34.6%).
Despite the concerted efforts of the various
engineering bodies to encourage engineers to
pursue professional registration, only a third of
respondents have done so.
In general the percentage of professionally
registered respondents increases the higher up
the pay scale an engineer sits and well over half
of those earning £51k or above are registered.
However, this figure drops off further down
the pay scale with 30.7 per cent of those
earning between £31 and 50k registered, and
less than a quarter of those earning less than
£30k opting to pursue registration.
There is also some variation in levels of
professional registration from sector to sector.
There are, for instance, relatively high levels of
registration amongst respondents from the
energy, process and civil sectors, but low levels
in other areas such as food, drink and consumer
goods where just 24.6 per cent are registered.
This is perhaps an interesting measure of the
degree to which the perceived value of
registration varies across industry.
Neither age nor gender seem to play a role
in determining whether an engineer is
professionally registered, with more or less
equal percentages of engineers from each of
the age brackets, and equal proportions of men
and women, choosing to follow this path. There
is however, some disparity when it comes to
ethnicity, with 39.7 per cent of Black,Asian,
minority enthnic (BAME) respondents choosing
registration, compared to 35.3 per cent of white
respondents. There appears to be much
greater value attached to professional
registration amongst BAME respondents with
29.7 per cent agreeing with the statement that
it leads to a higher salary (compared to just
16.9 per cent of white respondents).
Perception of the value of registration also
rises with seniority (this is unsurprising given
the greater levels of registration higher up the
career ladder) with roughly a quarter of those
at director level also agreeing that it leads
to higher salaries.
12. Salary survey In partnership with:
23 | theEnGineeR | JUNE 2015 JUNE 2015 | theEnGineeR | 24
06. gender & diversity
average salary by gender
£37,533
£45,479
94.5%
5.5%
% industrys ethnic diversity
% BAME (black, asian, minority
ethnic by seniority
Industry’s ethnicity
gap is equally marked
with just 7.3 per cent of
respondents describing
themselves as black,
Asian or minority ethnic.
The civil and strucutural /
rail sector boast the
highest levels of diversity
across the board with
a 15 per cent response
from women, and
17.5 per cent from
BAME groups
Addressing industry’s gender imbalance
continues to be a major priority across all
engineering sectors, and our survey results
provide a reminder of why this is such an issue
– with women making up just 5.5 per cent of
our respondents, a figure which echoes other
external snapshots.
In the individual sectors, the industry that
appears to be doing the best job of attracting
women is civil and structural engineering,
where 15 per cent of the professional workforce
are female. This is followed by the materials
sector, in which 10 per cent are female.
At the other end of the spectrum, however,
less than one per cent of engineers in the
consumer goods sector are women.
So why is there still such an enormous
gender gap in engineering, despite all the hard
work of the various bodies to encourage more
women into industry?
Despite the striking difference in average
salaries (women engineers responding to the
survey earn almost £10,000 less than men) it’s
unlikely that pay is the key issue here. Indeed,
this disparity is explained by the higher
proportion of men in senior positions (24.4%
of female respondents described themselves as
junior engineers, compared to just 12% of the
males who took part)
What’s more, the problem does not appear
to be primarily one of job satisfaction, since the
women we questioned were only marginally
less likely to be happy with their pay and role
than their male counterparts.
It also cannot be explained by women
leaving the profession to start a family, since
the highest proportion of female engineers are
in the early thirties age band, at 19 per cent.
This is closely followed by women in their late
twenties (18 per cent) and late thirties, (13 per
cent).
The number of female engineers appears to
drop sharply as women enter their early fifties,
an age band that in contrast has the highest
proportion of male engineers surveyed.
This perhaps suggests that efforts to
encourage more women into the profession
in recent years are starting to bear fruit, even
if much more work is needed.
Promisingly, it appears to be an issue that
a large number of engineers agree needs
addressing, with more than a quarter of
respondents agreeing that the gender gap
is an important issue.
Industry’s ethnicity gap is a less-widely
gender split % women by seniority
4.2
4.6
10.9
Directors and above
Senior engineer and manager
Junior engineer
2.8
8.1
4.8
8.2
5.7
9.6
6.2
10.5
6.4
15.5
7.3
17.5
Defence and security / marine
Aerospace
Energy / renewables / nuclear
Telecoms and utilities / electronics
Automotive
Materials
Academia
Chemical and pharma
Rail / civil and structural
Medical
Oil and gas
Food and drink / consumer goods
1
4
2 3
90
White 90%
Black 1%
Asian 4%
Multiple ethnic groups 2%
Other 3%
Overall women
account for just 5.5 per
cent of repondents.
Female respondents
earn on average £10k
less per year than their
male colleagues
“
“
discussed issue, but is equally pronounced.
Overall, 89.9% of respondents describe
themselves as White, and just 7.3% as BAME
(Black,Asian and minority ethnic).
These findings are broadly in tune with
other sets of statistics. Indeed, according to the
according to the Office for National Statistics
(ONS) Labour Force Survey, whilst ethnic
minorities make up 24% of first degree
qualifiers, they make up only 6% of those
working in engineering occupations.
As shown there is however some marked
variation in these percentages across the
different sectors. For instance, whilst just 2.8 %
of respondents from the Chemical and
Pharmaceutical sector define themselves as
BAME the Civil & Structural / Rail sectors
boasted a far healthier figure of 17.5%.
Across the board, respondents defining
themselves as Asian account for the largest
group of non-white respondents overall (4.6%).
However, in some sectors this is particularly
marked. Indeed, in the automotive, aerospace,
chemical & pharmaceutical, and energy sectors
no respondents describe themselves as black.
This would appear to reinforce concerns that
industry has historically been particularly poor
at engaging with the UK’s Afro-Carribbean
communities.
In salary terms BAME respondents fare less
well than white engineers. The average salary
for a white respondent is £47,880. For BAME
respondents it is £39,195. This is at least partly
explained by a lower proportion of senior
engineers in the BAME grouping. 87.2% of
white respondents are at senior engineer level
or above, whilst 73.5% of BAME respondents
fall into this category.
Interestingly, whilst many respondents
agree that action on the gender divide is
important, fewer regard the ethnicity balance
as an issue, with just 7.6% of respondents
flagging it as a priority concern.
13. Salary survey
25 | theEnGineeR | JUNE 2015
07. age
% engineers over 50 by sector
% engineers under 30 by sector
47.9
39.3
44.2
36.3
43.3
36
42.9
35.7
41.4
35.3
40.2
27
Defence and security / Marine
Aerospace
Energy / Renewables / Nuclear
Telecoms / Utilities / Electronics
Automotive
Materials
Academia
Chemical and pharma
Rail / Civil and structural
Medical
Food and drink / Consumer goods
22.5
12.8
16.6
11.5
14.9
9.1
14.4
7.9
12.9
7.4
12.8
3.1
Defence and security / Marine
Aerospace
Energy / Renewables / Nuclear
Telecoms / Utilities / Electronics
Automotive
Materials
Academia
Chemical and Pharma
Rail / Civil and Structural
Medical
Food and drink / Consumer goods
Oil and gas
Oil and gas
44Average age of respondents
to The Engineer’s 2015 salary survey
The ageing nature of the UK’s engineering
workforce has been the subject of significant
debate in recent years, with many concerned
that the impending retirement of many of our
most highly-skilled and experienced engineers
could lead to crippling skills shortages in
a number of key sectors,
But here our survey offers some cause for
optimism. Of those questioned, the average age
of engineer is 44. Engineers in the civil and
structural engineering sector are the youngest
on average, at 40, while the oldest in the
profession can be found in the process industry,
with an average age of 45.
These averages hide a slightly more
worrying trend though, since more engineers
can be found in the 50-54 age band (16.6 per
cent) than any other, suggesting that many will
be retiring over the next ten years. Meanwhile,
at the other end of the spectrum, just 12 per
cent of the engineers we surveyed are under 30.
There is some variation by sector. As the
chart shows, in a number of key sectors –
such as automotive and chemical and
pharmaceutical – more than 40 per cent
Age Salary
Under 30s 31,443
30 – 39 41,035
40 – 49 48,386
50 – 59 51,157
60+ 54,583
of respondents are over the age of 50.
Unsurprisingly, the civil sector boasts the
highest proportion of younger engineers, with
22.5 per cent of respondents from the sector
coming from the under 30s age group.
Interestingly, the energy, nuclear and
renewables sectors, which are frequently
reported as being particularly concerned about
their ageing demographic fare pretty well. 12.8
per cent of respondents from these sectors are
under 30, and just 35.3 per cent are over 50.
Average salaries appear to increase with age,
which is perhaps unsurprising as there is a
close association between age and seniority.
Indeed, whilst Junior Engineers account for
16 per cent of respondents in the 30 – 39 age
group, they only make up 3.2 per cent of the
sample group in the 50 – 59 age bracket.
The average age of
a survey respondent is 44,
however more engineers
can be found in the 50 - 54
age bracket than any other,
reinforcing the importance
of inspiring a new
generation to take up
industry’s baton
“