1. NMR Characterization of Biochars
By Catherine Brewer
Center for Sustainable Environmental Technologies, Iowa State University
Introduction
Nuclear magnetic resonance spectroscopy (NMR) uses a very strong magnetic field and radio
frequency (RF) pulses to study the structure of molecules through the resonance frequencies of specific
nuclei within the molecule. In order to characterize biochars, several solid-state techniques utilizing 13
C
and 1
H nuclei can be used to determine the relative quantity of carbon functional groups, the
approximate degree of condensation of the aromatic rings, and the overall structure of the char
molecules. The following describes some of the theory of NMR and how chars are characterized at Iowa
State University.
Theory
The net magnetization (M) of a sample is the sum of the magnetic moments of the individual
nuclei in the sample molecules. Magnetic moments can be thought of as vectors, and are the products
of the magnetogyric ratio (a constant different for each type of nucleus), γ, and the angular momentum,
L, such that
M= γL
Within a magnetic field, B, a torque (T = -M x B) is exerted on the magnetic moments such that:
dM/dt = -γM x B
The uniform magnetic field applied by the superconducting magnets in an NMR experiment is typically
referred to as B0. The applied field causes the nuclei to precess (wobble like a spinning top) about the
field at a given Larmor frequency:
ω0 = -γB0
This Larmor frequency is the fundamental frequency at which an NMR experiment is run and varies with
the nuclei and the strength of the magnetic field. For example, the instrument used to characterize the
biochars is a Bruker DSX 400, allowing 1
H experiments to be performed at 400 MHz and 13
C experiments
at 100MHz. The key concept to NMR usefulness is that nuclei are also influenced by neighboring nuclei
and their electron clouds, each of which exerts its own small magnetic field. The resulting “combined
magnectic field” precession frequency of a given nuclei, ωL, is then:
ωL = -γBtotal
where Btotal = B0 + Blocal; Blocal is the sum of the local magnetic fields. Nuclei in different environments
will, therefore, precess around the strong B0 field at slightly different frequencies, thus resulting in a
detectable spectrum. The distance on the x-axis between different signals in the spectrum is called the
2. chemical shift and it is measured in dimensionless “units” of ppm of ω0. (The differences between nuclei
frequencies are generally on the order of Hz, where the Larmor frequency is on the order of MHz.) As a
dimensionless scale, chemical shift is measured against a reference material, typically tetra-methyl
silane (TMS) for 1
H, 13
C and 29
Si studies. For 13
C on this instrument, the chemical shift spectrum was
calibrated using a carbon peak at 176.49 ppm from 25% 13
C-labeled glycine as a secondary reference.
Solution vs. Solid-State NMR
Characterizing materials in the solid state requires the use of specialized techniques to
overcome several challenges. In liquid/solution NMR, liquid samples or samples dissolved in a liquid
solvent tend to give very sharp, high resolution spectra. Three magnetic field inter-nuclear interactions
in solid-state NMR make high resolution spectra difficult: heteronuclear dipolar couplings, homonuclear
dipolar couplings and chemical shift anisotropy (CSA).
Dipolar couplings are when the magnetic fields of nuclei affect the frequency, ωL, of other
nuclei; the nuclei involved can be the same (homonuclear) or different (heteronuclear). Since dipolar
coupling is a through-space interaction (and not just across chemical bonds), the numbers of possible
nucleus-nucleus and nucleus-static field orientations are immense, causing the spectral peaks to
broaden and overlap substantially.
Chemical shift anisotropy also causes spectral peaks to broaden and overlap but due to a
different interaction. Circulating electron clouds around the nucleus create small anisotropic magnetic
fields, i.e. not the same in all directions (imagine an ellipsoid). If a nucleus and its electron cloud are
oriented toward the B0 field differently than other nuclei, it will have a different resonance frequency,
even if the other nuclei are the same type and in the same type of molecule. In solution NMR,
molecules can move into all possible orientations and can re-orient before dipolar couplings have a
chance to develop; thus, line-broadening by dipolar couplings and CSA is not so significant.
One solid-state NMR technique that helps solve both these problems is magic angle spinning
(MAS). “Magic angle” refers to 54.74°; this angle is significant because when the angle between a
dipolar coupling vector and the B0 is equal to 54.74°, the net dipolar coupling effect is zero. Spinning a
powder sample rapidly can also “average out” a sample’s CSA. Making use of these two facts, samples
for solid-state analysis are commonly packed into cylindrical rotors that, buoyed by an air stream, are
spun at several kHz at an angle of 54.74° relative to the instrument’s static B0 field.
Direct Polarization (DP) vs. Cross Polarization (CP)
Analyzing carbonaceous solid samples to acquire a 13
C spectrum also requires the use of special
techniques to overcome unique challenges. Carbon-13 is a relatively rare isotope of carbon, accounting
for only 1.1% of all C (the rest are carbon-12, which does not have nuclear spin). This means the carbon
nuclei that can be detected in a sample are already dilute. On top of that, 13
C has a small γ value (i.e. it a
relatively weak nuclear magnet), it requires relatively long relaxation times between spectral scans, and
it gives low signal intensity. Acquiring carbon spectra with high signal-to-noise ratios through direct
polarization (DP) techniques is, therefore, relatively time-consuming.
3. Instead of polarizing the carbon nuclei directly, a technique called 1
H-13
C cross polarization (CP)
is used to greatly reduce the analysis time while still acquiring qualitative/semi-quantitative high-
resolution spectra that are suitable for many applications. In this technique, protons (1
H nuclei) are
polarized, then this polarization is transferred to the nearby carbon nuclei by RF irradiation for a certain
cross polarization time (on the order of 1 millisecond). A pulse sequence for dipolar decoupling is then
applied to the protons, and the carbon spectrum is detected. By polarizing the protons instead of the
carbons directly, CP techniques take advantage of 1
H’s much greater abundance, higher γ value, and
much faster relaxation time (~45 times faster); this allows many more scans (for better signal-to-noise
ratio) to be taken in a given length of time. The drawback to CP techniques for studying chars is that it
cannot be considered quantitative since the polarization transfer is not the same for every carbon,
especially those on the inside of large aromatic clusters and far from protons.
Total Suppression of Spinning Sidebands (TOSS)
Magic angle spinning (MAS), while generally effective, does not completely remove CSA effects.
If the CSA broadening is comparable to the spinning frequency, peaks with smaller intensity known as
spinning sidebands (ssb) appear in the spectra at frequencies to the right and left of the “main”
spectrum that correspond to integer multiples of the MAS frequency. These sidebands can become a
problem if they occur at the same frequency as other carbon signals and interfere with identifying the
“real” peaks. The higher the MAS frequency, the farther “away” from the main signal these sidebands
appear. Unfortunately, it is not always practical to just spin the sample faster. To compensate, a pulse
technique called total suppression of spinning sidebands (TOSS) can be applied to mostly eliminate
these sidebands from the spectrum. CP spectra of biochars are typically taken at an MAS frequency of
near 7 kHz, making the use of TOSS desirable.
“Gated Decoupling” (GADE) and “Gated Re-coupling” (GARE)
Dipolar coupling is not always undesirable and, in some techniques, can be used to give
additional information about a sample. For example, to differentiate between protonated and non-
protonated carbons, an additional series of pulses can be applied to the sample that essentially turns
the 1
H-13
C dipolar decoupling on and off such that the signals from protonated carbons disappear from
the spectra, leaving only the non-protonated carbon signals. This pulse technique is called dipolar
dephasing, but is referred to in this set of experiments as “gated decoupling” (GADE). In some cases,
even longer dipolar dephasing is desirable, such as when one wants to estimate the distance between
carbons and their nearest proton neighbors. This is the case with char, since the size of aromatic ring
clusters can be estimated by how long it takes the protons to dephase the signal of a carbon over a long
(several bond) distance. Unfortunately, one purpose of MAS is to minimize protons’ dephasing ability.
In a “gate re-coupling” (GARE) experiment, a series of pulses is used to interfere with the effects of MAS
and thus allow the dephasing time of aromatic carbons to be measured.
NMR Spectral Analysis and Data Interpretation for the Characterization of Biochars
Data from NMR comes in the form of spectra acquired under different magnetic fields and RF
pulse sequences, the raw wave data having been transformed using Fourier transform. Some qualitative
4. data can be interpreted directly from the spectra, specifically the relative presence or lack of functional
groups at their characteristic locations. The most useful and quantitative information, however, comes
from the integration and comparison of specific spectral peaks. Data acquisition, spectrum viewing and
integration are all done on the XWIN-NMR 3.5 software; plots for presentation are made through XWIN-
PLOT 3.5 software and formatted using Adobe Illustrator.
Spectral Interpretation and Integration
The location of characteristic functional group peaks on 13
C spectra are generally the same for
1
H-13
C cross polarization (CP) and 13
C direct polarization (DP); the key difference in char spectra is that
the aromatic C peak (~130 ppm) dominates—relative to the alkyl (~0-90 ppm) and carbonyl (~210-145
ppm) groups—in the DP spectrum more than in the CP spectrum. CP spectra are specifically used for
showing alkyl and carbonyl groups. Peak integration to gain quantitative information is done using the
DP and DP/GADE spectra. Since NMR signals are additive, these two spectra need to have been
acquired with the same number of scans, or each integration multiplied by a ratio to account for the
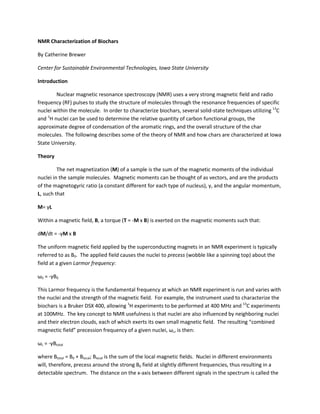
signal intensity difference. Below is a sample DP (thin line: all C) and DP/GADE (thick line: non-
protonated C only) composite spectrum for corn stover fast pyrolysis char, which shows the basic
functional group regions and the lower frequency aromatic C spinning sideband (ssb).
Figure 1. 13
C direct polarization (DP)(thin line) and DP with gated decoupling (DP/GADE) (thick line)
spectra of corn stover fast pyrolysis char at a magic angle spinning (MAS) frequency of 14 kHz.
To compute the relative amount of each carbon moiety present, one must first set the integral
for the total carbon signal. The aromatic carbon peak has two spinning sidebands, one visible just to the
right of 0 ppm, the other between ~290-250 ppm. These sidebands are significant enough that they
need to be included in both the total carbon signal and the total aromatic carbon signal. In a char DP
spectrum, the total carbon signal, therefore, is set as the sum of areas 287.7-250.0 ppm and 210.7-(-
50.2) ppm, normalized to the value of 1.000. Next, individual moiety peaks are integrated based on the
ppm locations listed in Table 1 below. The aromatic carbon integration requires three steps. First, the
5. total aromatic carbon, Caro-total, is determined by integrating over the main DP spectrum peak (145.5-90.3
ppm) plus both spinning sidebands (287.7-250.0 ppm and 6.2-(-50.2) ppm). Next, non-protonated
aromatic carbon, Cnon-pro, is determined by integrating over the same three ranges in the DP/GADE
spectrum. The protonated aromatic carbon, C-H, is determined by the difference of these sums:
C-H = Caro-total – Cnon-pro
Since the signals of ethers and alcohols within the aromatic and alkyl ranges, a 50/50 split is assumed
and is expressed in the molecular “formulas” for those moieties. The same is the case with the alkanes
(CH2) and alkenes (CH).
Table 1. Quantitative NMR spectral analysis of corn stover fast pyrolysis char from DP/MAS and
DP/MAS/GADE spectra. All values are % of total 13
C signal. CO0.75H0.5 moieties assume a 1:1 ratio of
alcohols and ethers. CH1.5 moieties assume a 1:1 ratio of alkanes and alkenes. Cnon-pro, non-protonated
aromatic carbon.
Char ID
Moieties:
ppm:
Carbonyls Aromatics Alkyls
C=O
210-183
COO
183-165
CO0.75H0.5
165-145
Cnon-pro C-H
145 - 90
HCO0.75H0.5
90-50
CH1.5
50-25
CH3
25-6
1 3.3 5.7 11.5 43.0 26.1 2.5 3.8 4.1
Calculating Aromaticity and Edge Carbons
Several peak comparisons are used in the analysis of char to determine its aromaticity,
to estimate the number of carbons in the aromatic clusters (i.e. the degree of carbonization),
and to provide information about the types of hydrogen in the sample. Table 2 below shows an
example of the values that would be calculated to do this.
Table 2. Aromaticities, fractions of aromatic edge carbons, and minimum number of carbons per
aromatic cluster in corn stover fast pyrolysis char.
Char
ID
Aromaticity
(%)
χCH χC-O χedge,min χalkyl χC=O χedge, max nCmin Harom/Halk
1 81 0.32 0.14 0.47 0.13 0.11 0.71 12 1.2
The aromaticity of the char is defined as the sum of relative signal intensities of the
moieties under the aromatic umbrella, namely the CO0.75H0.5, Cnon-pro, and C-H (Table 1). The
fractions, χ, are defined as the ratio of a given moiety, fx, to total aromatic carbon, far. For example, χCH
is the ratio of aromatic protonated carbons, faCH, to total aromatic carbon, far. The fraction of aromatic
carbons that are edge carbons is assumed to be at least the sum of the aromatic C-H and C-O moieties:
χedge, min = χCH + χC-O
The maximum fraction of edge carbons is assumed to include the alkyl and carbonyl moieties:
6. χedge, max = χedge,min + χalkyl + χC=O
The minimum number of carbons in the aromatic cluster is determined by the number of carbons
needed to satisfy the edge carbon fraction requirements. The lower the edge fraction, the larger the
cluster needs to be, and vice versa. nCmin was calculated using a relationship described in a Solum, et al
paper:
nC ≥ 6/ χedge, max
2
The ratio of aromatic protons to alkyl protons is calculated by adding up the number of hydrogen moles
present in the aromatic moieties * the amount of those moieties and dividing by the number of
hydrogen moles present in the alkyl moieties * the amount of those moieties:
Harom/Halk = (1*aromatic C-H) / (3*CH3 + 1.5*CH1.5 +1.5*HCO0.75H0.5)
References:
Brewer, C.E.; Schmidt-Rohr, K.; Satrio, J.A.; Brown, R.C. Characterization of Biochar from Fast Pyrolysis
and Gasification Systems. Environmental Progress & Sustainable Energy 2009, 28, (3), 386-396.
Derome, A.E. Modern NMR Techniques for Chemistry Research. New York: Pergamon Press, 1987.
Duer, M.J. Introduction to Solid-State NMR Spectoscopy. Malden, MA; Blackwell, 2004.
Laws, D.D.; Bitter, H-M. L.; Jerschow, A. Solid-State NMR Spectroscopic Methods in Chemistry. Angew.
Chem. Int. Ed. 2002, 41, 3096-3129.
Schmidt-Rohr, K.; Spiess, H.W. Multidimensional Solid-State NMR and Polymers. San Diego: Academic
Press, 1994.