Data Driven News Storytelling
•Download as PPTX, PDF•
4 likes•1,358 views

Presentation on Data Driven News Storytelling. Touching on the types of data

Recommended
Recommended
More Related Content
Similar to Data Driven News Storytelling
Similar to Data Driven News Storytelling (20)
Recently uploaded
Recently uploaded (20)
Data Driven News Storytelling
- 2. Data Narrative Visualization +
- 4. Data Driven Journalism Information overload Patterns & Connections
- 7. Data Driven Journalism Information overload Patterns & Connections Research Audience attention
- 8. How? Collate data Research & Compiling Open source tools Story
- 10. How? Collate data Research & Compiling Open source tools Story
- 11. Types of Data Visualization
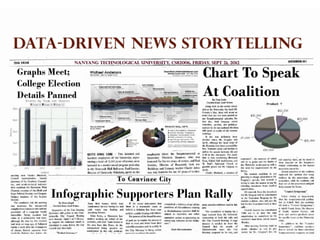
- 12. Charts
- 13. Infographics Voting Infographic http://dailyinfographic.com/who -votes-in-america-infographic
- 15. Narrative structures in Data visualization To improve storytelling Give visuals more significance “DATA IS JUST PART OF THE STORY” - Jonathan Harris
- 16. Narrative structures in Data visualization Martini Glass Structure Interactive Slideshow Drill Down structure
- 17. Martini Glass Structure (non interactive data visualization) The lead Key facts in inverted- pyramid form Chronology of events Kicker
- 19. Martini Glass Structure (interactive data visualization)
- 21. Narrative Structures in Data Visualization: Interactive Slideshow
- 22. Narrative Structures in Data Visualization: Interactive Slideshow Website for Cheese and Burger Society http://www.cheeseandburger.com/
- 23. Fatboys’s menu
- 24. Narrative Structures in Data Visualization: Drill Down Structure
- 26. Conclusion Data is a source for journalists to curate them into stories or diagrams (data visualization) through which help audiences to connect and relate better Job of journalist shifts its main focus from reporting to being the ones explaining to us The objective of the data is to narrate stories to audiences clearly, not to complicate it and confuse them
- 27. Questions?
Editor's Notes
- Making realityinteresting.In the past- pictures & words, and now still pictures and words. Comparing with a video game industry, in the past-super mariov 2d pixel stuff but now you get world or warcraft-amazing graphics.
- via The Guardian UK. Nato operations in Libya: data journalism breaks down which country does what. How many U.S. jobs has Obama’s war without Congressional approval, has this war created?
- challanging-need to design software/programming that can be resued. Mobile platforms Data is now readily available.news rooms have their own software that allows them to programme charts just by adding information, edit etc– allow users to use design toolsThis means that a data collection and processing project that produces a beautifully clean database rich in facts may not actually produce any story at all. Data-driven projects can be a bit of a gamble for the newsroom.On the other hand, the news publishing cycle is more immediate and deadline driven. No story has the luxury of taking too long to be written and published. There is a tension between taking time to get the data in a solid and stable queryable format, and discovering and deriving facts for stories from it.
- challanging-need to design software/programming that can be resued. Mobile platforms Data is now readily available.news rooms have their own software that allows them to programme charts just by adding information, edit etc– allow users to use design toolsThis means that a data collection and processing project that produces a beautifully clean database rich in facts may not actually produce any story at all. Data-driven projects can be a bit of a gamble for the newsroom.On the other hand, the news publishing cycle is more immediate and deadline driven. No story has the luxury of taking too long to be written and published. There is a tension between taking time to get the data in a solid and stable queryable format, and discovering and deriving facts for stories from it.
- Chart is a graphical representation of data, where data represented by symbols such as slices for pie chart show here.Its identify by different colours, there’s legend placed aside to state what the colours stands for.Itsoften used to ease understanding of large quantities of data and the relationships between parts of the data
- Graphic visual representations of information, data or knowledgePresent complex information quickly and clearly using figures and illustrations
- BEFORE: text conveys the story and static graphics give additional details to it esp for information that is hard to imagine and describe.NOW: dynamic interactive interactive graphics leading to a stream of complex data visualization on the web. Appear as though the story is less important BUT this is not true. Narrative is important as it 1. improve story telling.2. To make information more insightfulGive visuals more significance.“Data is just part of the story” - Jonathan Harris
- Non-interactive Data VisualisationMouth of glass: The key factsStem of the glass: The sequence of eventsBase of the glass: Twist in the end EG: How much do you spend on DADs
- Using the Martini glass structure:The key lead would be the title: How much do we spend on DADFollowed by the sequence of events: the different statistics and aspects on the amount spentAs for the kicker, it might be the part on “when will you buy your gift” because it is not directly related to the Title of this infographic. It gives a twist to this information.
- Interactive Data Visualisation Base: the starting point of the applicationStem: single path narrativeMouth: the choices a user has for author’s intended narratives.With this structure, let’s see how this can be used to explain an interactive exhibition called “level Green”EGS: Level Green- interactive exhibition staging
- Base: the starting point of the application -> 25 media exhibits for viewers to choose from.Stem: single path narrative -> selection of a specific data visual to view. Using data sculptures to visualize and contextualize facts and figures -> easily understand and allowed direct comparisons.Mouth: the choices a user has for author’s intended narratives. Because it is an Interactivity installation, it allows users to unravel comprehensive themes and enable playful access to data via touching. With that, the intended narrative is communicated.
- 2. Interactive Slideshowcreate visual interest through collection of information and images. easy to use multimedia platform that will make any presentation more organized and on-topic.- incorporates aninmation, sound -> gain the attention of audience
- EG: cheese and burger society presenting a cheeseburger buffet across the nation.Website:duplicating the idea of a menu, using arrows to flip the menu, as thought it is physically there.Sound effect of themachanism. Presence of a chef/waiter introducing to you the burgers. A very humourous feel to itVery interactive and visually eye-catchingHigh quality images of the burgers. Looking appetitsingOF COURSE WHEN YOU COMPARE IT TO SINGAPORE’S FATBOYS,
- Comparing the previous example to our very own FatBoys, this pales so much in comparison.Interactive slideshow heighten the experience of data analysis and helps to sustain interest among viewers.
- - allows users to select information that provides addition details and backstories to the same theme.- more emphasis on the reader-driven approach, allow users to dictate what and when stories are told Author must thus determine the types of user interaction and decide on the stories and details to include
- Clorox is a company that sells stains removals. To promote their lip-sticks stain removal, they did an infographics to promote and sell their products.“drill down structure” -> Apart from the knowledge of Clorox product, users are exposed to related stories and data, in this case, kissing. Author is careful when it comes to the selection of details to include. With the tagline “ With all the valentine’s day kisses there is bound to be a few lipstick stains”, it draws relationship between kissing and the stain removals the company is selling.
- Using data the job of journalists shifts its main focus from being the first ones to report to being the ones explaining to us what a certain development might actually meanWhen information was scarce, most of our efforts were devoted to hunting and gathering. Now that information is abundant, processing is more important. We process at two levels: (1) analysis to bring sense and structure out of the never-ending flow of data and (2) presentation to get what’s important and relevant into the consumer’s head. Like science, data journalism discloses its methods and presents its findings in a way that can be verified by replication.— Philip Meyer, Professor Emeritus, University of North Carolina at Chapel HillData-driven journalism is the future. Journalists need to be data-savvy. It used to be that you would get stories by chatting to people in bars, and it still might be that you’ll do it that way some times. But now it’s also going to be about poring over data and equipping yourself with the tools to analyze it and picking out what’s interesting. And keeping it in perspective, helping people out by really seeing where it all fits together, and what’s going on in the country.— Tim Berners-Lee, founder of the World Wide Web“In much the way you learn how to be a good writer, keeping sentences short, keep the audience in mind, and not over complicating things to make yourself sound smart, but rather convey meaning to the reader.”— William Strunk Jr. (Elements of Style -- 1918)